
GROWING HIERARCHICAL SELF-ORGANISING MAPS FOR
ONLINE ANOMALY DETECTION BY USING NETWORK LOGS
Mikhail Zolotukhin, Timo H¨am¨al¨ainen and Antti Juvonen
Department of Mathematical Information Technology, University of Jyv¨askyl¨a, Jyvv¨askyl¨a, FI-40014, Finland
Keywords:
Intrusion Detection, Anomaly Detection, N-gram, Growing Hierarchical Self Organising Map, Data Mining.
Abstract:
In modern networks HTTP clients request and send information using queries. Such queris are easy to manip-
ulate to include malicious attacks which can allow attackers to corrupt a server or collect confidential informa-
tion. In this study, the approach based on self-organizing maps is considered to detect such attacks. Feature
matrices are obtained by applying n-gram model to extract features from HTTP requests contained in network
logs. By learning on basis of these matrices, growing hierarchical self-organizing maps are constructed and
by using these maps new requests received by the web-server are classified. The technique proposed allows
to detect online HTTP attacks in the case of continuous updated web-applications. The algorithm proposed
was tested using Logs, which were aquire acquired from a large real-life web-service and include normal and
intrusive requests. As a result, almost all attacks from these logs have been detected, and the number of false
alarms was very low at the same time.
1 INTRODUCTION
In modern society, the use of computer technologies,
both for work and personal use, is growing with time.
Unfortunately, computer networks and systems are
often vulnerable to different forms of intrusions. Such
intrusions are manually executed by a person or auto-
matically with engineered software and can use legit-
imate system features as well as programming mis-
takes or system misconfigurations (Mukkamala and
Sung, 2003). That is why the computer security be-
comes one of the most important issues when design-
ing computer networks and systems.
One of the most popular attack targets are web-
servers and web-based applications. Since web-
servers are usually accessible through corporate fire-
walls, and web-based applications are often devel-
oped without following security rules, attacks which
exploit web-servers or server extensions represent a
significant portion of the total number of vulnera-
bilities. Usually, the users of web-servers and web-
based applications request and send informationusing
queries, which in HTTP traffic are strings containing
set of parameters having some values. It is possible
to manipulate these queries and create requests which
can corrupt the server or collect confidential informa-
tion (Nguyen-Tuong et al., 2005).
One means to ensure the security of web-servers
and web-based applications is use of Intrusion Detec-
tion Systems (IDS). As a rule, IDS gathers data from
the system under inspection, stores this data to log-
files, analyzes the logfiles to detect suspicious activi-
ties and determines suitable responses to these activi-
ties (Axelsson, 1998). There are a lot of diverse archi-
tectures of IDSs and they continue to evolvewith time
(Patcha and Park, 2007; Verwoerd and Hunt, 2002).
IDSs can also differ in audit source location, detec-
tion method, behaviour on detection, usage frequency,
etc.
There are two basic approaches for detecting in-
trusions from the network data: misuse detection and
anomaly detection (Kemmerer and Vigna, 2002; Goll-
mann, 2006). In the case of the misuse detection ap-
proach, the IDS scans the computer system for pre-
defined attack signatures. This approach is usually
accurate which makes it successful in commercial in-
trusion detection (Gollmann, 2006). However,misuse
detection approach cannot detect attacks for which it
has not been programmed, and, therefore it is prone to
ignore all new types of attack if the system is not kept
up to date with the latest intrusions. The anomaly de-
tection approach learns the features of event patterns
which form normal behaviour, and, by observing pat-
terns that deviatefrom established norms (anomalies),
detects when an intrusion has occurred. Thus, sys-
tems which use anomaly detection approach are mod-
633
Zolotukhin M., Hämäläinen T. and Juvonen A..
GROWING HIERARCHICAL SELF-ORGANISING MAPS FOR ONLINE ANOMALY DETECTION BY USING NETWORK LOGS.
DOI: 10.5220/0003936606330642
In Proceedings of the 8th International Conference on Web Information Systems and Technologies (WEBIST-2012), pages 633-642
ISBN: 978-989-8565-08-2
Copyright
c
2012 SCITEPRESS (Science and Technology Publications, Lda.)

elled according to normal behaviour and, therefore,
are able to detect zero-day attacks. However, the
number of false alerts will probably be increased be-
cause not all anomalies are intrusions.
To solve the problem of anomaly detection differ-
ent kinds of machine learning based techniques can be
applied, for example, Decision Trees (DTs), Artificial
Neural Networks (ANNs), Support Vector Machines
(SVMs), etc. As a rule, anomaly detection IDSs for
web-servers are based on supervised learning: train-
ing the system by using a set of normal queries. On
the contrary, unsupervised anomaly detection tech-
niques do not need normal training data and therefore
such techniques are the most usable.
In this study, we consider the approach based on
Self-Organizing Maps (SOMs). A SOM is a based
on unsupervised learning neural network model pro-
posed by Kohonen for analyzing and visualizing high
dimensional data (Kohonen, 1982). SOMs are able
to discover knowledge in a data base, extract rele-
vant information, detect inherent structures in high-
dimensional data and map these data into a two-
dimensional representation space (Kohonen, 2001).
Despite the fact that the approach based on self-
organizing maps has shown effectiveness at detecting
intrusions (Kayacik et al., 2007; Jiang et al., 2009),
it has two main drawbacks: the static architecture
and the lack of representation of hierarchical rela-
tions. A Growing Hierarchical SOM (GHSOM) can
solve these difficulties (Rauber et al., 2002). This
neural network consists of several SOMs structured
in layers, whose number of neurons, maps and layers
are determined during the unsupervised learning pro-
cess. Thus, the structure of the GHSOM is automatic
adapted according to the structure of the data.
The GHSOM approach looks promising for solv-
ing network intrusions detection problem. In the
study (Palomo et al., 2008), a GHSOM model with
a metric which combines both numerical and sym-
bolic data is proposed for detecting network intru-
sions. The IDS based on this model detects anomalies
by classifying IP connections into normal or anoma-
lous connection records, and the type of attack if they
are anomalies. An adaptive GHSOM based approach
is proposed in (Ippoliti and Xiaobo, 2010). Suggested
GHSOM adapts online to changes in the input data
over time by using the following enhancements: en-
hanced threshold-based training, dynamic input nor-
malization, feedback-based quantization error thresh-
old adaptation and prediction confidence filtering and
forwarding. The study (Shehab et al., 2008) investi-
gates applying GHSOM for filtering intrusion detec-
tion alarms. GHSOM clusters these alarms in a way
that helps network administrators to make decisions
about true or false alarms.
In this research we aim to detect anomalous HTTP
requests by applying approach based on adaptive
growing hierarchical self-organizing maps. The re-
mainder of this paper is organized as follows. Sec-
tion 2 describes process of data acquisition and fea-
ture extraction from network logs. In Section 3 we
present classic SOM and GHSOM models. Section
4 describes applying adaptive GHSOM for detecting
anomalies. Experimental results are presented in Sec-
tion 5. Section 6 concludes this paper.
2 DATA MODEL
Let us consider some network activity logs of a large
web-service of some HTTP server. Such log-files can
include information about the user’s IP address, time
and timezone, the HTTP request including used re-
source and parameters, server response code, amount
of data sent to the user, the web-page which was re-
quested and used by a browser software. Here is an
example of a single line from some Apache server log
file, this information is stored in combined log format
(Apache 2.0 Documentation, 2011):
127.0.0.1 - frank [10/Oct/2000:13:55:36 -0700]
"GET /resource?parameter1=value1¶meter2=
value2 HTTP/1.0"
200 2326 "http://www.example.com/start.html"
"Mozilla/4.08 [en] (Win98; I ;Nav)"
In this study, we focus on HTTP requests analysis.
Such requests can contain some parameters changing
which creates a possibility to include malicious at-
tacks. We do not focus on static requests which do
not contain any parameters because it is not possible
to inject code via static requests unless there are ma-
jor deficiencies in the HTTP server itself. Dynamic
requests, which are handled by the Web-applications
of the service, are more interesting in this study. Let
us assume that most requests, which are coming to the
HTTP server, are normal, i.e. use legitimate features
of the service, but some obtained requests are intru-
sions.
All dynamic HTTP requests are analyzed to de-
tect anomalous ones. The input to the detection pro-
cess consists of an ordered set of HTTP requests. A
request can be expressed as the composition of the
path to the desired resource and a query string which
is used to pass parameters to the referenced resource
and identified by a leading ’?’ character.
To extract features from each request n-gram
model is applied. N-gram models are widely used in
statistical natural language processing (Suen, 1979)
WEBIST2012-8thInternationalConferenceonWebInformationSystemsandTechnologies
634

and speech recognition (Hirsimaki et al., 2009). A n-
gram is a sub-sequence of n overlapping items (char-
acters, letters, words, etc) from a given sequence.
For example, 2-gram character model for the string
’/resource?parameter1=value1¶meter2=value2’
is ’/r’, ’re’, ’es’, ’so’, ’ou’, ’ur’, ..., ’lu’, ’ue’, ’e2’.
N-gram character model is applied to transform
each HTTP request to the sequence of n-characters.
Such sequences are used to construct a n-gram fre-
quency vector, which expresses the frequency of ev-
ery n-characters in the analyzed request. To obtain
this vector, ASCII codes of characters are used to
represent sequence of n-characters as sequence of ar-
rays each of which contains n decimal ascii codes,
and the frequency vector is built by counting the
number of occurences of each such array in the an-
alyzed request. The length of the frequency vec-
tor is 256
n
, because every byte can be represented
by an ASCII value between 0 and 255. For ex-
ample, in the previous example the following se-
quence of decimal ASCII pairs can be obtained:
[47, 114], [114, 101], [101, 115], [115, 111], [111, 117],
[117, 114], . .., [108, 117], [117, 101], [101, 50]. The
corresponding 256
2
vector is built by counting the
number of occurences of each of such pair. For ex-
ample, the entry in location (256× 61+ 118) in this
vector contains the value equal to 2 since the pair
[61, 118], which corresponds pair ’=v’, can be seen
twice. Thus, each request is transformed to 256
n
nu-
meric vector. The matrix consisting of these vectors
is called feature matrix and it can be analyzed to find
anomalies.
3 BACKGROUND ON SOM AND
GHSOM
In this study, adaptive growing hierarchical self-
organizing maps are used to find anomalies in feature
matrix. Traditional SOM model and growing hierar-
chical SOM model are briefly described in this sec-
tion.
3.1 Self-organizing Maps
The self-organizing map is an unsupervised, competi-
tive learning algorithm that reduces the dimensions of
data by mapping these data onto a set of units set up in
much lower dimensionalspace. This algorithm allows
not only to compress high dimensional data, but also
to create a network that stores information in such a
way that any topological relationships within the data
set are maintained. Due to this fact SOMs are widely
applied for visualizing the low-dimensional views of
high-dimensional data.
SOM is formed form a regular grid of neurones
each of which is fully connected to the input layer.
The neurons are connected to adjacent neurons by a
neighborhood relation dictating the structure of the
map. The i-th neuron of the SOM has an associ-
ated with it d-dimensional prototype (weight) vector
w
i
= [w
i1
, w
i2
, . . . , w
id
], where d is equal to the dimen-
sion of the input vectors. Each neuron has two posi-
tions: one in the input space (the prototype vector)
and another in the output space (on the map grid).
Thus, SOM is a vector projection method defining a
nonlinear projection from the input space to a lower-
dimensional output space. On the other hand, during
the training the prototype vectors move so that they
follow the probability density of the input data.
SOMs learn to classify data without supervision.
At the beginning of learning the number of neurons,
dimensions of the map grid, map lattice and shape
should be determined. Before the training, initial val-
ues are given to the prototype vectors. The SOM is
very robust with respect to the initialization, but prop-
erly accomplished initialization allows the algorithm
to converge faster to a good solution. At each train-
ing step t, one sample vector x(t) from the input data
set is chosen randomly and a similarity measure (dis-
tance) is calculated between it and all the weight vec-
tors w
i
(t) of the map. The unit having the shortest
distance to the input vector is identified to be the best
matching unit (BMU) for input x(t). The index c(t)
of this best matching unit is identified. Next, the in-
put is mapped to the location of the best matching unit
and the prototype vectors of the SOM are updated so
that the vector of the BMU and its topological neigh-
bors are moved closer to the input vector in the input
space:
w
i
(t + 1) = w
i
(t) + δ(t)N
i,c(t)
(r(t))(x(t) − w
i
(t)),
(1)
where δ(t) is the learning rate function and
N
i,c(t)
(r(t)) is the neighborhood kernel around the
winner unit, which depends on neighborhood radius
r(t) and the distance between BMU having index c(t)
and i-th neuron.
The most important feature of the Kohonen learn-
ing algorithm is that the area of the neighborhood
shrinks over time. In addition, the effect of learning is
proportional to the distance a node is from the BMU.
As a rule, the amount of learning is fading over dis-
tance and at the edges of the BMUs neighborhood,the
learning process does not have barely any effect.
The SOM have shown to be successful for the
analysis of high-dimensional data on data mining ap-
plications such as network security. However, the ef-
GROWINGHIERARCHICALSELF-ORGANISINGMAPSFORONLINEANOMALYDETECTIONBYUSING
NETWORKLOGS
635

fectiveness of using traditional SOM models is lim-
ited by the static nature of the model architecture. The
size and dimensionality of the SOM model is fixed
prior to the training process and there is no systematic
method for identifying an optimal configuration. An-
other disadvantage of the fixed grid in SOM, is that
traditional SOM can not represent hierarchical rela-
tion that might be present in the data.
3.2 Growing Hierarchical
Self-organizing Maps
The limitations mentioned above can be resolved by
applying growing hierarchical self-organizing maps.
GHSOM has been developed as a multi-layered hi-
erarchical architecture which adapts its structure ac-
cording to the input data. It is initialized with one
SOM and grows in size until it achieves an improve-
ment in the quality of representing data. In addition,
each node in this map can dynamically be expanded
down the hierarchy by adding a new map at a lower
layer providing a further detailed representation of
data. The procedure of growth can be repeated in
these new maps. Thus, the GHSOM architecture is
adaptive and can represent data clearly by allocating
extra space as well as uncover the hierarchical struc-
ture in the data.
The GHSOM architecture starts with the main
node at zero layer and a 2× 2 map at the first layer
trained according to SOM training algorithm. The
main node represents the complete data set X and
its weight vector w
0
is calculated as mean value of
all data inputs. This node controls the growth of the
SOM at the first layer and the hierarchical growth of
whole GHSOM. The growth of the map at the first
layer and maps at the next layers is controlled by us-
ing the quantization error. This error for the i-th node
is calculated as follows
e
i
=
∑
x
j
∈C
i
w
i
− x
j
, (2)
where C
i
is the set of input vectors x
j
projected to the
i-th node and w
i
is the weight vector of the i-th node.
The quantization error E
m
of map m is defined as
E
m
=
1
|U
m
|
∑
i∈U
m
e
i
, (3)
where U
m
is the subset of the m-th map nodes onto
which data is mapped, and |U
m
| is the number of these
nodes of m-th map.
When E
m
reaches certain fraction α
1
of the e
u
of
the corresponding parent unit u in the upper layer, the
growing process is stopped. The parent node of the
SOM at the first layer is the main node. The parameter
α
1
controls the breadth of maps and its value ranges
from 0 to 1. After that, the most dissimilar neighbor-
ing node s is selected according to
s = max
j
(
w
e
− w
j
), for w
j
∈ N
e
, (4)
where w
j
is the weight vector of the error node, N
e
is
the set of neighboring nodes of e-th node, and w
i
is
weight vector of neighboring node in set N
e
. A new
row or column of nodes is placed in between nodes
e and s. The weight vectors of newly added nodes
are initialized with the mean of their corresponding
neighbors.
After the growth process of an SOM is completed,
every node of this SOM has to be checked for fulfill-
ment of the global stopping criterium (Rauber et al.,
2002):
e
i
< α
2
e
0
, (5)
where α
2
∈ (0, 1) is parameter which controls the hi-
erarchical growth of GHSOM, and e
0
is the quanti-
zation error of the main node, which can be found as
follows:
e
0
=
∑
x
j
∈X
w
0
− x
j
. (6)
Nodes not satisfying this criterium (5) and therefore
representing a set of too diverse input vectors, are ex-
panded to form a new map at a subsequent layer of
the hierarchy. Similar to the creation of the first layer
SOM, a new map of initially 2 × 2 nodes is created.
This maps weight vectors are initialized so that to mir-
ror the orientation of neighboring the units of its par-
ent. For this reason, we can choose to set new four
nodes to the means of the parent and its neighbors in
the respective directions (Chan and Pampalk, 2002).
The newly added map is trained by using the input
vectors which are mapped onto the node which has
just been expanded, i.e., the subset of the data space
mapped onto its parent. This new map will again con-
tinue to grow and the whole process is repeated for
the subsequent layers until the global stopping crite-
rion given in (5) is met by all nodes. Thus, an ideal
topology of a GHSOM is formed unsupervised based
on the input data as well as hierarchal relationships in
the data are discovered.
4 METHOD
The anomaly detection algorithm which is proposed
in this study is based on the usage of GHSOM. The
algorithm consists of three main stages: training, de-
tecting and updating.
WEBIST2012-8thInternationalConferenceonWebInformationSystemsandTechnologies
636

4.1 Training
In the training phase, server logs are used to obtain
training set. The logs can contain several thousands
of HTTP requests which are gathered from different
web-resources during several days or weeks. In addi-
tion, these logs can include unknown anomalies and
real attacks. The only condition is that the quantity of
normal requests in the logs used must be significantly
greater than number of real intrusions and anomalous
requests. HTTP requests from these logs are trans-
formed to feature matrix by applying n-gram model.
When the feature matrix is obtained, new GH-
SOM is constructed and trained based on this ma-
trix. The zero layer of this GHSOM is formed by
several independent nodes the number of which cor-
responds to the number of different resources of the
web-server. For each such node a SOM is created
and initialized with four nodes. Requests to one web-
resource are mapped to the correspondingparent node
on the zero layer and used for training corresponding
SOM. These SOMs form the first layer and each of
these maps can grow in size by adding new rows and
columns or by adding a new map of four nodes at a
lower layer providing a further detailed representation
of data as it is explained in Section 3. For each parent
node on the zero layer the quantization error is calcu-
lated which controls the growing process of maps on
the first layer and hierarchical growth of the GHSOM
constructed.
4.2 Detection Method
The aim is not to find intrusions in the logs which
were used as the training set, but to detect attacks
among new requests received by the web-server. The
new request is transformed to the frequency vector by
applying n-gram model. After that, it goes to one of
the parent node according to its resource and mapped
to one of the nodes on the corresponding map by cal-
culating the best matching unit for this request. To
determine whether the new request is attack or not,
two following criteria are used:
• If the distance between new request and its BMU
weight vector is greater than threshold value then
this request is intrusion, otherwise it is classified
as normal;
• If the node which is the BMU for the new request
is classified as ”anomalous” node, then this re-
quest is intrusion, otherwise it is classified as nor-
mal.
The threshold for the first criterium is calculated
based on the distances between the weight vector of
the node which is the BMU for the new request and
other requests from the server logs already mapped to
this node at the training stage. Assume that new re-
quest is mapped to the node which already contains
l other requests which are mapped to this node dur-
ing the training phase. Denote the distances between
the node and these l requests as e
1
, e
2
, . . . , e
l
. Let us
assume that values of these distances are distributed
more or less uniformly. In this case, we can estimate
maximum τ of continuous uniformly distributed vari-
able as follows (Johnson, 1994):
τ =
l + 1
l
max
l
{e
1
, e
2
, . . . , e
l
}. (7)
Obtained value τ can be used as the threshold value
for the node considered, and new request is classified
as an intrusion if distance between this request and
the node is greater than τ.
To find ”anomalous” nodes the U
∗
-matrix
(Ultschk, 2005) is calculated for each SOM. U
∗
-
matrix presents a combined visualization of the dis-
tance relationships and density structures of a high di-
mensional data space. This matrix has the same size
as the grid of the corresponding SOM and can be cal-
culated based on U-matrix and P-matrix.
U-matrix represents distance relationships of re-
quests mapped to a SOM (Ultsch and Siemon, 1990).
The value of i-th element of U-matrix is the average
distance of i-th node weight vector w
i
to the weight
vectors of its immediate neighbors. Thus, i-th ele-
ment of U-matrix U(i) is calculated as follows:
U(i) =
1
n
i
∑
j∈N
i
D(w
i
, w
j
), (8)
where n
i
= |N
i
| is the number of nodes in the neigh-
borhood N
i
of the i-th node, and D is a distance func-
tion which for example can be Euclidean distance. A
single element of U-matrix shows the local distance
structure. If a global view of a U-matrix is considered
then the overall structure of densities can be analyzed.
P-matrix allows a visualization of density struc-
tures of the high dimensional data space (Ultsch,
2003a). The i-th element of P-matrix is a measure of
the density of data points in the vicinity of the weight
vector of the i-th node:
P(i) = |{x ∈ X|D(x, w
i
) < r}|, (9)
where X is the set of requests mapped to the SOM
considered and radius r is some positive real number.
A display of all P-matrix elements on top of the SOM
grid is called a P-matrix. In fact, the value of P(i)
is the number of data points within a hypersphere of
radius r. The radius r should be chosen such that P(i)
approximates the probability density function of the
GROWINGHIERARCHICALSELF-ORGANISINGMAPSFORONLINEANOMALYDETECTIONBYUSING
NETWORKLOGS
637

data points. This radius can be found as the Pareto
radius (Ultsch, 2003b):
r =
1
2
χ
2
d
(p
u
), (10)
where χ
2
d
is the Chi-square cumulative distribution
function for d degrees of freedom and p
u
= 20.13%
of requests number containing in the data set X. The
only condition is that all points in X must follow a
multivariate mutual independent Gaussian standard
normal density distribution (MMI). It can be enforced
by different preprocessing methods such as principal
component analysis, standardization and other trans-
formations.
The U
∗
-matrix which is combination of a U-
matrix and a P-matrix presents a combination of dis-
tance relationships and density relationships and can
give an appropriate clustering. The i-th element of
U
∗
-matrix is equal to the U(i) multiplied with the
probability that the local density, which is measured
by P(i), is low. Thus U
∗
(i) can be calculated as fol-
lows:
U
∗
(i) = U(i)
|p ∈ P|p > P(i)|
|p ∈ P|
, (11)
i.e. if the local data density is low U
∗
(i) ≈ U(i) (this
happens at the presumed border of clusters) and if the
data density is high, then U
∗
(i) ≈ 0 (this is in the cen-
tral regions of clusters). We can also adjust the multi-
plication factor such that U
∗
(i) = 0 for the p
high
per-
cent of P-matrix elements which have greatest values.
Since we assumed that most of requests are nor-
mal, intrusions can not form big clusters but will
be mapped to nodes which are located on cluster
borders. Thus, ”anomalous” nodes are those ones
which correspond to high values of U
∗
-matrix ele-
ments. In this research, the following criterium for
finding anomalous nodes is used: if difference be-
tween the U
∗
(i) and U
∗
average
(i) (average value of all
elements of U
∗
-matrix) is greater than difference be-
tween the U
∗
average
(i) and minimal value ofU
∗
-matrix,
then the i-th neuron is classified as ”anomalous”, oth-
erwise this neuron is classified as ”normal”. If a node
of GHSOM is classified as ”normal” but has child
SOM, then all nodes of this child SOM should be also
checked whether they are ”normal” or ”anomalous”
by calculating new U
∗
-matrix for this SOM.
4.3 Updating
Web-applications are highly dynamic and change on
regular basis, which can cause noticeable changes in
the HTTP requests which are sent to the web-server.
It can lead to the situation when all new allowable re-
quests will be classified as intrusions. For this reason,
the GHSOM should be retrained after a certain period
of time T to be capable of classifing new requests.
Let us assume that the number of requests sent
to the web-server for this period T is much less than
number of requests in the training set. We update the
training set by replacing first requests from this set by
requests obtained during the period T. After that, the
GHSOM is retrained by using the resulting training
set. During the update phase the structure of the GH-
SOM can be modified. The update of the GHSOM
structure starts from the current structure. Parameters
τ and matrices U, P and U
∗
should be recalculated.
The update phase can occur independently from the
detecting anomalies. During retraining, requests ob-
tained are classified using old GHSOM, and when the
GHSOM retraining is completed the classification of
new requests continues with the updated GHSOM.
Countermeasures are necessary against attackers
who try to affect the training set by flooding the web-
server with a large number of intrusions. It can be
enforced for example by allowing a client (one IP ad-
dress) to replace a configurable number of HTTP re-
quests in the training set per time slot. It is also pos-
sible to restrict the globally allowed replacements per
time slot independent of the IP addresses, in order to
address the threat of botnets.
5 SIMULATION RESULTS
The proposed method is tested using logs acquired
from a large real-life web-service. These logs contain
mostly normal traffic, but they also include anomalies
and actual intrusions. The logfiles are acquired from
several Apache servers and stored in combined log
format. The logs contain requests from multiple web-
resources. Since it is not possible to inject code via
static requests unless there are major deficiencies in
the HTTP server, we focus on finding anomalies from
dynamic requests because these requests are used by
the web-applications, which are run behind the HTTP
server. Thus, the requests without parameters are ig-
nored.
We run two simulations. In the first simulation,
requests to the most popular web-resourse are chosen
from the logs. In the second simulation, thirty-eight
most popular resources are analyzed. In both cases,
the training set is created at the beginning. It contains
10 000 and 25 000 requests in the first and second
tests respectively. After GHSOMs are trained, new re-
quests are chosen from logfiles and classified by GH-
SOMs one by one to test the technique proposed. The
number of testing requests is equal 20 000 and 50 000
for the first and second simulations respectively. Dur-
WEBIST2012-8thInternationalConferenceonWebInformationSystemsandTechnologies
638
ing the testing, the GHSOMs are updated every 2 000
and 5 000 requests in the first and second cases re-
spectively.
To evaluate the performance of proposed tech-
nique, the following characteristics are calculated in
both tests:
• True positive rate, ratio of the number of correctly
detected intrusions to the total number of intru-
sions in the training set;
• False positive rate, ratio of the number of normal
requests classified as intrusions to the total num-
ber of normal requests in the training set;
• True negative rate, ratio of the numberof correctly
detected normal requests to the total number of
normal requests in the training set;
• False negative rate, ratio of the number of in-
trusions classified as normal requests to the total
number of intrusions in the training set;
• Accuracy, ratio of the total number of correctly
detected requests to the total number of requests
in the training set;
• Precision, ratio of the number of correctly de-
tected intrusions to the number of requests clas-
sified as intrusions.
In the first test, the requests in training and testing sets
are related to one web-resource. This resource allows
users to search a project by choosing the appropri-
ate category of the projects or initial symbols of the
project name. Thus, all requests have one of the two
different attributes which can be used by attackers to
inject malignant code. Settings of the first simulation
are presented in Table 1. When the GHSOM training
Table 1: The first simulation settings.
Number
of web-
resources
Training
set size
Testing set
size
Update
period
1 10 000 20 000 2 000
is completed, U-matrix, P-matrix and U
∗
-matrix are
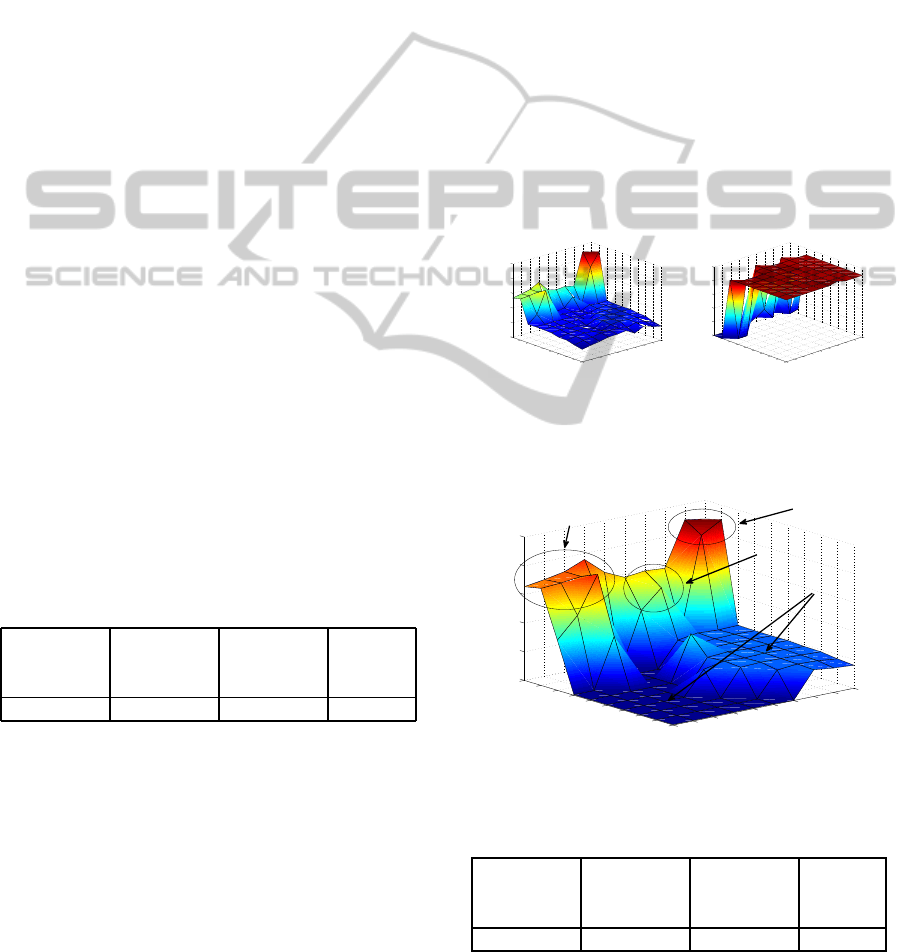
constructed. In Figure 1, U-matrix and P-matrix are
shown. As one can see, some nodes on one of the map
edges are distant from all others (Figure 1 (a)), and at
the same time density of data inputs in these nodes is
very low (Figure 1 (b)). These facts make these nodes
candidates to ”anomalous” ones. U
∗
-matrix is plot-
ted in Figure 2. We can notice that there are two big
clusters corresponding to the requests in which differ-
ent methods of searching required project are used:
by specifying the project category or initial symbols
of project name. Nodes on one of the map edges are
classified as ”anomalous”. The technique proposed
can not allow us to define intrusion types, but we can
check manually the nodes which have been classified
as ”anomalous” and make sure that requests mapped
to those nodes are real intrusions: SQL injections,
buffer overflow attacks and directory traversal attacks,
as shown in Figure 2.
After constructingU
∗
-matrix, detection process is
started. New requests are mapped to the GHSOM
one by one and classified as intrusions if the distance
between new request and its BMU weight vector is
greater than threshold value or if the node which is the
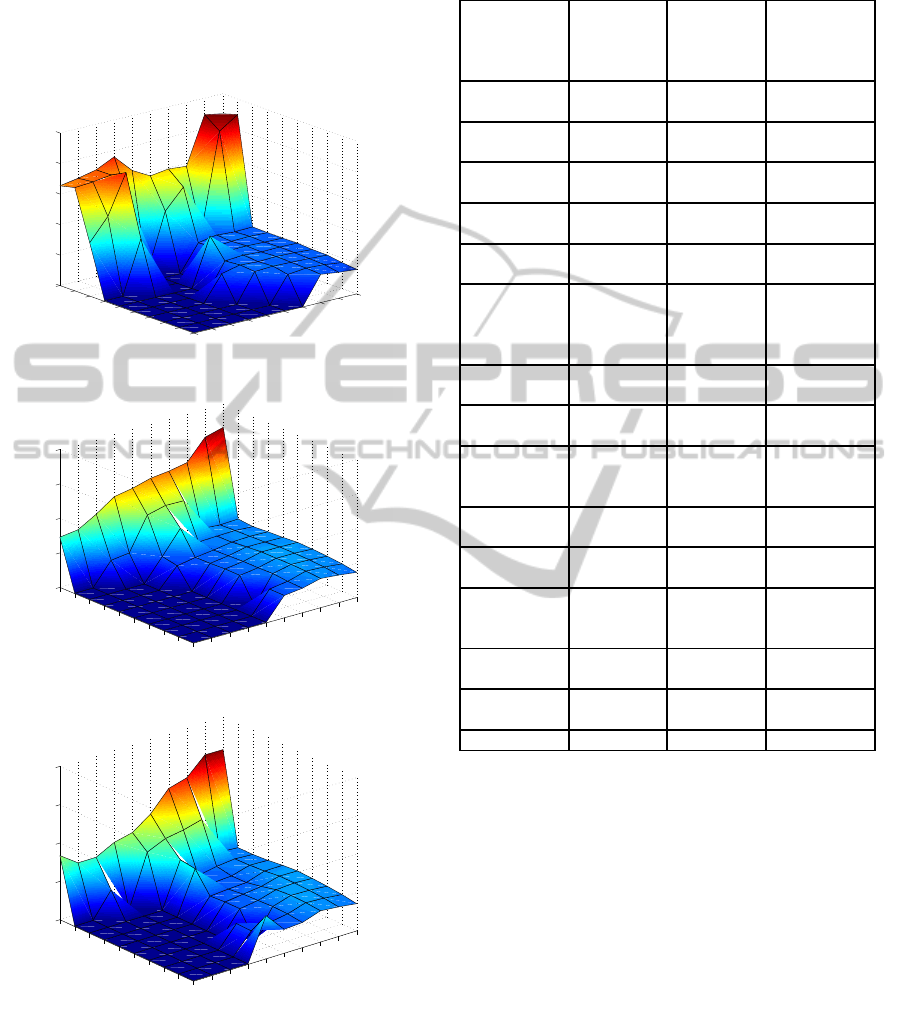
BMU for this new request is anomalous. During the
detection phase, the GHSOM is retrained periodically
when a certain number of requests are processed. Af-
ter the GHSOM update, threshold values for all nodes
are modified and U
∗
-matrix is also recalculated. Fig-
ure 3 shows the U
∗
matrix after the training phase and
the first and fifth updates. Requests which are used
1
2
3
4
5
6
7
8
9
10
1
2
3
4
5
6
7
8
9
10
0.05
0.1
0.15
0.2
0.25
0.3
(a) U-matrix.
1
2
3
4
5
6
7
8
9
10
1
2
3
4
5
6
7
8
9
10
0
1000
2000
3000
4000
5000
(b) P-matrix.
Figure 1: U-matrix and P-matrix after the training stage in
the first simulation.
1
2
3
4
5
6
7
8
9
10
1
2
3
4
5
6
7
8
9
10
0
0.05
0.1
0.15
0.2
0.25
Buffer overflow attacks
SQL injection attacks
Normal requests
Directory traversal attacks
Figure 2: U
∗
-matrix for detecting anomalies after the train-
ing stage in the first simulation.
Table 2: The second simulation settings.
Number
of web-
resources
Training
set size
Testing set
size
Update
period
38 20 000 50 000 5 000
as the testing set in our first simulation, contain also
other types of intrusions except those ones which are
GROWINGHIERARCHICALSELF-ORGANISINGMAPSFORONLINEANOMALYDETECTIONBYUSING
NETWORKLOGS
639

Table 3: The first simulation results.
True positive rate Flase positive
rate
True negative
rate
False negative
rate
Accuracy Precision
100 % 0 % 100 % 0 % 100 % 100 %
Table 4: The second simulation results for different web-resources.
Resource
number
True positive
rate
Flase positive
rate
True negative
rate
False negative
rate
Accuracy Precision
1 100 % 0 % 100 % 0 % 100 % 100 %
2 100 % 0 % 100 % 0 % 100 % 100 %
3 98.08 % 0 % 100 % 1.92 % 99.90 % 100 %
4 100 % 0 % 100 % 0 % 100 % 100 %
5 100 % 0 % 100 % 0 % 100 % 100 %
6 100 % 0 % 100 % 0 % 100 % 100 %
7 100 % 0 % 100 % 0 % 100 % 100 %
8 100 % 0 % 100 % 0 % 100 % 100 %
9 100 % 0 % 100 % 0 % 100 % 100 %
10 100 % 0 % 100 % 0 % 100 % 100 %
11 100 % 0 % 100 % 0 % 100 % 100 %
12 100 % 0 % 100 % 0 % 100 % 100 %
13 100 % 0 % 100 % 0 % 100 % 100 %
14 100 % 0 % 100 % 0 % 100 % 100 %
15 100 % 0 % 100 % 0 % 100 % 100 %
16 100 % 0 % 100 % 0 % 100 % 100 %
17 100 % 0 % 100 % 0 % 100 % 100 %
18 100 % 0 % 100 % 0 % 100 % 100 %
19 100 % 0 % 100 % 0 % 100 % 100 %
20 100 % 0 % 100 % 0 % 100 % 100 %
21 95.65 % 0 % 100 % 4.35 % 99.74 % 100 %
22 100 % 0 % 100 % 0 % 100 % 100 %
23 98.57 % 0 % 100 % 1.43 % 99.93 % 100 %
24 100 % 0 % 100 % 0 % 100 % 100 %
25 100 % 0 % 100 % 0 % 100 % 100 %
26 100 % 0 % 100 % 0 % 100 % 100 %
27 100 % 0.10 % 99.90 % 0 % 99.90 % 98.00 %
28 100 % 0.07 % 99.93 % 0 % 99.93 % 98.63 %
29 100 % 0 % 100 % 0 % 100 % 100 %
30 100 % 0.20 % 99.80 % 0 % 99.81 % 95.35 %
31 97.50 % 0 % 100 % 2.50 % 99.87 % 100 %
32 100 % 0 % 100 % 0 % 100 % 100 %
33 100 % 0 % 100 % 0 % 100 % 100 %
34 100 % 0 % 100 % 0 % 100 % 100 %
35 98.51 % 0 % 100 % 1.49 % 99.93 % 100 %
36 100 % 0 % 100 % 0 % 100 % 100 %
37 100 % 0 % 100 % 0 % 100 % 100 %
38 100 % 0 % 100 % 0 % 100 % 100 %
Average 99.69 % 0.01 % 99.99 % 0.31 % 99.97 % 99.79 %
contained in the training set. However, all intrusions
are detected and false alarms are absent. The sum-
mary of the first simulation results is presented in Ta-
ble 3.
In the second simulation, thirty eight most popu-
lar web-resources are chosen from web-server logs.
Since the logs contain a few different types of intru-
sions, we generate other types of intrusions and add
them to the testing set. The basic settings of the sec-
ond simulation are presented in Table 2.
Results of the detection phase are shown in Table
4. As one can see, almost all real attacks are clas-
sified correctly as intrusions by using proposed tech-
nique. At the same time, false positive rate is about
0.01% on average which means that the number of
false alarms is very low. The accuracy of the method
is close to one hundred percent.
In the second simulation, the training set contains
WEBIST2012-8thInternationalConferenceonWebInformationSystemsandTechnologies
640
fourteen differenttypes of attack. The results for these
attack types are presented in Table 5. We can see that
our algorithm found 99.63% of all attacks. Thus, all-
most all intrusions are detected despite the fact that
some of them are not contained in the training set.
1
2
3
4
5
6
7
8
9
10
1
2
3
4
5
6
7
8
9
10
0
0.05
0.1
0.15
0.2
0.25
(a) After training phase.
1
2
3
4
5
6
7
8
9
10
1
2
3
4
5
6
7
8
9
10
0
0.05
0.1
0.15
0.2
(b) After the first update.
1
2
3
4
5
6
7
8
9
10
1
2
3
4
5
6
7
8
9
10
0
0.05
0.1
0.15
0.2
(c) After the fifth update.
Figure 3: U
∗
-matrix in the first simulation.
Table 5: The second simulation results for different types of
attacks.
Attack type Total
number of
attacks
Number
of de-
tected
attacks
Proportion
of detected
attacks
SQL injec-
tion
229 229 100 %
Directory
traversal
276 276 100 %
Buffer
overflow
243 243 100 %
Cross-site
scripting
230 230 100 %
Double en-
coding
239 239 100 %
Common
gateway
interface
scripting
189 182 96.30 %
Shell
scripting
44 43 97.73 %
XPath
injection
251 251 100 %
HTTP
response
splitting
253 253 100 %
Cache poi-
soning
44 44 100 %
Eval injec-
tion
186 186 100 %
Web-
parameter
tampering
81 80 98.77 %
String for-
matting
79 79 100 %
Cross-User
defacement
67 67 100 %
Total 2411 2402 99.63 %
6 CONCLUSIONS AND
DISCUSSION
The main advantage of anomaly detection based
IDSs is that they are able to detect zero-day attacks.
In this research, adaptive growing hierarchical self-
organizing maps are used to find anomalies in HTTP
requests which are sent to the server. The technique
proposed is self-adaptive and allows to detect HTTP
attacks in online mode in the case of continuously
updated web-applications. The method is tested us-
ing logs acquired from a large real-life web-service.
These logs include normal and intrusive requests. As
a result, almost all attacks from these logs are detected
and at the same time the number of false alarms is
very low. Thus, the accuracy of the method proposed
GROWINGHIERARCHICALSELF-ORGANISINGMAPSFORONLINEANOMALYDETECTIONBYUSING
NETWORKLOGS
641

is about one hundred percent. However, this method
can be applied only if the number of HTTP requests
to a web-resource is enough to analyze the normal be-
haviour of users. Sometimes, attackers try to access
the data stored on servers or to harm the system by us-
ing holes in the security of not popular web-resources
for which it is difficult to define which requests are
”normal”. In the future, we are planning to develop
anomaly detection based system which can solve this
problem.
REFERENCES
Apache 2.0 Documentation (2011).
http://www.apache.org/.
Axelsson, S. (1998). Automatically hardening web applica-
tions using precise tainting. Technical report, Depart-
ment of Computer Engineering, Chalmers University
of Technology, Goteborg, Sweden.
Chan, A. and Pampalk, E. (2002). Growing hierarchical self
organising map (ghsom) toolbox: visualisations and
enhancements. In 9-th International Conference Neu-
ral Information Processing, ICONIP ’02, volume 5,
pages 2537–2541.
Gollmann, D. (2006). Computer Security. Wiley, 2nd edi-
tion.
Hirsimaki, T., Pylkkonen, J., and Kurimo, M. (2009). Im-
portance of high-order n-gram models in morph-based
speech recognition. Audio, Speech, and Language
Processing, IEEE Transactions, 17:724–732.
Ippoliti, D. and Xiaobo, Z. (2010). An adaptive growing
hierarchical self organizing map for network intru-
sion detection. In 19th IEEE International Conference
Computer Communications and Networks (ICCCN),
pages 1–7.
Jiang, D., Yang, Y., and Xia, M. (2009). Research on intru-
sion detection based on an improved som neural net-
work. In Fifth International Conference on Informa-
tion Assurance and Security, pages 400–403.
Johnson, R. W. (1994). Estimating the size of a population.
Teaching Statistics, 16:50–52.
Kayacik, H. G., Nur, Z.-H., and Heywood, M. I. (2007).
A hierarchical som-based intrusion detection system.
Engineering Applications of Artificial Intelligence,
20:439–451.
Kemmerer, R. and Vigna, G. (2002). Intrusion detection: A
brief history and overview. Computer, 35:27–30.
Kohonen, T. (1982). Self-organized formation of topolog-
ically correct feature maps. Biological cybernetics,
43:59–69.
Kohonen, T. (2001). Self-organizing map. Springer-Verlag,
Berlin, 2rd edition.
Mukkamala, S. and Sung, A. (2003). A comparative study
of techniques for intrusion detection. In Tools with
Artificial Intelligence, 15th IEEE International Con-
ference.
Nguyen-Tuong, A., Guarnieri, S., Greene, D., Shirley, J.,
and Evans, D. (2005). Automatically hardening web
applications using precise tainting. In 20th IFIP Inter-
national Information Security Conference.
Palomo, E. J., Dom´ınguez, E., Luque, R. M., and Mu˜noz,
J. (2008). A New GHSOM Model Applied to Network
Security, volume 5163 of Lecture Notes in Computer
Science. Springer, Berlin, Germany.
Patcha, A. and Park, J. (2007). An overview of anomaly de-
tection techniques: Existing solutions and latest tech-
nological trends. Computer Networks: The Interna-
tional Journal of Computer and Telecommunications
Networking, 51.
Rauber, A., Merkl, D., and Dittenbach, M. (2002).
The growing hierarchical self-organizing map: ex-
ploratory analysis of high-dimensional data. Neural
Networks, IEEE Transactions, 13:1331–1341.
Shehab, M., Mansour, N., and Faour, A. (2008). Growing
hierarchical self-organizing map for filtering intrusion
detection alarms. In International Symposium Paral-
lel Architectures, Algorithms, and Networks, I-SPAN,
pages 167–172.
Suen, C. Y. (1979). n-gram statistics for natural language
understanding and text processing. Pattern Analysis
and Machine Intelligence, IEEE Transactions, PAMI-
1:162–172.
Ultsch, A. (2003a). Maps for the visualization of high-
dimensional data spaces. In Workshop on Self-
Organizing Maps (WSOM 2003),, pages 225–230.
Ultsch, A. (2003b). Pareto density estimation: A density
estimation for knowledge discovery. In Innovations
in Classification, Data Science, and Information Sys-
tems - Proc. 27th Annual Conference of the German
Classification Siciety, pages 91–100.
Ultsch, A. and Siemon, H. P. (1990). Kohonen’s self or-
ganizing feature maps for exploratory data analysis.
In Proc. Intern. Neural Networks, Kluwer Academic
Press, pages 305–308.
Ultschk, A. (2005). Clustering with som: U*c. In U*C.
Proc. Workshop on Self-Organizing Maps (WSOM
2005), pages 75–82.
Verwoerd, T. and Hunt, R. (2002). Intrusion detection tech-
niques and approaches. Computer Communications,
25:1356–1365.
WEBIST2012-8thInternationalConferenceonWebInformationSystemsandTechnologies
642
