
GIBBS-WEIGHTED K-MEANS SEGMENTATION APPROACH
WITH INTENSITY INHOMOGENEITY CORRECTION
Chia-Yen Lee
1
, Chiun-Sheng Huang
2
, Yeun-Chung Chang
3
, Yi-Hong Chou
4
and Chung-Ming Chen
1
1
Institute of Biomedical Engineering, National Taiwan University, Taipei, Taiwan
2
Department of Surgery, National Taiwan University Hospital, Taipei, Taiwan
3
Department of Medical Imaging, National Taiwan University Hospital, Taipei, Taiwan
4
Department of Radiology, Taipei Veterans General Hospital, Taipei, Taiwan
Keywords: Breast Sonogram, Intensity Inhomogeneity Correction, Segmentation, Fuzzy Cell Competition, Clustering.
Abstract: Intensity inhomogeneity caused by an ultrasonic attenuation beam within the body results in an artifact
effect. It frequently degrades the boundary and texture information of a lesion in a breast sonogram. A new
Gibbs-weighted K-means segmentation approach with intensity inhomogeneity correction is proposed to
cluster the prominent components provided by fuzzy cell competition algorithm for segmenting lesion
boundaries automatically with reducing the influence of the intensity inhomogeneity. The information of
fuzzy C-means, normalized cut, and cell-based fuzzy cell competition algorithm are combined as the feature
vector for cell-based clustering. 49 breast sonograms with intensity inhomogeneity, each from a different
subject, are randomly selected for performance analysis. The mean distance between the lesion boundaries
attained by the proposed algorithm and the corresponding manually delineated boundaries defined by two
radiologists is 1.571±0.513 pixels. (Assessing Chan and Vese level set method for intensity inhomogeneity-
correction segmentation in the same way, the mean distance error is3.299±1.203 pixels, for the 49 images.)
The results show that Gibbs-weighted K-means segmentation approach with intensity inhomogeneity
correction could not only correct the intensity inhomogeneity effect but also improve the segmentation
results.
1 INTRODUCTION
Boundary segmentation is an essential step for the
quantitative analysis of sonographic breast lesions.
The shape and contour of the lesion are important
indicators for the malignancy of breast lesions.
Varieties of approaches have been proposed for
segmentation of sonographic breast lesions. Despite
the satisfactory performances that have been
repeatedly reported, each class of algorithms suffer
certain types of fundamental deficiency and
boundary delineation of sonographic breast lesions
remains as a hard task in general. For example, for a
breast lesion with a complex texture pattern in the
vicinity of the lesion boundary, the deformation of
the deformable models (Chen, 2003) and level-set
methods (Chan, 2001) is easily blocked by the
textural structures or leaks out from the weak edges
(Chen, 2005).
A cell-based approach, Gibbs-weighted K-means
segmentation approach with intensity inhomogeneity
correction, is proposed instead of the conventional
pixel-based approaches. Based on cell-based concept,
one important part of proposed approach, fuzzy cell
competition algorithm, is applied to identify all
prominent components in an ROI simultaneously. A
prominent component is the substructure of a tissue
or a part of breast lesion with a visually perceivable
boundary. In general, each breast lesion is composed
of a very limited number of prominent components,
with which the lesion boundary can be easily
derived by a boundary delineation approach, e.g.,
cell-based clustering.
In that way, the Gibbs-weighted K-means
segmentation approach with intensity inhomogeneity
correction combines the information of each
prominent component computed by fuzzy c-means,
normalized cut, and
cell-based fuzzy cell
competition algorithm as the feature vector for cell-
based clutstering. However, intensity inhomogeneity,
which may be composed of acoustic shadow and
enhancement, is a common artifact in a breast
381
Lee C., Huang C., Chang Y., Chou Y. and Chen C..
GIBBS-WEIGHTED K-MEANS SEGMENTATION APPROACH WITH INTENSITY INHOMOGENEITY CORRECTION.
DOI: 10.5220/0003946803810384
In Proceedings of the International Conference on Computer Vision Theory and Applications (VISAPP-2012), pages 381-384
ISBN: 978-989-8565-03-7
Copyright
c
2012 SCITEPRESS (Science and Technology Publications, Lda.)

sonogram. Intensity inhomogeneity may also
degrade the boundary and texture information. The
typical example is the shadowing artifact may result
in weak edges or missing edges, aggravating the
difficulty of extracting the lesion boundaries for
further lesion characterization.
In a breast sonogram, an ultrasonic beam may
travel through several different tissues, such as fat,
muscle, mammary gland, lesion, and so on.
Moreover, the composition of tissue types along the
traversing path varies with ultrasonic beams. It
suggests that the attenuation effect is basically
spatially-variant, which is not only a function of
traveling distance but also a function of ultrasonic
beam. To reduce the influence of intensity
inhomogeneity in breast sonograms, polynomial
surface model (Lee, 2010) is applied to take into
account the spatially-variant nature of the
attenuation and minimize the probability of being
trapped in a local minimum.
2 MATERIALS AND METHODS
The ROI is assumed to be composed of the
foreground and background regions. Each region is
assumed to be a homogeneous area with a mean
intensity,
,
BF,
, where F and B denote the
foreground and background regions, respectively.
Let
i
g denote the observed gray level of the ith
pixel in the ROI. Then,
i
g may be expressed as
iii
ng
(1)
where
BF, depending on the location of the
ith pixel. The last two terms model the intensity
inhomogeneity and the noise. The noise is assumed
to be normally-distributed with zero mean. The
intensity inhomogeneity in an ROI is modeled as a
spatially-variant normal distribution with a constant
variance and spatially-variant means, which forms a
polynomial surface of order n denoted by
i
in Eq.
(1). The last term
i
n is the composition of the noise
and the variation on the polynomial surface of the
intensity inhomogeneity, which is also normally-
distributed.
The proposed segmentation with intensity
inhomogeneity correction scheme is formulated as
an EM algorithm composed of two major parts,
namely, Gibbs-weighted K-means segmentation
algorithm for the E-step as well as inhomogeneity
estimation and correction for the M-step. In the E-
step, the Gibbs-weighted K-means segmentation
algorithm divides the ROI into reasonable
foreground and background regions by the new
Gibbs-weighted K-means segmentation algorithm
taking the outputs of the fuzzy c-means, fuzzy cell-
competition algorithm and normalized cut algorithm
as the feature vectors. In the M-step, the nth order
polynomial surface of the inhomogeneity field is
estimated by using the least squared fitting. The
iteration process terminates when the difference of
the estimated fields derived in two consecutive
iterations is stabilized.
2.1 E Step
Based on the intensity inhomogeneity derived in the
previous M-step, the E-step aims to provide a
segmentation estimation of the foreground and
background regions close to the true partition as
possible for the M-step by the Gibbs-weighted K-
means segmentation algorithm. The proposed
algorithm comprises three components: fuzzy cell
competition (FCC), normalized cut (NC), fuzzy c
mens (FCM).
2.1.1 Fuzzy Cell Competition
The goal of the FCC algorithm is to derive a
minimum number of prominent components
constituting the breast lesion in a breast sonogram.
The FCC algorithm (Lee, 2010) is a cell-based
segmentation algorithm designed to find all
prominent components in an ROI, the boundaries of
which coincide with the visually perceived
boundaries.
The cost function of the FCC algorithm
characterizes the overall regional homogeneity of all
regions and the total boundary strength of all
boundary segments, which are defined by the first
and second terms, respectively, in Eq. (2) for the ith
iteration with
j
b
pH
j
logmax
0
:
i
k
j
ii
j
b
b
j
k
c
r
i
j
i
c
ii
pH
pH
r
n
E
0
)log(
)log(
)(
1
2
2
(2)
and
22
2
)()()()()(
i
j
i
hj
k
i
hj
i
hjk
h
q
hj
i
j
rcccfur
(3)
subject to
1
ii
j
r
hj
u
(4)
VISAPP 2012 - International Conference on Computer Vision Theory and Applications
382

where
i
: the set of regions in the ith iteration;
i
j
n : the number of pixels enclosed by
i
j
r ;
i
hj
c : the h
th
cell of
i
j
r in the ith iteration;
)(
i
hjk
cf : the gray level of the k
th
pixel enclosed by
i
hj
c ;
)(
i
hj
c
: the mean gray levels of the pixels
)(
i
j
r
: enclosed by
i
hj
c and
i
j
r , respectively;
n : the number of pixels within the ROI;
2
: the variance of the gray levels of the
pixels within the ROI;
hj
u
: the membership of cell j to region
i
j
r ;
0
: the set of boundary segments on the
boundaries identified by the second pass
of watershed transformation;
j
b : the j
th
boundary segment.
A boundary segment is a small portion of a regional
boundary uniquely shared by two elementary cells
residing within two different regions. The boundary
strength of a boundary segment, denoted by
j
p , is a
measure of the statistical significance of difference
between these two elemental cells. It is defined as
the minimum of the p-values of three two-tailed
Kolmogorov-Smirnov (KS) tests respectively
comparing the gray level distributions of pixels in
two elementary cells and those on the boundary
segment. The probability of
j
b being an edge is
defined as
)1(
j
p
. Moreover, the overall boundary
strength of the regional contour
C defined by a
fuzzy class labeling
is defined as the joint
probability of all boundary segments on
C being
edges, i.e.,
Cb
j
j
p )1( . The membership
function in each iteration may be derived as:
)1(
1
22
)1(
1
22
)()()()(
)()()()(
q
r
i
j
i
hj
k
i
hj
i
hjk
q
i
j
i
hj
k
i
hj
i
hjk
hj
ii
j
rcccf
rcccf
u
(5)
2.1.2 Gibbs-weighted K-means
Segmentation Algorithm
K-means aims to divide a dataset into several
groups. It needs feature vectors as inputs and a cost
function to define the quality of the partition result.
The Gibbs model is generally used to site labeling
problem to build the spatial dependency of each
neighboring site, i.e., pixel, edges, elements, and
region (Mohamed, 2004) via the set of clique
potentials. A Gibbs-weighted K-means is proposed
to provide a more general and flexible method to
make to 2D sonogram segmentation results better.
The basic idea is minimizing a cost function shown
as Eq. (6) which the sum of squares of the distances
of each cell to the two cluster center, i.e.,
background and foreground. For the pre-defined
cluster number K, the cost function is defined by
2
1
i
k
i
h
K
kCC
wG
CCGS
kh
(6)
where the Gibbs-weighted is as following
UzG
w
exp
1
(7)
and the energy function is a sum of clique potentials
hk
C
V over the set of all adjacent pairs of cells
.
h
C
C
lVU
hk
hk
(8)
The clique potential is with respect to its
neighboring cell to be defined as:
hkhC
lV
hk
1
(9)
where
kh
kh
hk
llif
llif
,1
,0
(10)
There are six parameters as the feature vector to be
inputs. The first two parameters are the mean gray-
level of each cell which obtained by fuzzy cell
competition, which are cell-based features. The third
and fourth parameters are the mean of membership
function of each cell. The membership functions of
each pixel is derived by fuzzy c means originally,
and then transfer to cell-based features, i.e., the
membership functions of each cell, via the cell
information obtained by the fuzzy cell competition
algorithm. The fifth and sixth parameters are the
mean of the second smallest eigenvalue of each cell
which derived by normalized cut algorithm via
combing the cell information.
2.2 M Step
The aim of this step is to fit the intensity
inhomogeneity field to a polynomial surface in a
bipartite ROI based on the model given in Eq. (1). It
is assumed that the mean of intensity inhomogeneity
GIBBS-WEIGHTED K-MEANS SEGMENTATION APPROACH WITH INTENSITY INHOMOGENEITY
CORRECTION
383
i
of pixel i, i , may be modeled as a polynomial
surface. To estimate the polynomial surface, a least
squared fitting is employed to minimize the cost
function:
i
ii
g
N
2
2
1
(11)
where
FR
if pixel i is in the foreground region
and
BR
if pixel i is in the background region.
Moreover,
),(
iii
yxf , where ),( yxf is a
polynomial function of order n. In this study, n is
set to 6.
3 RESULTS AND CONCLUSIONS
Forty-nine breast sonograms with intensity
inhomogeneity acquired from 1996 – 2004, each
from a different subject, were randomly selected
from the ultrasound image database in a teaching
hospital in Taiwan. The assessment is performed
based on the mean manually-delineated boundary of
each lesion in a breast sonogram. Each lesion was
demarcated by two graduate students and confirmed
by two experienced radiologists with 10- and 28-
year experience, respectively.
The mean distance between the lesion boundaries
attained by the proposed algorithm and the
corresponding manually delineated boundaries
defined by two radiologists is 1.571±0.513 pixels.
(Assessing Chan and Vese level set method for
intensity inhomogeneity-correction segmentation in
the same way, the mean distance error is
3.299±1.203 pixels, for the 49 images).
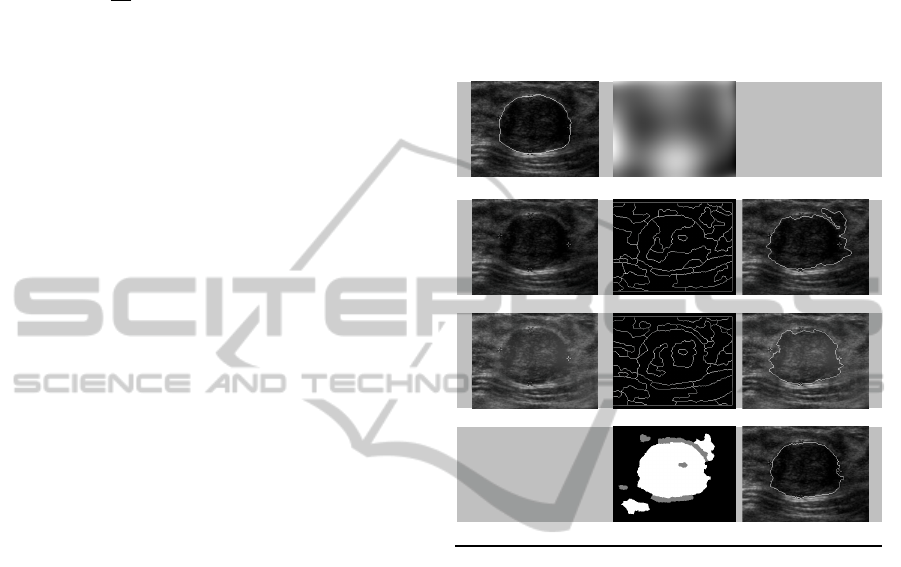
Figure 1 results of the proposed segmentation
approach and Chan and Vese level set method
applied on the intensity inhomogeneity image. Fig. 1
(a) shows the mean manually-delineated boundary
of the sonographic breast lesion given in Fig. 1 (c),
i.e., the original image.
Fig. 1(b) gives the intensity inhomogeneity field
and Fig. 1(f) shows the inhomogeneity-corrected
breast sonogram. The weak edge at the upper-right
portion of the lesion boundary becomes manifested
in the inhomogeneity-corrected breast sonogram.
The boundary derived by the Chan and Vese level
set method of the intensity inhomogeneity image and
intensity inhomogeneity-corrected image are shown
as Fig. 1 (e) and Fig. 1 (h), respectively. The Chan
and Vese level set method fails to capture the upper-
right portion of the lesion boundary which is a weak
edge caused by the intensity inhomogeneity. Fig. 1
(d) and Fig. 1 (g) show the cells (i.e., the prominent
components) derived by the FCC algorithm in the
intensity inhomogeneity image and intensity
inhomogeneity-corrected image, respectively. The
cell structures play the role of offering the feature
vectors to Gibbs-weighted K-means segmentation
algorithm, and the clustering result is shown as Fig.
1 (i). The boundary derived by Gibbs-weighted K-
means segmentation algorithm is shown as Fig. 1 (j).
(a) (b)
(c) (d) (e)
(f) (g) (h)
(i) (j)
Figure 1: The proposed algorithm segmentation results
compare with Chan and Vese level set method.
REFERENCES
Chan, T. F. and Vese, L. A., 2001. Active contours
without edges. IEEE Trans Image Processing 10(2).
Chen, C. M., Chou, Y. H. and Chen, C. S. K., 2005. Cell-
competition algorithm: a new segmentation algorithm
for multiple objects with irregular boundaries in
ultrasound images. Ultrasound in Medicine and
Biology 31(12).
Chen, D. R., Chang, R. F., Wu, W. J., Moon, M. K. and
Wu, W. L., 2003. 3-D breast ultrasound segmentation
using active contour model. Ultrasound in Medicine
and Biology 29(7).
Lee, C. Y., Chou, Y. H., Huang, C. S., Chang, Y. C., Tiu,
C. M., Chen, C. M., 2010. Intensity inhomogeneity
correction for the breast sonogram: Constrained fuzzy
cell-based bipartitioning and polynomial surface
modeling. Medical Physics 37(11).
Mohamed, R. M., El-Baz, A., and Farag A. A., 2004.
Image Modeling Using Gibbs-Markov Random Field
and Support Vector Machines Algorithm.
International Journal of Information Technology 1(14).
VISAPP 2012 - International Conference on Computer Vision Theory and Applications
384
