
AN EXPERIMENTAL COMMUNICATION ARCHITECTURE
FOR MONITORING AND CONTROL OF SUB-GRIDS
Zoya Pourmirza
and John Brooke
School of Computer Science, The University of Manchester, Oxford Street, M13 9PL, Manchester, U.K.
Keywords: Smart Grid, Real-time Data, Communication, Network Architecture, Wireless Sensor Network, Monitoring,
Energy Efficiency, Distributed Systems.
Abstract: The Smart Grid promises to provide better monitoring and control by incorporating the communication
network over the power network. We investigate the monitoring and control of distribution sub-Grids, for
example to a local area in a city. We propose a communication architecture to be deployed into a real local
area of the sub-Grid to provide a test bed for supporting real-time data and predictive real-time system
control. This is one of the main challenges of the Smart Grid. Our system design is aimed at investigating
two key issues: firstly, energy constraints in wireless sensor networks and secondly, achieving an
appropriate balance between central and distributed control of the sub-Grid. We propose an energy efficient
distributed architecture, for control and communication and explain how it will be implemented in our
experimental test bed. Also, TinyDB, which is a query processing system for sensor networks, has been
extended to collect the real-time data from the environment, and make them accessible by the local control
unit. Finally, a visualization tool has been developed to integrate the map view of the test bed, display the
real-time data, and send an alert to the network operator for finer-grained control over the system.
1 INTRODUCTION
The Smart Grid is considered as an integration of a
power network and a communication network. The
communication network, responsible for providing
communication between different sectors in a power
network by using digital technology, has three tiers
known as wide area network, neighbourhood area
network, and home area network. It is proposed
(Ericsson, 2010) that a communication system will
be a critical tool for the operation and administrative
purposes of the future power grid. In this paper we
describe a communication network architecture for a
neighbourhood area and describe how it is being
implemented in a test bed of sensors installed in the
6.6kV sub-Grid on a University Campus. Very little
is known about the monitoring and control on this
sub-Grid level, however as the local distribution
networks cease to be purely passive but can be
controlled at multiple levels, such a communications
architecture will be essential for efficient operation.
Our work is motivated by the study of other
networked systems such as the water distribution
grids (Khan et al., 2010, Machell et al., 2010,
Stoianov et al., 2007), which integrates sensing,
computation and decision making.
Our system design is targeted towards the
solution of two key problems. The first is the energy
constraint problem of general Wireless Sensor
Network (WSN), (Abbasi and Younis, 2007,
Raghunathan et al., 2004). The second problem
addresses the weaknesses of a centralized
architecture where the entire system data are stored
at a sub-Grid database, where controls are applied.
The paper is structured as follows: in Section 2
we explain the design of our architecture, in Section
3 we justify the choice of technologies used for
architecture implementation, in section 4 we
describe how we use simulation to explore different
possibilities for deployment. In Section 5 we
demonstrate the actual experimental test bed that
will be used to examine the performance of the
architecture. It Section 6 we summarise the current
status of our work and present future plans.
2 SUB-GRID COMMUNICATION
ARCHITECTURE
Given that the predictive real-time system control
67
Pourmirza Z. and Brooke J..
AN EXPERIMENTAL COMMUNICATION ARCHITECTURE FOR MONITORING AND CONTROL OF SUB-GRIDS.
DOI: 10.5220/0003948600670072
In Proceedings of the 1st International Conference on Smart Grids and Green IT Systems (SMARTGREENS-2012), pages 67-72
ISBN: 978-989-8565-09-9
Copyright
c
2012 SCITEPRESS (Science and Technology Publications, Lda.)
necessitates having real-time information, in this
architecture real-time data are collected, analysed,
converted to information and finally acted upon.
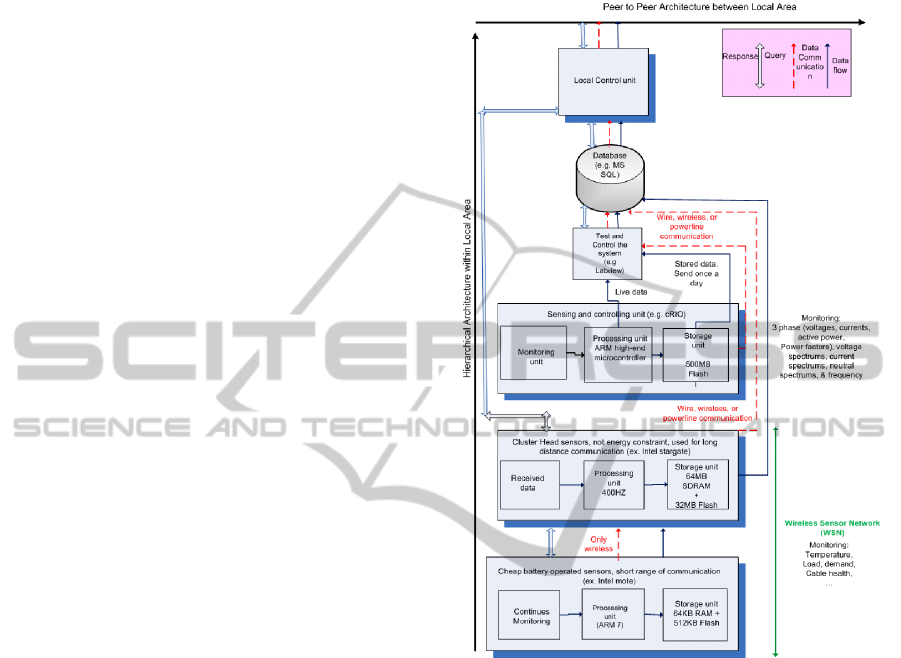
As shown in the figure below, we propose a
mixture of peer-to-peer (P2P) and hierarchical
architectures that integrates sensors and distributed
computation units in a unified communications
network. Notice that the Figure 1 shows only one
local area in the sub-Grid, while there exists a
number of local areas in the sub-Grid. This
architecture contains three layers of sensors for
measuring and collecting the data. Each layer of
sensors is selected according to the data type they
measure. The sensors in layer one and two are
located in the street levels, communicating
wirelessly. The sensing units in the layer three are
located at the substation level using both wireless
and wired communications. Next layer is the test and
control unit which apply some control over the
substation level. Then the database layer will store
the aggregated data received from the three sensing
layers and the test and control unit. In future we
need to figure out how much and for how long we
can store the data in a database, and how often we
need to refresh them. Finally the top level of the
architecture, showing the head of the local area, is
called the local control unit. It will apply some
control over the entire local area. The local control
unit can access the sensing units directly in
emergency situations or indirectly through the
database layer in normal scenarios for applying
some control and decision-making. Given that each
local area is likely to take the optimal decisions for
its region, which might not be the optimal solutions
for the entire system, another layer of
communication should be added over the local
control unit, in order to make each local area aware
of the state of the other local areas, and enable them
coordinate their control decisions. Thus a
publisher/subscriber system should be added on top
of this architecture that will provide asynchronous
and loosely coupled communication. Consequently,
while taking decisions, each local area not only
decides the optimal solution for its local context, but
also takes decisions that might be the optimal
solutions for the whole system.
The advantage of the proposed architecture over
the traditional one is that it is able to avoid single
point of failure, if one of the local areas goes down,
the rest can function as normal in the sub-Grid.
More importantly, energy efficiency could be
achieved through this architecture. Given that energy
for sending data is higher than energy for computing
data (Heinzelman et al., 2000), by reducing the
travelling distance and adding more computation to
the system, we may achieve an energy efficient
architecture.
Figure 1: The proposed architecture.
For this architecture a simulation should be
designed. It is supposed that initially data will be
taken from the university campus to feed the
simulation, and get the predictions of how the
system should behave. Next, the theory (simulation)
can be checked against the real world (experiments).
Finally, the expert’s feedback on this system will
result in refining the architecture and designing an
energy efficient communication network
architecture suitable for Smart Grid applications.
3 IMPLEMENTATION ISSUES
In this architecture we provide a monitoring network
that can be used by distributed control networks. The
centralized control network is the norm in the
electrical grid. Its advantage is that control can be
optimized over the whole system. However, it has
SMARTGREENS2012-1stInternationalConferenceonSmartGridsandGreenITSystems
68

problems such as information flooding, single point
of failure, less security and scalability. Migration
from centralized control to distributed control
network is also supported by Yang et al. (Yang et
al., 2011) who believe that the current central
control is no longer sufficient for the new power
network with complex operational system and
should be replaced by distributed control. In future
by monitoring the response of the system to different
control mechanisms, such as local control and
optimized global control, we can propose an optimal
control network structure.
Moreover, in this section we consider the
choice of technologies used to implement the
architecture and how we selected them in order to
address the two problems mentioned in Section 1.
We could eliminate the first problem, namely energy
constraint by sending data from the sensors via
existing electrical power lines. However information
transmission over power lines has the following
shortcomings (Galli et al., 2010): 1-Limited
bandwidth, 2-Cable breakage will cause impaired
connections, 3-Noisy channel, 4-Advanced noise
filtering and error correction mechanism is required,
5-Communications between appliances of different
vendors is a big challenge, 6-Wire line technology
needs a plug or socket to be connected to the device,
which will result in nonflexible location of the
device. Wireless technology is less reliable and
secure but it offers low cost communication with
various ranges of bandwidth. It provides
communication to geographical areas that are not on
the wired network. Nordell (2008) shows wireless
can be used either for communications in the
substation, or over longer path such as between
substations or between enterprise and the substation.
Moreover, wireless systems show resistance to
electromagnetic interference of the system in high
electric and magnetic fields in each substation. Thus
for this reason we choose wireless technology as a
means of communication.
Since we intend to integrate information
gathering and control, an intelligent monitoring
system should be implemented to keep track of
collected data by sensor nodes. Then we need to
feed the real-time data from the sensor network to
the electrical network simulator. Having real-time
data instead of historical data may help us to
perform high-fidelity simulation that will result in
more accurate predictions. In this system, unlike the
other intelligent networks, we did not use SCADA
(Supervisory Control and Data Acquisition).
SCADA (Daneels and Salter, 1999) is only able to
monitor the critical areas of a network; whereas, our
architecture goes beyond that and monitor the entire
network. Also SCADA system has slow data update
rate, which makes it inefficient for Smart Grid
applications (Qiu et al., 2011). Considering the
weaknesses of the SCADA system, the lowest layer
of this architecture designed with WSN.
For reasons of efficient utilisation of energy in
collecting data from the WSN we use cluster-based
communication. Each cluster has a cluster head,
which can be a more a powerful sensor than the
other sensors. The sensors will send their data to the
cluster head wirelessly, and the cluster head is
responsible for transmitting the data to the base
station. A survey (Abbasi and Younis, 2007) on
clustering algorithms for wireless sensor network,
also confirm our assumption that the cluster based
communication provide more efficiency and longer
life time. The survey goes on to state that in addition
to advantages of clustering such as network
scalability and energy efficiency, clustering can
localize the route set up within the clusters and
consequently decrease the size of routing table
stored at a single node. Moreover, the range of inter
cluster interactions to the Cluster Head (CH) is
restricted, and redundant message exchange is
prevented, which help in preserving communication
bandwidth. In addition, since the network topology
is stabilized with the help of clustering at sensor
level, resulting in cuts on topology maintenance
overhead. Also the sensors are only concerned about
their connection to their CH, and would not be
affected by the modifications at inter-CH levels. On
the other hand, based on application requirements,
the events monitored can be either continual or
intermittent. The continual monitoring ends up in
generating considerable amount of traffic to be
routed to the sink. In In-network data processing
similar packets from different nodes can be
aggregated in order to reduce the number of
transmissions. Since communications are more
energy consuming than computations, this technique
can save substantial amount of energy. Also, given
that the first level of sensors are using Bluetooth
communication with short range of data
transmission, a cluster head is provided to offer
longer range of communication, and be able to
transfer data from lowest level to the higher levels.
The cRIOs (compactRIO) used in the third layer
of the hierarchy are control and acquisition units.
These cRIOs can also measure various quantities
and can be programmed and used in controlling and
monitoring applications. The live data from cRIO
will be sent to the next layer of the hierarchy,
responsible for testing and controlling the substation
ANEXPERIMENTALCOMMUNICATIONARCHITECTUREFORMONITORINGANDCONTROLOFSUB-GRIDS
69

level. This layer is using a graphical programming
environment called LabVIEW for measuring,
testing, and controlling the system. Additionally, the
collected data from cRIOs will be transferred and
saved in the database layer, which can be accessed
by the local control unit. The local control unit,
being the highest layer of the hierarchy can query
the three sensing layers and access the real-time and
historical data.
4 SENSOR NETWORK
SIMULATION
In order to evaluate the optimal method of
implementing the WSN, TOSSIM (Levis and Lee,
2003), an existing wireless sensor network
simulator, has been selected which simulates the
nodes running on TinyOS (Levis et al., 2005)
operating system. Although TOSSIM is a more
complex simulation compared to abstract
simulations, but it enables users to take their
implementation and run it on the actual mote. This
feature motivates us to select TOSSIM over other
existing simulations. Therefore, we are able to run
and test our prototype implementation on the real
physical environment as well as laboratory-based
environment. Additionally, TinyDB (Madden et al.,
2003) which is a query processing system has been
extended to meet the needs of the Smart Grid.
TinyDB is able to query the sensors and save the
results in a database layer. The database can save
real-time data received from sensor network plus
historical data of the system. These data will then be
delivered to a higher-level unit. One difference
between TinyDB and traditional database is that
when we post a query to the sensors with TinyDB
installation we receive the real-time data instead of
receiving archived data in reply. Given that sensors
are battery-powered devices, we tend to reduce
power consumption in the system as much as
possible. A typical strategy of power-efficient in-
network processing algorithm minimizes the
communication cost by applying filtering and
aggregation inside the sensor network and provides
routing of data from a physical environment to a pc.
The reason why we select TinyDB over the other
query processing systems is that, not only it does
contain the same features of a conventional query
processing (such as join, select, project, and
aggregate information), but also it provides
functionality for minimizing power consumption by
using the acquisitional techniques. ACquisitional
Query Processing (ACQP) (Madden et al., 2005)
focuses on both conventional techniques as well as
the new features of query processing. These new
features focus on when, where, and how often data
are sampled and send to a query processing operator.
In contrast to conventional passive systems, power
consumption can be minimized by focusing on the
location and cost of data acquisition.
To extract the desired information from the
electrical network TinyDB has been extended by
adding the SmartGrid component for electrical
network applications. This extension enables us to
extract the environmental information about our
prototype electrical network and feed them to
another source of computation for the further
analysis and gaining the predictive real-time system
control. In future, this extension will be used to
produce measured data from the real environment.
5 VISUALISATION OF THE TEST
BED
In this section we will demonstrate the overlay of the
electrical network information on the map view using
Google Maps API (Application Programming
Interface). This tool enables users to click on the
desired section in the network and check the related
data.
5.1 Related Work
The work in (Haines et al., 2009) consider the map
based graphical user interface as a significant factor
for water engineers which enable them to run ‘What-
if’ simulations and visualise the results of their
simulations. They show how dynamic information
and prediction of network state can be accessed
using lightweight devices and visualised in user
friendly Google Maps based web interfaces. Also,
another study by (Stoianov et al., 2007) uses Google
map to visualize the data related to water network.
They enable their users to choose a sensor and
extract the related data from the water grid. The
Google map visualization techniques can be applied
to the other networks such as electrical grids. They
are used to retrieve the data and help the users to
better understand the network condition. The figure
2 shows how data relating to the sensors can be
overlaid on a GIS (Google Maps).
5.2 Test Bed
This real project is being implemented on the
medium voltage power network of the University of
SMARTGREENS2012-1stInternationalConferenceonSmartGridsandGreenITSystems
70

Figure 2: University of Manchester Campus.
Manchester campus. Also real equipment, real data,
and professionals in the field are provided. We are
now in the stage that this system is going live.
Considering that currently there is no information
available below 33 kV, our research is quite valuable
since it will deliver the collected data to the experts
and demonstrates what is happening in the lower
voltage network that will consequently offer better
control over the grid. This test bed only considers
eleven 6.6 kV substations that are equipped with
sixteen monitoring systems called cRIO which
collect the data from the network and process them.
The substations with one transformer are equipped
with one cRIO, whereas substations with two
transformers are supplied with two cRIOs. These
cRIOs are running at 4Hz, thus we are receiving four
samples per second, measuring three phases
voltages, currents, active powers, power factors,
voltage's spectrums (eight channels for each phase)
and current spectrums (eight channels) and
frequency. Each substation can provide wireless and
wired data communication to the data server.
In order to prevent data loss if the links go down,
data should be stored locally in the cRIO memory
and transferred once a day to the database layer.
Subsequently, the live data will be sent, from cRIO
to a pc running LabVIEW via TCP/IP or wireless
communication to test and control the substation
level. The live data will then be transferred and
stored in the database layer. Given that better
monitoring will result in more efficient control over
the system, a graphical display of the network is
provided for electrical engineers. It is helpful for
them to utilize the visualization technology in order
to track and discover the faulty part of the grid and
take remedial actions. The figure 2 illustrates the
University of Manchester campus map, where the
red pin shows the first cRIO, and the rest of the
cRIOs are link together with the red lines.
This tool enables the operators to observe the
Google map view of the test bed and schematic view
of the electrical network. The provided visualisation
tool has some control functions such as panning and
zooming. It also locates substations on the map
according to their longitude and latitude, and
demonstrates the related information. It is able to
connect to the live database and data graph to
display real-time data in order to help experts better
comprehend what is happening in the local area
network. If the measured data pass the defined
threshold the tool will send an alert, so operators can
recognize the fault very quickly and take corrective
actions. In future we will add more functionality to
the tool, and show the results of network simulations
on the map. Briefly, it is assumed that the
combination of the visualization technology and
simulation technology allow operators to better
predict the effect of course of actions by observing
generated results of simulations on the map.
ANEXPERIMENTALCOMMUNICATIONARCHITECTUREFORMONITORINGANDCONTROLOFSUB-GRIDS
71

6 SUMMARY
We have described how we have developed an
architecture for monitoring and controlling the local
area in the sub-Grids. We also describe how we
intend to use simulation to tune the implementation
of the architecture on a real test bed, namely a sub-
Grid covering a large university campus. The
particular interest of our work is the close
connection between design and testing of the
architecture and also that it will enable information
to be gathered from the working of a real system
operating a sub-Grid level where monitoring has not
previously been deployed.
In future, this research will focus optimising the
WSN topology and balancing between the cost of
data transmission, data computation and data
compression technique in order to bring more energy
efficiency to the system. Also, the ever increasing
volume of data gathered from the grid and the
probability of data loss in the system, necessitate
more investigations on data optimizing techniques in
databases. Finally, further work needs to be done to
establish publish-subscribe architecture to provide a
P2P architecture between local areas.
REFERENCES
Abbasi, A. A. & Younis, M. 2007. A survey on clustering
algorithms for wireless sensor networks. Computer
Communication, 30, 2826-2841.
Daneels, A. & Salter, W. 1999. WHAT IS SCADA? In:
Accelerator and Large Experimental Physics Control
Systems 1999 Trieste, Italy. 339-343.
Ericsson, G. N. 2010. Cyber Security and Power System
Communication-Essential Parts of a Smart Grid
Infrastructure. IEEE TRANSACTIONS ON POWER
DELIVERY, 25, 1501.
Galli, S., Scaglione, A. & Wang, Z. 2010. Power Line
Communications and the Smart Grid. In: First IEEE
International Conference on Smart Grid
Communications (SmartGridComm), 4-6 Oct. 303-
308.
Haines, R., Khan, K. & Brooke, J. 2009. Bringing
simulation to engineers in the field: a Web 2.0
approach. The Royal Society, 2635-2644.
Heinzelman, W. R., Chandrakasan, A. & Balakrishnan, H.
2000. Energy-Efficient Communication Protocol for
Wireless Microsensor Networks. In: Proceedings of
the 33rd Hawaii International Conference on System
Sciences-Volume 8, 820485: IEEE Computer Society,
1-10.
Khan, K., Haines, R. & Brooke, J. M. 2010. A Distributed
Computing Architecture to Support Field Engineering
in Networked Systems. In: Proceedings of the 2010
International Conference on Complex, Intelligent and
Software Intensive Systems, 1796283: IEEE
Computer Society, 54-61.
Levis, P. & Lee, N. 2003. TOSSIM: A Simulator for
TinyOS Networks. University of Berkeley. 115-148
Levis, P., Madden, S., Polastre, J., Szewczyk, R.,
Whitehouse, K., Woo, A., Gay, D., Hill, J., Welsh, M.,
Brewer, E. & Culler, D. 2005. TinyOS: An Operating
System for Sensor Networks Ambient Intelligence.
Springer Berlin Heidelberg.
Machell, J., Mounce, S. R. & Boxall, J. B. 2010. Online
modelling of water distribution systems:a UK case
study. Drinking Water Engineering and Science, 279–
294.
Madden, S., Hellerstein, J. & Hong, W. 2003. TinyDB: In-
Network Query Processing in TinyOS.
Madden, S. R., Franklin, M. J., Hellerstein, J. M. & Hong,
W. 2005. TinyDB: An Acquisitional Query Processing
System for Sensor Networks. ACM Transactions on
Database Systems, 30, 122–173.
Nordell, D. E. 2008. Communication systems for
Distribution Automation. In: Transmission and
Distribution Conference and xposition. IEEE/PES, 21-
24 April. 1-14.
Qiu, M., Gao, W., Chen, M., Niu, J. W. & Zhang, L. 2011.
Energy Efficient Security Algorithm for Power Grid
Wide Area Monitoring System. IEEE
TRANSACTIONS ON SMART GRID, 2, 715-723.
Raghunathan, V., Schurgers, C., Park, S. & Srivastava, M.
B. 2004. ENERGY EFFICIENT DESIGN OF
WIRELESS SENSOR NODES. Wireless Sensor
Networks. Kluwer Academic Publishers. 51-69
Stoianov, I., Nachman, L., Madden, S. & Tokmouline, T.
2007. PIPENET a wireless sensor network for pipeline
monitoring. In: Proceedings of the 6th international
conference on Information processing in sensor
networks, Cambridge, Massachusetts, USA. 1236396:
ACM, 264-273.
Yang, Q., Barria, J. A. & Green, T. C. 2011.
Communication Infrastructures for Distributed Control
of Power Distribution Networks. Industrial
Informatics, IEEE Transactions on, 7, 316-327.
SMARTGREENS2012-1stInternationalConferenceonSmartGridsandGreenITSystems
72
