
A NEW
VISUALIZATION METAPHOR
FOR ASSOCIATION
RULES
Zohra Ben Said
1
, Fabrice Guillet
1
, Paul Richard
2
, Julien Blanchard
1
and Fabien Picarougne
1
1
LINA, UMR 6241 CNRS, University of Nantes, Nantes, France
2
LISA, EA 4094, University of Angers, Angers, France
Keywords: Visual Data Mining, Visualization, Knowledge Discovery in Database, Association Rules.
Abstract: In order to discover knowledge from large amount of results generated by the association rules extraction
algorithms, visual representations of association rules can be very beneficial to the user. Those
representations support the user in finding and validating interesting knowledge. All techniques proposed
for association rule visualization have been developed to represent association rule as a hole without paying
attention to the relations between attributes and the contribution of each one. In this article, we propose a
new visualization metaphor for association rules. This new metaphor represents attributes which make up the
antecedent and the consequent, the contribution of each one to the rule, and the correlations between each
pair of antecedent and consequent.
1
INTR
ODUCTION
Association rule extraction (Agrawal et al., 1993) is
the task of finding correlations between items in a
dataset. Initial research was largely motivated by the
analysis of market basket data, the results of which
allowed companies to more fully understand purcha-
sing behavior and, as a result, better target market
audiences. An association rule is an implication of
the form X
➜ Y, where X (antecedent) and Y
(consequent) are non-intersecting sets of items. For
example, milk, eggs
➜ bread is an association rule
says that when milk and eggs are purchased, bread is
likely to be purchased as well. At the output of the
association rules extraction process, the user
(decision- maker) must evaluate and select the
interesting part of the results (known as rule post-
processing). To select interesting rules from the set
of all possible rules, constraints on interestingness
measures can be used. The best known constraints
are the minimum thresh- olds on support and
confidence.
•
The support:supp(X ➜ Y) = Nb of
transactions which contain X and Y / Nb of
transactions in the database,
•
The confidence:conf
(X
➜
Y) = Nb of
transactions which contain X and Y / Nb of
transactions which contain X.
The main drawback of the association rule
extraction process is the volume of generated rules
which often greatly exceed the size of the
underlying database. Cognitive processing of
thousands of rules takes much more time than
generating them even by a less efficient tool. To
reduce the cognitive load, visual representations of
association rules are used to facilitate and speed up
comprehension and make easier the rules
comparison. All techniques proposed for rule
visualization have been developed to represent an
association rule as a hole without paying attention
to the relations between attributes which make up
the antecedent and the consequent and the
contribution of each one of them to the rule.
Attributes component of an association rule may be
more informative than the rule itself (Freitas, 1998).
Two rules with the same value of interestingness
measures can have very different degrees of
interestingness for the user, depending on which
attributes occur in the antecedent and in the
consequent. In the same way, the information found
in form of relations between the attributes
(correlation) provides the analyst with a better and
clearer image than analysis a rule (Imielinski and
Virmani, 1998). Exploring an association rule
attributes enable deeper insight into the data.
Analysts can be interested by those relationships,
rather than static rule. In this paper we propose a new
803
Ben Said Z., Guillet F., Richard P., Blanchard J. and Picarougne F..
A NEW VISUALIZATION METAPHOR FOR ASSOCIATION RULES.
DOI: 10.5220/0003949308030808
In Proceedings of the International Conference on Computer Graphics Theory and Applications (IVAPP-2012), pages 803-808
ISBN: 978-989-8565-02-0
Copyright
c
2012 SCITEPRESS (Science and Technology Publications, Lda.)
association rule metaphor which represents relations
between at- tributes and the contribution of each one
to the association rule.
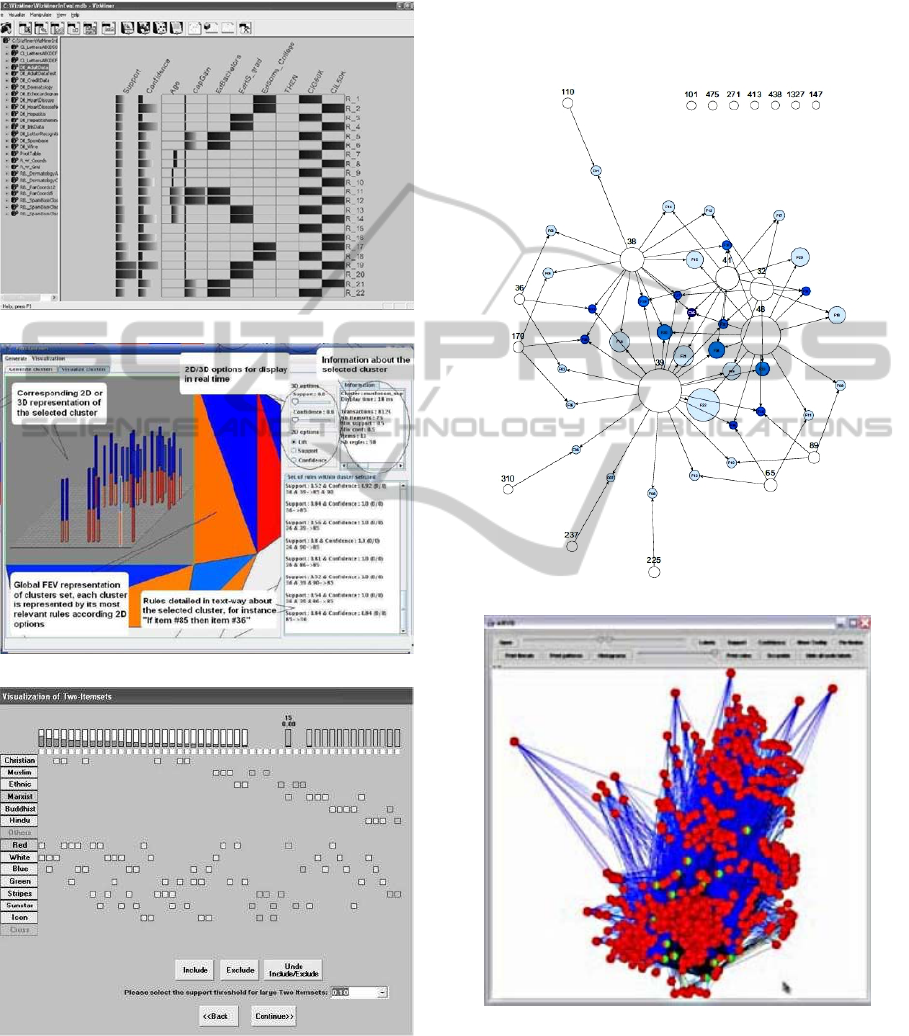
(a): (Kopanakis and Theodoulidis,
2003)
(b): (Couturier et al.,
2007)
(c): (Liu and Salvendy,
2006)
Figure 1: Illustrations of association rule visualization tools
based on grid structures and bar charts.
2 ASSOCIATION
R
ULE
VISU
ALIZ
A
TION
Visualization can be very beneficial to association
rule mining (Simoff et al., 2008). In fact,
visualization techniques are an effective means to
(d): (Gordal and Demiriz,
2006)
(e): (Bruzzese and Buono,
2004)
Figure 2: Illustrations of association rule visualization tools
based on graph representations.
provide user with meaningful visual
representations
instead of poorly intelligible textual lists. To display
association rules mining results, typical visual
IVAPP 2012 - International Conference on Information Visualization Theory and Applications
804

representations are grid-like structures and bar charts
(Figure.1). The grid view consists of a 2D or 3D
matrix of cells where each cell represents a rule
(Kopanakis and Theodoulidis, 2003; Couturier et al.,
2007; Liu and Salvendy, 2006). One matrix
dimension represents rules antecedents and the other
one represents rules consequent. Each cell is filled
with colored bars indicating rule support and
confidence values. However, this representation
often suffers from occlusion. Moreover, it is difficult
to represent rules if there are too many different at-
tributes in the data or if the rules have many items.
Other visualization techniques are based on graph
visualization (Bruzzese and Buono, 2004; ?), the
nodes and the edges respectively representing the
items and the rules (Figures 2). The interestingness
measures are symbolized by colors and sizes. Other
work uses 3D objects to represent association rule.
In (Blanchard et al., 2007), each rule is represented
by a sphere, whose radius maps its support, and by
a cone, whose base width maps its confidence
(Figure 3). Additionally, the colors of the sphere and
cone redundantly represent a weighted average of the
measures. the rule position in the arena represents the
implication intensity. It’s must be noticed that the
presented methods and techniques are generally
supplied with few interestingness measures and
none of these methods represents the relations
between attributes in the rule and the contribution of
each one of them.
3 IMPORTANCE OF
RULE’S
INDIVIDUAL
A
TTRIB
UTES
3.1
Attribute Interaction
Two attributes are correlated if they are not
independent. Two attributes are independent if
changing the value of one does not affect the value
of the other. The lift measure calculates the
correlation between two attributes from the
antecedent or the con- sequent. The correlation
between two attributes rep- resents the amount of
information shared among the two attributes. The
lift measure determines whether attribute1 and
attribute2 have a positive (lift >1) or a negative (lift
<1) correlation. The correlation is considered
positive (negative) if the observed frequency of
example satisfying both attribute1 and attribute2 is
greater (smaller) than the expected frequency
assuming statistical independence
between attribute1
and at- tribute2. The (Freitas, 2001) study showed
that the concept of attributes interaction can be
beneficial to the association rule extraction process
and proposed to introduce attribute interaction in the
design of association rule mining systems.
Attributes interaction allows detection surprising
knowledge which can’t be discovered analyzing the
whole rule. The relationships expressed in a rule
totality is quite different from the relationships
expressed in separate rule parts (antecedent and
consequent).
On the other hand, to discover useful association
rules, the user needs to get insight into the data and
understand the relationships between the attributes
and their statistical properties (Chanda et al., 2010).
Exploring attributes relation enables deeper insight
into the data and learn about the data model. In
many case (biological or genetic context for example)
antecedent items has weak associations with
consequent. However, they interact together in a
complicated way to control the consequent
(Chanda et al., 2010).
3.2
Attribute Importance
An attribute can be important for the user if
regularities are observed in a smaller dataset, while
being unobservable in the entire data. A rule can be
considered as disjunction of rules. The size of a
disjunct (rule) is the number of items composed the
rule’s antecedent and the rule’s consequent. For
example: r : X1 X2 X3
➜ Y1 Y2 is a rule. A
disjunction of rules is r1 :
X1
➜
Y1 Y2, r2 :
X2
➜
Y1 Y2, r3 : X3 ➜ Y1 Y2, r4 : Y1 ➜ X1 X2 X3 and
r5 : Y2
➜ X1 X2 X3. At first sight, it seems that this
small rules has no importance, since they can be
considered as a redundant rules. Based on this view,
all most extraction algorithms do not keep this rules
in the results. However, small rules have the
potential to show unexpected relationships in the
data (Freitas, 1998). (Provost and Aronis, 1996)
proved that small rules were considered interesting in
their field application. Accordingly, it would
beneficial that the user can see automatically this
small rules.
In order to evaluate the contribution of each item
to rule (Freitas, 1998) has proposed the Information
Gain measure which can be positive or negative. Item
with high positive Information Gain is considered as
a good one. Item with high negative Information Gain
is considered as a bad one and should be removed
from the association rule. From a rule interesting
perspective, the user knows already the most
important attributes for its field, and rules containing
these items may not be much interesting. At the
same time, a rule includes attributes with low or
A NEW VISUALIZATION METAPHOR FOR ASSOCIATION RULES
805
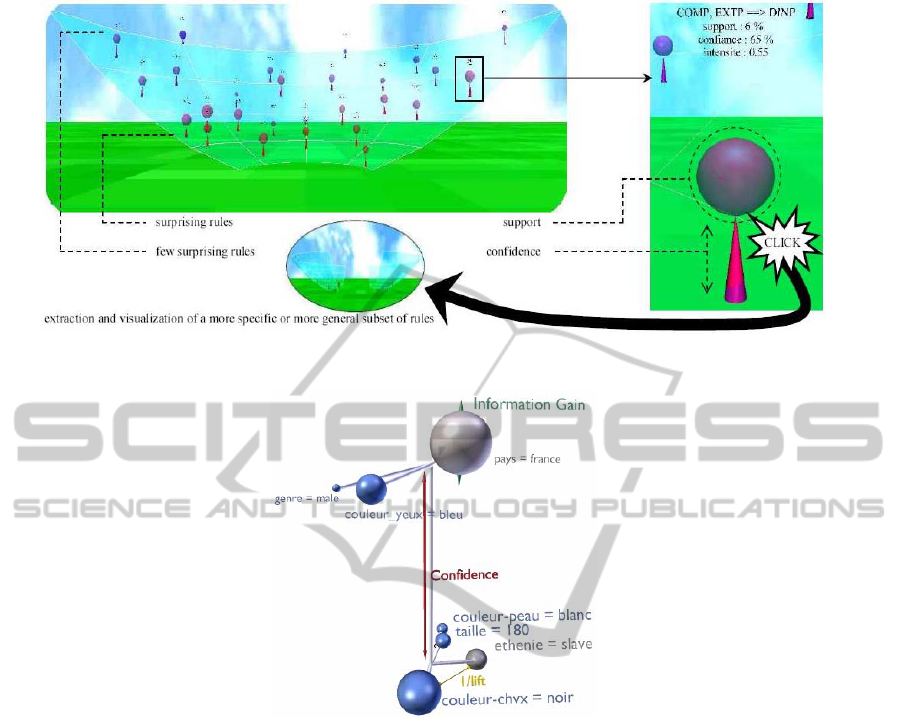
Figure 3: Illustrations of Arvis (Blanchard et al., 2007).
Figure 4: The visual association rule metaphor.
negative information gain (logically irrelevant) can
surprise the user in cases where attributes correlation
can make irrelevant item into a relevant one. This
phenomenon can be interesting to the user.
4 ASSOCIATION RULE
METAPHOR
A major default of association rule visualization
methods presented in Section 2 is the inability to show
the attributes that make up the association rule while
they are may be interesting to the user. Another limit,
some of those methods do not enhance rules
interestingness measures values. For instance,
association rules visualization methods based on
graph or matrix use color to represent some
interestingness measures. This graphic encoding
choice for quantitative variables is known to be
wrong in information visualization (Bertin, 1984).
For our association rule metaphor we refer to
Bertin’s semiology (Bertin, 1984) to encode rule
interestingness measures. As advocated by (Bertin,
1984), we choose a graphic en- coding based on
positions and sizes to enhance the most important
interestingness
measures which is: Information Gain
and correlation between attributes. To have the
greatest degree of freedom we choose to use a 3D
representation. Our metaphor (Figure 4) shows two
types of interestingness measures.
The first one matches rule attributes description
which are categorical variables from the graphic
semiology point of view. Each attribute has an
associated continuous variable corresponding to the
informative gain of each attribute. In the 3D space,
each attribute is represented by a sphere and his size
is an effective representation of this metric. We note
here that the user must know if an item belongs to
the antecedent or the consequent. Therefor, we
should separate the items of the antecedent to the
items of the consequent. in the representation space.
IVAPP 2012 - International Conference on Information Visualization Theory and Applications
806
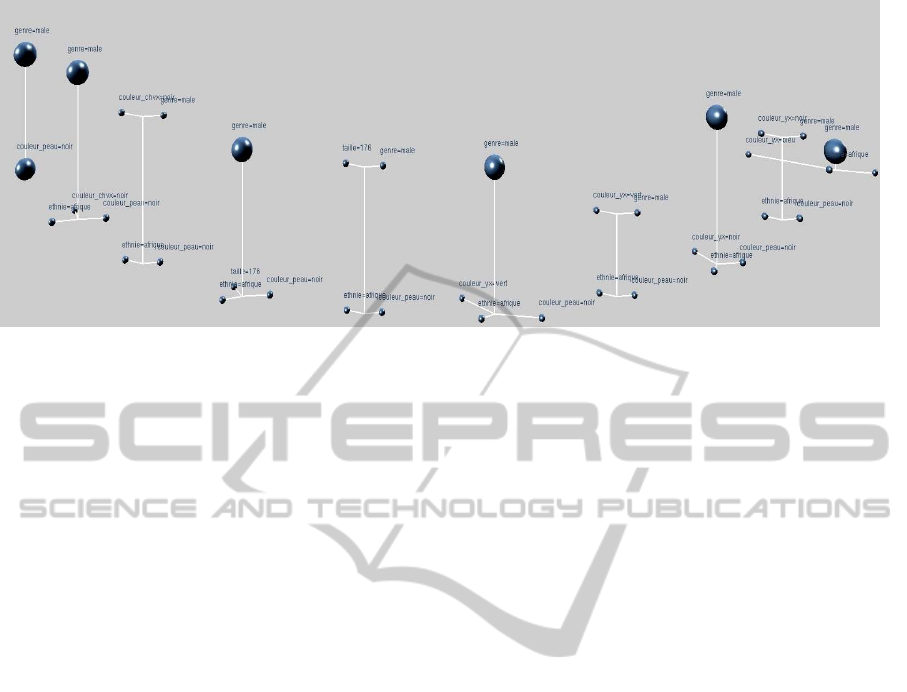
Figure 5: Illustration of a set of association rules.
The lift is a positive measure which used to
indication how much two items are correlate. A
distance between each two items of the same group
is an effective representation of this metric. More
the items are correlate more the spheres are close. To
generate items coordinates in 3D space we use
dynamic graph (Hendley et al., 1999). The dynamic
graph algorithm enables the spheres self-
organization in the visualization area by the use of a
force system in order to find a steady state and
determine the sphere positions. Using the hyper
system allows correlated items to be near each
other, and independent items to be far away. This
visualization consists of spheres and links whose
properties are given by the association rule
parameters. Each sphere represents an item and his
size and the color represent his contribution to the
rule. The sphere size represents the Information Gain
(Freitas, 1998) of the item and color shows if the
gain is positive (blue) or negative (gray). Graphical
encoding should highlight items with high positive
contribution and those with high negative
contribution (both are interesting to the user).
The second type of interestingness measures
correspond to the metric associated with the rule
(support, confidence, etc.). This meta information
that describe the properties of the rule are quantitative
variables according to Bertin’s semiology (Bertin,
1984). Theoretically, it is possible to represent a large
number of metrics using visual variables appropriate
to the area of interest of each user. For example,
we can represent the confidence or the support by
a distance between the antecedent and the
consequence. The visual metaphor stresses the rules
with hight confidence or support (Figure 5).
Furthermore, complementary text labels appear
above each objects to give the name of the
corresponding item.
5
CONCLUSIONS
In this study, we propose a new association rule
metaphor allowing the visualization of attributes
com- posing the association rule. Also, it shows
attributes relationships and contribution of each one
of them. but merely developing only novel visual
metaphor id rarely sufficient to make new
discovery. In association rule extraction process, the
decision-maker is overwhelmed by the association
rule algorithms results. Representing these results as
static images limits the visualization usefulness.
This explains why the user need to be able to
interact with the association rules representation in
order to find relevant knowledge. Interaction allows
also the user integration in the association rule
extraction process. The user should be able to
manipulate the extraction rules algorithms and not
only the graphical representations. This allows to
focus on interesting knowledge from the user point
of view, in order to make the association rule methods
be more generically useful to users. Our future works
will mainly concern the development of a human-
centered tool for rules extraction and manipulation
and the implementing a new operators of interesting
association rule extraction.
REFERENCES
Agrawal, R., Imielinski, T., and Swami, A. (1993). Mining
association rules between sets of items in large
databases. In Proceedings of the 1993 ACM SIGMOD
international conference on Management of data,
pages 207 – 216.
A NEW VISUALIZATION METAPHOR FOR ASSOCIATION RULES
807

Bertin, J. (1984). Semiology of Graphics: Diagrams,
Networks, Maps. University of Wisconsin Press.
Blanchard, J., Guillet, F., and Briand, H. (2007).
Interactive visual exploration of association rules with
rule-focusing methodology. Knowledge and
Information Systems, 13(1):43–75.
Bruzzese, D. and Buono, P. (2004). Combining visual
techniques for association rules exploration. In
AVI’04: Proceedings of the working conference on
Advanced visual interfaces, pages 381–384, New
York, NY, USA. ACM.
Chanda, P., and A. Zhang, J. Y., and Ramanathan, M.
(2010). On Mining Statistically Significant Attribute
Association Information. In SDM, pages 141–152.
Couturier, O., Hamrouni, T., Yahia, S. B., and Nguifo, E.
M. (2007). A scalable association rule visualization to-
wards displaying large amounts of knowledge. In
IV’07: Proceedings of the 11th International
Conference Information Visualization, pages 657–663,
Washington, DC, USA. IEEE Computer Society.
Freitas, A. A. (1998). On objective measures of rule
surprisingness. pages 1–9.
Freitas, A. A. (2001). Understanding the crucial role of
attributeinteraction in data mining. Artif. Intell. Rev.,
16(3):177–199.
Gordal and Demiriz, A. (2006). A framework for
visualizing association mining results. Lecture Notes
in Computer Science, pages 593–602.
Hendley, R. J., Drew, N. S., Wood, A. M., and Beale, R.
(1999). Narcissus: visualising information. In
Proceedings of the IEEE Symposium on Information
Visualization (INFOVIS ’95), pages 90–96. Morgan
Kaufmann Publishers Inc.
Imielinski, T. and Virmani, A. (1998). Association rules...
and what’s next? – towards second generation data
mining systems. Advances in Databases and
Information Systems, 1475:6.
Kopanakis, I. and Theodoulidis, B. (2003). Visual data
mining modeling techniques for the visualization of
mining outcomes. Journal of Visual Languages &
Computing, 14(6):543–589.
Liu, Y. and Salvendy, G. (2006). Design and evaluation of
visualization support to facilitate association rules
modeling. International Journal of Human Computer
Interaction, 21(1):15–38.
Provost, F. J. and Aronis, J. M. (1996). Scaling up
inductive learning with massive parallelism. Machine
Learning, 3(1):33–46.
Simoff, S. J., Bo¨ hlen, M. H., and Mazeika, A. (2008).
Visual data mining. Chapter Visual Data Mining: An
Introduction and Overview, pages 1–12. Springer-
Verlag, Berlin, Heidelberg.
IVAPP 2012 - International Conference on Information Visualization Theory and Applications
808
