
ENERGY CONSERVATION THROUGH SOCIAL COMPETITIONS
IN BLOCKS OF FLATS
Andreas Kamilaris, Giannis Kitromilides and Andreas Pitsillides
Department of Computer Science, University of Cyprus, Nicosia, Cyprus
Keywords:
Energy Conservation, Social Competition, Energy Awareness, Case Study, Blocks of Flats, Social Influence,
Smart Metering, Smart Power Outlets.
Abstract:
Buildings are responsible for a large fraction of the world’s total electrical consumption. Energy awareness
of residents, by means of timely electrical consumption feedback through smart metering, aims to reduce the
waste of energy. Further savings can be achieved by leveraging social norms and entertainment to drive sus-
tainable behavior. In this paper, we investigate two important pillars in the energy saving initiatives, which are
the recreational aspect and the social influence of the neighborhood. We performed a small case study in two
blocks of flats, creating a social competition among the flats, to award those with the best energy management.
Our evaluation results indicate that energy-related social games have the potential to contribute significantly
in reducing the electricity footprint of home residents, engaging them in more sustainable lifestyles.
1 INTRODUCTION
Increasing energy demands, depletion of natural re-
sources and rising costs proliferate the concerns about
rational energy management. Buildings consume a
large proportion of the world’s total electrical energy
(Europa Press Release, 2008). More than 30% of all
greenhouse gas emissions can be attributed to houses
and buildings. Predictions denote that by the year
2030, the global energy demand will more than dou-
ble, rising up the energy-related green gas emissions
by 55% (International Energy Agency, 2007).
According to technological and psychological
studies (Darby, 2006), (Seligman et al., 1981), timely
electrical consumption feedback through smart meter-
ing, is believed to reduce electrical consumption by a
fraction of 5-15%. Smart meters are sensor devices
that record consumption of electrical energy in fre-
quent intervals. Enabling residents to monitor their
electricity footprint in real-time using visualization
tools, allows more intelligent energy management.
In general, people are willing and capable to adapt
their behavior to energy-saving lifestyles if given the
necessary feedback, support, and incentives. Even
though energy awareness through real-time feedback
has contributed in more rational utilization of elec-
tricity, we believe there still exists some margin for
further energy conservation.
While detailed usage of energy makes people
more aware about electricity, the influence of the
community by means of comparisons with other peo-
ple’s consumptions, has the potential to drive resi-
dents towards a more persistent behavioral change
(Cialdini, 2001).
In general, social context can be very influencial
for people (Allcott, 2011). Social norms can moti-
vate people to question their behavior, if they dis-
cover it is not ”normal”. Residents generally learn
from their neighbors and receive encouragement and
support. Receiving daily feedback and taking energy-
saving actions in a social context can increase peo-
ple’s effectiveness (Ehrhardt-Martinez et al., 2010).
In this paper, we investigate whether a social com-
petition towards efficient energy utilization between
neighboring flats, can help residents increase their en-
ergy awareness and reduce their electricity footprint.
Thus, we explore two relatively new parameters, re-
cently introduced in the energy conservation domain:
entertainment through a social game and the social
influence of the neighborhood. We aim to study the
effect of the community in affecting people to save
energy, but also recreation as a means to make resi-
dents more interested about their electrical consump-
tion. We believe that commitment by means of a com-
petition can help people ensure that their actions are
consistent with the common benefit.
In the rest of the paper, we describe the social
competition we developed, discussing our findings
167
Kamilaris A., Kitromilides G. and Pitsillides A..
ENERGY CONSERVATION THROUGH SOCIAL COMPETITIONS IN BLOCKS OF FLATS.
DOI: 10.5220/0003950301670174
In Proceedings of the 1st International Conference on Smart Grids and Green IT Systems (SMARTGREENS-2012), pages 167-174
ISBN: 978-989-8565-09-9
Copyright
c
2012 SCITEPRESS (Science and Technology Publications, Lda.)

from a small case study involving two blocks of flats,
one in an urban area and another at a suburb.
2 RELATED WORK
Energy conservation is a global issue and numerous
techniques have been proposed for saving energy in
houses and buildings. Some of these techniques in-
clude energy awareness through real-time feedback
(Darby, 2006), (Seligman et al., 1981), utilization of
sensors and actuators for energy-efficient home au-
tomation (Barbato et al., 2009) and deployment of
camera networks to obtain occupancy and usage pat-
terns of residents, in order to intelligently control the
lighting and HVAC system (Erickson et al., 2009).
Furthermore, various studies examined the behav-
ior, preferences and habits of residents, to assist them
then towards saving energy. Some of these studies in-
clude understanding the conflict in the landlord/tenant
relationship (Dillahunt et al., 2010) and perceiving
how householders manage their consumption of natu-
ral gas, electricity and water (Chetty et al., 2008).
The social influence of the community was recog-
nized as an important factor in energy saving initia-
tives. People who are forced to cooperate to achieve
a common goal tend to form a trust between them,
influenced by their actions (Cialdini, 2001).
As an example, OPOWER company exploits so-
cial norms to influence people conserve energy, by
sending energy report letters to residential utility cus-
tomers, comparing their electricity use to that of their
neighbors (Allcott, 2011). According to the company,
this practice has reduced consumption by 2.0%.
StepGreen.org leverages online social network-
ing sites to promote energy-saving behaviors of users
(Mankoff et al., 2010). SocialElectricity is a Face-
book application that allows people to compare the
electricity footprint of their street with that of their
friends, or their own consumption with that at their
neighborhood/village/town (Kamilaris et al., 2011a).
The first social competition for energy conserva-
tion took place at Louisiana State University, through
the UNPLUG project
1
. This was a competition
among campus communities to see who could reduce
energy consumption the most. Students were edu-
cated and encouraged to conserve energy. Nine cam-
pus communities, housing altogether 4,800 residents
participated in the competition, yielding an average
3.7% reduction in energy consumption over a one-
month period. The reduction translated to a savings
of $2,470.
1
http://unplug.lsu.edu/
Figure 1: System Infrastructure.
Our work, partly motivated by the UNPLUG
project, targets a social competition in residential
blocks of flats, to investigate also the neighborhood’s
social influence to the overall energy saving practice.
In contrast to the UNPLUG project, we provided the
residents with continuous electricity-related (indirect)
feedback, giving them incentives to win the competi-
tion, saving energy and money.
3 A SOCIAL COMPETITION FOR
ENERGY CONSERVATION
To motivate people become more aware about energy
and reduce their electrical consumption, we created a
social competition between neighboring flats in large
residential blocks. In the next subsections, we explain
our methodology for realizing this competition.
3.1 Technical Details
For acquiring the electrical consumption of each
flat in real-time, we employed Plogg
2
smart me-
ters equipped with external current transformers for
loads up to 100 Ampere. Ploggs are high-accuracy,
ZigBee-based wireless metering devices, which mea-
sure whole-home or device-specific energy consump-
tion. We attached one Plogg to the mains meter of
every flat, which communicated wirelessly the elec-
tricity data in JSON format to a laptop computer that
received them by means of a Telegesis USB stick.
We installed on the computer the Web-based smart
home application framework described in (Kamilaris
et al., 2011b), (Kamilaris et al., 2011c). The frame-
work was responsible to parse the electricity-related
2
http://www.plogginternational.com/
SMARTGREENS2012-1stInternationalConferenceonSmartGridsandGreenITSystems
168

data, extract the important information and forward
them to a Web server and a Microsoft SQL Server
database. The Web server was developed in C# and
ASP.NET, tightly coupled to the online database. The
system infrastructure is illustrated in Figure 1.
3.2 Feedback and Services to Residents
Through the Web server, residents could authenticate
themselves and get informed in real-time about their
overall ranking in the competition, according to their
electricity footprint. They could also view their his-
torical electrical consumption at the previous days of
the competition, as well the overall electricity con-
sumed by the block. All information about electricity
is translated to money costs, based on the current tar-
iffs of the electric utility.
Our aim was to motivate tenants to reduce their
own energy consumption, but also to acquire energy
awareness for the whole block, contributing to the
overall reduction of energy. We believe that peo-
ple generally respect the sense of social engagement
and coherence and this helps them keep commitment
over time (Passy and Giugni, 2001). In our case, the
block’s community becomes engaged to the goal of
reducing the total electricity consumed.
We did not want to inform people in real-time
about their own consumption, so as to focus our study
most on the social competition as a way to save en-
ergy.
Our Web site included a forum, where people
could communicate and exchange tips about energy
saving practices and techniques. After some requests
from residents, we also developed a Facebook appli-
cation, showing real-time information about the com-
petition and a Facebook group, in which residents
were encouraged to discuss about the study.
For those residents who were not familiar with the
Web, we updated every day the ranking of the com-
petition, together with brief reports about the energy
performance of the building, in a notice box located at
the main lobby. We anticipate that when activities be-
come pervasive, integrated into daily life, strong par-
ticipation in social actions is more likely (Kuznetsov
and Paulos, 2010).
3.3 Rules and Conditions
We decided to elect the winning flat, as the flat that re-
duced most effectively its electrical consumption. To
mitigate the possibility that residents could consume
much energy in the first few days just to reduce it then
and win the competition, we asked them to provide us
with electricity bills from previous months. By ana-
BuildingConsumptionChart1
Page1
0
20
40
60
80
100
120
13579111315171921232527
Day of Month
Energy Consumption (kWh)
6
8
10
12
14
16
18
20
Temperature (C)
Energy Consumption
Temperature
Figure 2: Everyday Electrical Consumption of the whole
Suburban Block.
lyzing the bills, we obtained a complete report of each
flat’s energy performance.
Our award to the winning flat was a real-time en-
ergy monitor from Current Cost
3
. These smart meters
are convenient in installation and use.
The duration of the competition was one month
for each block. In the middle of the competition,
in case there were any flats with high electrical con-
sumption, we decided to inform their tenants about
their energy use and discuss possible ways to reduce
it. In this way, they could become more energy-aware.
Finally, to achieve more complete evaluation, we
prepared questionnaires, which we distributed to the
residents after the competition.
4 CASE STUDY IN BLOCKS OF
FLATS
Our case study included two blocks of flats. The first
is at a suburb, having 10 flats and the second in an
urban area, having 20 flats. In the following sub-
sections, we present the findings of our case study in
these blocks.
4.1 A Block of Flats at a Suburban Area
The first block had 10 flats and was located at a sub-
urban area, 10 Km from the city. Six flats accepted to
participate in the competition, counting in total 10 res-
idents. Two flats refused to collaborate, an old woman
in another flat could not understand our study, while
in one flat the landlord was absent abroad. The ages
of the participants are listed in the first row of Table 1.
The total energy performance of the block, as a sum-
mation of the electrical consumption of all the partic-
ipating flats, is depicted in Figure 2.
3
http://www.currentcost.com/
ENERGYCONSERVATIONTHROUGHSOCIALCOMPETITIONSINBLOCKSOFFLATS
169
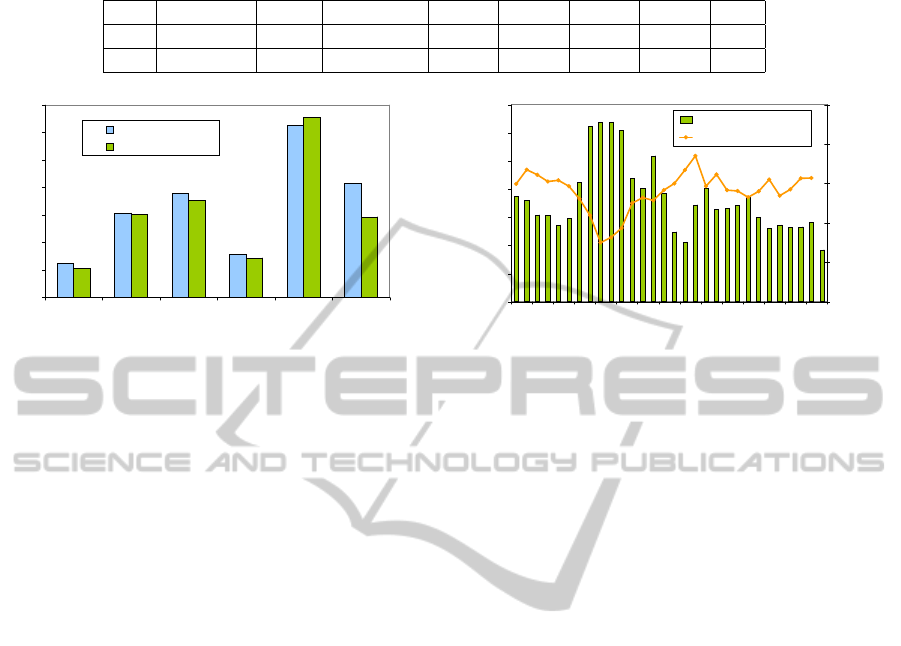
Table 1: Age Distribution of Residents.
No. Block Flats Residents 18-25 26-35 36-45 46-55 56+
1 Suburban 6 10 2 6 2 - -
2 Urban 20 29 10 12 4 3 -
0
100
200
300
400
500
600
700
101 102 103 202 302 303
Flat Number
Energy Consumption (kWh)
Previous Month
This Month
Figure 3: Electrical Consumption Comparison with the Pre-
vious Month for each Flat at the Suburban Block.
Observing the figure, we can see the strong corre-
lation of daily temperature to the energy consumption
of the building. This is clear evidence that a consider-
able percentage of consumed electricity is utilized for
heating.
Because of the high dependencies to temperature,
we can not extract safe conclusions about the energy
savings due to the competition. However, we can just
mention, comparing the first two weeks of the study
with the last two, that the energy consumption in the
last two weeks is reduced by 260 kWh or 26%. Fur-
thermore, in days with similar temperature (e.g. days
10 and 25), the energy consumption towards the end
of the month is reduced by 22%.
The study at this block was conducted in Febru-
ary, 2010 with average monthly temperature 11.60
◦
Celsius and humidity around 63%. Our findings show
that there not exist different consumption patterns in
weekends than in weekdays. Comparing with the
electricity bills of the flats in January, 2010, as shown
in Figure 3, most of the flats have reduced effectively
their electricity footprint. Flats located on higher
floors needed more heating and consumed more elec-
tricity. For better comparisons, we normalized the
energy-related results of February.
Considering that the average monthly tempera-
ture in January was very similar to February, around
11.56
◦
Celsius with humidity 67%, we strongly be-
lieve that the social competition has influenced the
participating flats to reduce their consumption. Only
one flat had increased its consumption. The average
reduction of energy is 11.90%. For our comparisons,
it would be better if we could had found the electric-
ity bill of the same month last year, however, this was
not possible.
0
50
100
150
200
250
300
350
1 3 5 7 9 11 13 15 17 19 21 23 25 27 29
Day of Month
Energy Consumption (kWh)
-1
4
9
14
19
24
Temperature (C)
Energy Consumption
Temperature
Figure 4: Everyday Electrical Consumption of the whole
Urban Block.
In the middle of the competition, we discussed
with the tenant of flat 302 and asked him why he was
consuming so much electricity. He explained to us
that he was not willing to sacrifice his comfort to save
energy and money, as he did not encounter financial
problems. He was not really motivated to contribute
in protecting the environment.
The winners of the competition were a couple
around 30 years old, living in flat 303, who reduced
their electrical consumption by 41%! They both
found this competition as a first-class opportunity to
save money.
4.2 A Block of Flats at an Urban Area
The second block had 20 flats and was located in an
urban area, near the middle of a city. Surprisingly,
all flats, counting 29 residents, accepted to participate
in our study. We estimate that this happened because
most of the residents were young, educated people,
enthusiastic with the idea of a social competition on
their block. The ages of the residents are listed in the
second row of Table 1. The total energy performance
of the block is presented in Figure 4.
Also in this case, energy consumption is strongly
correlated to temperature conditions. Comparing the
first two weeks of the study with the last two, the en-
ergy consumption in the last two weeks is reduced by
1091 kWh or 33%. Since in the second week of the
competition there was a significant drop in tempera-
ture for 5 days, our conclusions can not be accurate.
We can notice that in days with similar temperature
(e.g. days 7 and 26), the energy consumption towards
the end of the month is considerably reduced, of the
order of 13%.
SMARTGREENS2012-1stInternationalConferenceonSmartGridsandGreenITSystems
170

0
200
400
600
800
1000
1200
1400
1600
101 102 103 104 105 106 107 201 202 203 204 205 206 207 301 302 303 304 305 306
Flat Number
Energy Consumption (kWh)
Previous Month
This Month
Figure 5: Electrical Consumption Comparison with the Pre-
vious Month for each Flat at the Urban Block.
This study was conducted in March, 2010 with
average monthly temperature 13.00
◦
Celsius and hu-
midity around 59%. In Figure 5, we compared the
electrical consumption of each flat with the consump-
tion at the previous month (February, 2010), as indi-
cated at their electricity bills.
From the figure, we can see that all flats have re-
duced their consumption significantly. Impressively,
the average energy reduction reaches 27.74%. An im-
portant factor for this reduction is the average increase
of temperature in this month by 2
◦
Celsius. Once
more, residents leaving on the third floor needed more
heating and consumed more energy.
During the competition, we gave notice to resi-
dents of flats 102, 203, 303 and 305 about their in-
creased consumption. The tenant of 102 was a stu-
dent who had computer equipment working 24/7, and
he could not do much about it. Using more energy-
efficient infrastructure was out of his budget. We dis-
covered that three tenants lived at flat 203, while most
of the other flats had only one tenant. Finally, the ten-
ants of 303 and 305 wanted their flats warm the whole
day and they earned a good salary to afford that. Nev-
ertheless, all reduced their consumption, as we can
conclude from Figure 5.
A 31-years-old woman, staying at flat 303, was
the winner of this competition. She managed to re-
duce her electricity footprint by 43%, and she was re-
ally proud of this, because she believed she helped
protecting the environment.
5 DISCUSSION
Our findings suggest that social competitions can
influence residents to reduce remarkably their con-
sumption. We discuss in the following subsections
our general observations and experiences from the
case study.
0
100
200
300
400
500
600
700
800
900
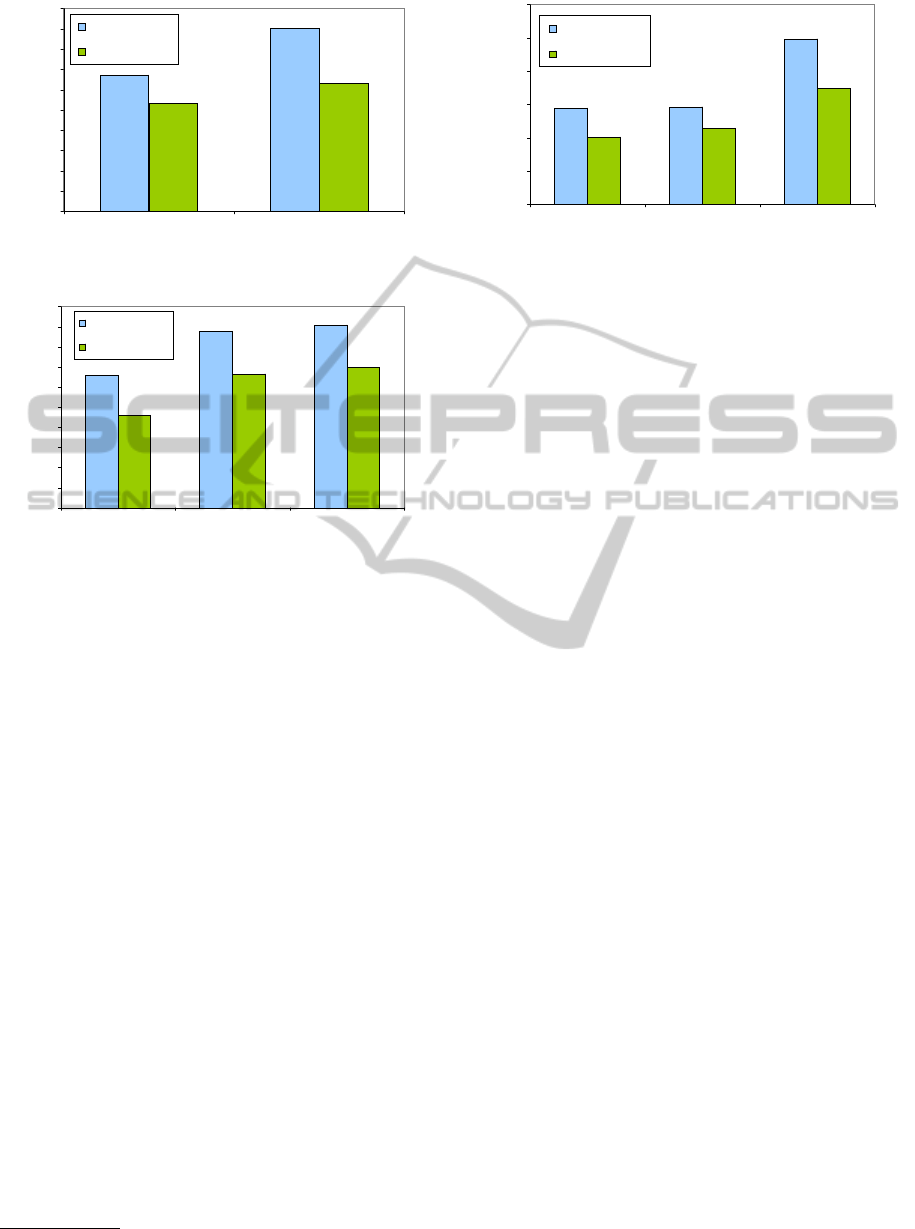
18-25 26-35 36-45 46-55
Age Distribution
Energy Consumption (kWh)
Previous Month
This Month
Figure 6: Electrical Consumption Vs Age Distribution of
Residents.
5.1 Suburban Vs Urban Block of Flats
Comparing the block at the urban location with that at
the suburb, average energy savings in the urban case
were 2.4 times more. People at the suburban block
consumed in average 11% more energy compared to
the urban block. However, temperature strongly af-
fected this fact. Residents at the urban block were
more excited about the competition and took it more
seriously. Since a large proportion of them were
highly educated students, it was easier for them to un-
derstand and accept the motivation and terms of the
competition, inspiring also the other residents to pay
more attention to it.
5.2 Demographic Analysis
In Figure 6, we can study the residents’ distribution of
ages, in relation to their energy consumption. The re-
sults are normalized according to the number of flats
and residents involved. Examining the figure, older
people (ages 46-55) consume more electricity
4
. This
probably happens because they spend most of their
time at home. However, this age group, together with
the age group 26-35, are mostly influenced by the
competition, reducing their consumption by 32%. It
is more convenient for people that spend much time at
home, to observe and analyze their consumption, tak-
ing countermeasures. For example, students may be
sometimes busy with their studies, not having in these
periods much free time in order to dispose a high pri-
ority for reducing their consumption.
Comparing the sex of the residents, as shown in
Figure 7, females tend to consume more electricity.
This is logical, as they usually spend more time at
home, having energy-demanding habits
5
(e.g. wash-
4
We discuss this finding with some reservation because
of the small sample of older people involved in the study.
5
To avoid misunderstandings, we note that males also
have energy-demanding habits, even those listed in the ex-
ENERGYCONSERVATIONTHROUGHSOCIALCOMPETITIONSINBLOCKSOFFLATS
171
0
50
100
150
200
250
300
350
400
450
500
Male Female
Sex
Energy Consumption (kWh)
Previous Month
This Month
Figure 7: Electrical Consumption Vs Sex of Residents.
0
50
100
150
200
250
300
350
400
450
500
123
Residents Per Flat
Energy Consumption (kWh)
Previous Month
This Month
Figure 8: Electrical Consumption Vs Number of Residents
Per Flat.
ing and drying their hair, preparing food). Nonethe-
less, women have contributed more in saving energy,
reaching 30% reductions, while men around 20%. In
general, females were more interested in the compe-
tition and in our efforts than males. They found the
perspective of protecting the environment appealing.
We then compared the electrical consumptions,
according to the number of residents at each flat. We
display this comparison in Figure 8. Obviously, more
tenants at each flat implies more consumption. While
this difference is more significant when comparing
flats having one or two residents, reaching 44%, it be-
comes very small between flats of two and three res-
idents, around 4%. Concerning energy-savings, flats
with one tenant achieved most savings, nearing 30%.
We believe it is easier for someone living alone to de-
velop his own energy-efficient practices. These obser-
vations indicate that future energy-saving campaigns
should target one-bedroom flats, as the margin of po-
tential savings is much bigger.
Our final comparison, presented in Figure 9, was
about the income of the residents, in relation to their
consumption. People with no income are students
who are financially-dependent on their families. As
expected, tenants with high income consumed more
energy. We assume that they are not willing to sacri-
amples, probably to a lesser degree.
0
100
200
300
400
500
600
No Income Below 15000 € Above 15000 €
Yearly Income
Energy Consumption (kWh)
Previous Month
This Month
Figure 9: Electrical Consumption Vs Income of Residents.
fice their comfort just for saving money. On the con-
trary, residents with low income consume less than
half the energy of their high-income neighbors. This
group of people had the least savings in the com-
petition, perhaps because they had already tried to
save energy in the past, in order to reduce their costs.
Even though residents with high income consumed
increased electricity, maintaining high comfort lev-
els, their percentage of energy savings reached 30%.
Most of them were motivated because of environmen-
tal reasons and not because of saving money. This
observation suggests that future practices should try
to influence people from the upper classes, by giving
them incentives about protecting the environment.
5.3 General Statistics
Generally, 72% of the tenants stated that they were
actively involved with our social competition and that
this competition helped them acquire a more sustain-
able lifestyle. 94% believed that this competition will
influence them to save energy in the future. 69%
of them consider that the method of comparing con-
sumption with neighbors is a promising way for sav-
ing energy.
48% of people used our Web site for being up-
dated about the competition. All residents also
checked the information placed everyday in their no-
tice boxes. Younger people preferred to use the
Web in order to get informed, however, older people
found much more practical the notice box. Perhaps,
this inconvenience of older people using technology
needs to be considered when researchers design en-
ergy feedback systems in the future.
Unfortunately, our online forum was not utilized
by the residents for exchanging energy-saving tips.
Our Facebook application was used by six residents
or 15% of people, who preferred to be informed about
the competition while amusing through the popular
social networking site. Although these six people ini-
tially used our Facebook group for discussing about
SMARTGREENS2012-1stInternationalConferenceonSmartGridsandGreenITSystems
172

the competition, they soon stopped doing that. Some
tenants found it somehow weird to discuss online with
the person next door.
Asking the residents whether they wanted to be
informed in real-time about their electricity footprint,
89% were positive. From them, 88% were willing
to buy a product that would show them their energy
consumption in real-time. They would invest at most
70 Euro for such a product. Some of them were sur-
prised when we explained to them that this is possible
at these costs. Some people did not even know that
such products exist.
5.4 Suggestions from Residents
We also asked the tenants for suggestions concern-
ing more effective feedback about energy consump-
tion. The most popular suggestion concerned feed-
back through SMS, sent by the utility once per day.
Daily feedback through email was another interesting
suggestion. Some people requested that the electric
utilities should provide more detailed electricity bills.
Still, 61% believed that our approach is more effective
than what they suggested.
Finally, all residents agree that the government
must give smart incentives to people to save energy.
According to them, these incentives could be simi-
lar competitions with awards from the utilities, scalar
pricing schemes that reward green flats and houses
while punishing energy-wasting buildings, more per-
vasive and real-time energy feedback techniques and
grants from the utilities or the government for renew-
able energy systems and green lighting.
6 CONCLUSIONS
In this paper, we examined the effectiveness of a local
competition for energy conservation using real-time
information about consumption of electricity. A so-
cial competition for blocks of flats was created, en-
couraging tenants to actively take part in the competi-
tion by following energy-saving practices. We wanted
to demonstrate whether the combination of social in-
fluence and amusement can motivate people to save
energy. A small case study was performed in two
blocks, one in an urban location and the other at the
suburb, counting in total 26 flats and 39 residents.
Our findings are very positive, however, they just
constitute the product of a small case study and can
not be considered safe to extract conclusions about the
general population. Furthermore, the selected months
of the study have prevented a solid analysis of the re-
sults, due to the fluctuations of temperature. Future
studies need to select months in which temperature is
not a dominant factor in the energy consumption of
residents.
An important issue when attempting to perform
such studies is to respect the privacy of people. It
must be solely their option whether they are willing
to participate and it must be defined from the very
beginning in which extend their personal data will
be exposed. Written declarations of participation are
needed, to avoid legal problems.
A main drawback of our approach is related to the
necessity of having costly real-time energy monitor-
ing devices installed in the flats, which is not a com-
mon practice nowadays. Nevertheless, the smart grid
6
of electricity suggests the massive deployment of
smart meters in residences, for real-time acquisition
of household electrical consumption. It is planned
that every home in Britain will be equipped with a
smart meter by the end of 2020
7
. Hence, our ap-
proach complies with the future smart grid, as the
smart power outlets we currently employ could be
replaced by residential smart meters. Accordingly,
such social competitions for saving energy could be
enabled by the electric utilities in the near future.
Future work needs to include a larger case study,
involving also blocks of buildings in more rural areas.
Such studies need to be performed to validate our ini-
tial findings and consider more confidently the effect
of social norms on energy conservation. A longer pe-
riod of observation may also be interesting, to foster
the learning effect of the participants.
Long-term influence on residents’ behavior is an
important dimension not yet explored. For example,
considering energy awareness through real-time feed-
back, the saving effects are persistent mostly when the
feedback systems are present (Van Houwelingen and
Van Raaij, 1989). Thus, we need to consider also the
influence of the social competition at the blocks in the
coming months.
In this study, we tried to differentiate our social-
based efforts for saving energy from real-time feed-
back techniques. In such a way, we evaluated our
approach without direct influence from other factors.
Future work could combine continuous energy feed-
back with a social competition, to examine whether
further savings could be achieved.
Also, it would be interesting to consider if any
other incentives, other than the ”ranking and awards”
approach we followed, may be most efficient in such
social competitions.
Our study conforms to the broader vision of smart
6
http://smartgrid.ieee.org/ieee-smart-grid
7
http://news.bbc.co.uk/2/hi/business/8042716.stm
ENERGYCONSERVATIONTHROUGHSOCIALCOMPETITIONSINBLOCKSOFFLATS
173

neighborhoods
8
, defined as groups of buildings (e.g.
blocks of flats) mimicking living systems, collaborat-
ing inside the smart cities of the future. Similar to liv-
ing systems in nature, buildings will act collectively in
relation to the ecosystem (e.g. neighborhood) they re-
side in. This will help to address safety, health-related
or sustainability issues in the smart city, such as en-
ergy conservation and reduction of carbon emissions.
We encourage researchers, organizations and util-
ities to follow our methodology and perform similar
studies, giving awards and incentives to residents. So-
cial influence has the potential to boost the energy-
saving initiatives towards a greener world.
ACKNOWLEDGMENTS
We would like to thank the tenants of buildings
Costantinou 20 and Golden Hill A for their partici-
pation and support during this study. Also, the De-
partment of Computer Science, University of Cyprus
for access to the equipment used during the study.
REFERENCES
Allcott, H. (2011). Social norms and energy conservation.
Journal of Public Economics, 95(9-10):1082–1095.
Barbato, A., Borsani, L., Capone, A., and Melzi, S. (2009).
Home energy saving through a user profiling system
based on wireless sensors. In First ACM Workshop
On Embedded Sensing Systems For Energy-Efficiency
In Buildings (BuildSys), Berkeley, California.
Chetty, M., Tran, D., and Grinter, R. E. (2008). Get-
ting to green: understanding resource consumption in
the home. In Proceedings of the 10th international
conference on Ubiquitous computing, UbiComp ’08,
pages 242–251, New York, NY, USA. ACM.
Cialdini, R. (2001). Influence: science and practice. Allyn
and Bacon.
Darby, S. (2006). The effectiveness of feedback on energy
consumption - A review for defra of the literature on
metering, billing and direct displays.
Dillahunt, T., Mankoff, J., and Paulos, E. (2010). Under-
standing conflict between landlords and tenants: im-
plications for energy sensing and feedback. In Pro-
ceedings of the 12th ACM international conference on
Ubiquitous computing, Ubicomp ’10, pages 149–158,
New York, NY, USA. ACM.
Ehrhardt-Martinez, K., Donnelly, K., and Laitner, J. A. S.
(2010). Advanced Metering Initiatives and Residen-
tial Feedback Programs: A Meta-Review for House-
hold Electricity-Saving Opportunities. Washington,
DC: ACEEE Report No. E105.
8
http://paper.li/CityInnovation/1324428156
Erickson, V. L., Lin, Y., Kamthe, A., Brahme, R., Surana,
A., Cerpa, A. E., Sohn, M. D., and Narayanan, S.
(2009). Energy efficient building environment control
strategies using real-time occupancy measurements.
In First ACM Workshop On Embedded Sensing Sys-
tems For Energy-Efficiency In Buildings (BuildSys),
Berkeley, California.
Europa Press Release (2008). Communication from the
European Commission. Energy Efficiency: Delivering
the 20% target.
International Energy Agency (2007). World Energy Out-
look.
Kamilaris, A., Papadiomidous, D., and Pitsillides, A.
(2011a). Lessons Learned from Online Social Net-
working of Physical Things. In Sixth Interna-
tional Conference on Broadband and Wireless Com-
puting, Communication and Applications (BWCCA),
Barcelona, Spain.
Kamilaris, A., Trifa, V., and Pitsillides, A. (2011b). Home-
Web: An Application Framework for Web-based
Smart Homes. In 18th International Conference on
Telecommunications (ICT 2011), Ayia Napa, Cyprus.
Kamilaris, A., Trifa, V., and Pitsillides, A. (2011c). The
Smart Home meets the Web of Things. Interna-
tional Journal of Ad Hoc and Ubiquitous Computing
(IJAHUC), Special issue on The Smart Digital Home,
7(3):145–154.
Kuznetsov, S. and Paulos, E. (2010). Participatory Sens-
ing in Public Spaces: Activating Urban Surfaces with
Sensor Probes. In ACM Designing Interactive Systems
(DIS), Aarhus, Denmark.
Mankoff, J., Fussell, S. R., Glaves, R., Grevet, C., John-
son, M., Matthews, D., Matthews, H. S., McGuire,
R., Thompson, R., Shick, A., and Setlock, L. (2010).
StepGreen.org: Increasing energy saving behaviors
via social networks. In Proceedings of the 4th In-
ternational AAAI Conference on Weblogs and Social
Media.
Passy, F. and Giugni, M. (2001). Social Networks and In-
dividual Perceptions: Explaining Differential Partic-
ipation in Social Movements. Sociological Forum,
16(1):123–153.
Seligman, C., Becker, L. J., and Darley, J. M. (1981).
Encouraging residential energy conservation through
feedback. Advances in Environmental Psychology
Volume 3 Energy Conservation Psychological Per-
spectives, 3:93–113.
Van Houwelingen, J. H. and Van Raaij, W. F. (1989). The
Effect of Goal-Setting and Daily Electronic Feedback
on In-Home Energy Use. Journal of Consumer Re-
search, 16(1):98–105.
SMARTGREENS2012-1stInternationalConferenceonSmartGridsandGreenITSystems
174
