
A DYNAMIC RECONFIGURATION TECHNIQUE FOR PV AND
CAPACITOR ARRAYS TO IMPROVE THE EFFICIENCY IN
ENERGY HARVESTING EMBEDDED SYSTEMS
Kyungsoo Lee and Tohru Ishihara
Department of Communications and Computer Engineering, Graduate School of Informatics,
Kyoto University, Kyoto, Japan
Keywords:
Energy Harvesting, Embedded System, Optimization, Energy-efficient Transmission, Energy Management
Systems (EMS), PV Array, Reconfiguration.
Abstract:
It is important to maintain high efficiency when using an energy generation source. This high efficiency can be
obtained by a high generating efficiency or a high transferring efficiency. Conventional maximum power point
tracking (MPPT) techniques do not consider the transferring efficiency in the multiple load system. This paper
presents a generalized technique for dynamic reconfiguration of a PV/supercapacitor array with considering
the power consumptions in multiple loads. This technique will minimize the power loss in the converter and
charger of the system. The experimental results show that there is 20-70% power loss reduction comparing
with the conventional MPPT technique in our proposed system. This will make the system more reliable to
operate in stand-alone situation.
1 INTRODUCTION
The global demand for electric energy has continu-
ously increased over the last few decades, and the en-
ergy price continuously goes up. The recent increase
in oil and gas prices has prompted everyone to take
a care for the energy supply and demand. Another
important consideration is the fossil fuel greenhouse
gases, which affect the climate changes. In order to
meet the increasing energy demand in the near fu-
ture, we will be forced to seek environmentally clean
and renewable energy sources. This is the reason that
an energy harvesting from the environment has been
evolving very rapidly.
Energy harvesting itself is not new, however what
makes it new is how to build efficient energy harvest-
ing capabilities into the system. This high efficient
energy harvesting can be classified into a high gener-
ating efficiency and a high transferring efficiency. We
can say that a system has higher generating efficiency
when it generates more power than the others in a
same situation. We can say that a system has higher
transferring efficiency when it has a lower power loss
than the others to transfer the generated energy to con-
sumer.
In this paper, we proposed a technique to improve
the transferring efficiency in a system with photo-
voltaic (PV) cells. This system contains supercapac-
itors to compensate the output power variation of the
PV cells. Supercapacitors are one of the promising
energy storage elements for the energy harvesting sys-
tem because of the long cycle lifetime ant the low
negative environmental impact. Although we demon-
strate our proposed method on a system with PV cells
and supercapacitors, the proposed method is not lim-
ited to them.
2 RELATED WORK
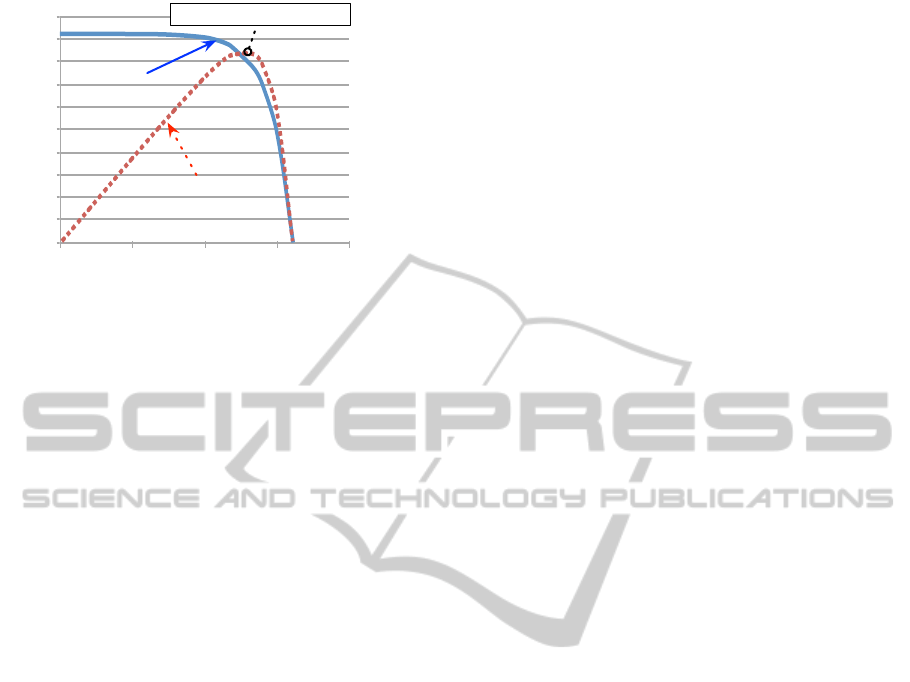
The output characteristics of a PV array vary non-
linearly when temperature or irradiance conditions
change. Therefore, the maximum power point track-
ing (MPPT) techniques are exploited for adjusting the
operating point of the PV cells. IV and PV character-
istics for a commercially available PV array is shown
in Figure 1. The curves of the PV array are obtained
from datasheets (Towada Solar Co. LTD., 2012). The
PV array consists of 10 basic PV cells connected in
series. The maximum power point (MPP) of the PV
array is at a point of (5.08V, 81.8mA) for given inso-
lation and temperature conditions. The MPPT tech-
nique first identifies the maximum power point (MPP)
to draw the maximum power of PV and continuously
175
Lee K. and Ishihara T..
A DYNAMIC RECONFIGURATION TECHNIQUE FOR PV AND CAPACITOR ARRAYS TO IMPROVE THE EFFICIENCY IN ENERGY HARVESTING
EMBEDDED SYSTEMS.
DOI: 10.5220/0003950501750182
In Proceedings of the 1st International Conference on Smart Grids and Green IT Systems (SMARTGREENS-2012), pages 175-182
ISBN: 978-989-8565-09-9
Copyright
c
2012 SCITEPRESS (Science and Technology Publications, Lda.)
0 2 4 6 8
Output voltage (V)
Output current (mA)
IV curve
PV curve
Output power (mW)
400
0
100
200
300
500
80
0
20
40
60
100
MPP (5.08V, 81.8mA)
Figure 1: Maximum power point of PV cell (10 series con-
nection module, (Towada Solar Co. LTD., 2012)).
keeps track of this point against the irradiance varia-
tion and/or load impedance variation. There are many
previous methods that achieve MPPT.
The methods including a perturb-and-observe
(P&O) method, an incremental conductance tech-
nique (Hohm and Ropp, 2000), a ripple correlation
control method (Esram. et al., 2006) and a linear
model based method (Brunelli et al., 2009) (Simjee
and Chou, 2006) have been proposed. The P&O
method and incremental conduction method identify
the MPP by generating a slight change in the current
of PV and observing the change in the power of PV.
Ripple correlation control method finds the MPP us-
ing the time derivative of the current of PV and the
power of PV. As for economical implementations of
MPPT, a small pilot cell or a linear relationship of the
MPP to the open-circuit voltage or short-circuit cur-
rent can help estimate the MPP.
All these MPPT techniques are mainly focused
on the energy generation side. As an aspect of
the energy transferring side, the energy efficiency of
switching converters and voltage regulators has re-
ceived some attention, like battery-aware power man-
agement (Rong and Pedram, 2002), and switching
converter efficiency- aware power management (Choi
et al., 2007). A power matching scheme in (Braun-
stein, 1981) suggests a reconfigurable PV cells to
minimize the power loss in DC-DC converter. Re-
cently, a maximum power transfer tracking (MPTT)
technique is proposed (Kim et al., 2010). The key
point of the MPTT technique is that it guarantees the
maximum energy is transferred into the energy stor-
age element though a charger.
There were some more activities to reduce the
output voltage range of a supercapacitor array by
a series-parallel reconfiguration technique in (Uno,
2009) and to maximize a cycle efficiency and utiliza-
tion of the supercapacitor array by reconfiguring the
series-parallel connection in (Kim et al., 2011).
All these previous techniques are very effective to
make an efficient harvesting system. However, it may
not be true for a system with multiple supply voltage
loads. We will briefly show this in the next Section.
3 MOTIVATION
3.1 The Power Loss in DC-DC
Converters
The DC-DC conversion has been an integral part
of the power delivery chain in energy harvesting
systems because the conventionally targeted syn-
chronous computation load demands stable supply
voltage, which cannot in general be supplied by
power harvesters directly.
The first motivation of this work comes from the
fact that the power loss in a DC-DC converter de-
pends on the difference between its input and output
voltages. More specifically, larger voltage difference
between the input and the output voltages results in
a larger power loss in the DC-DC converter in gen-
eral. For example, if the power source supplies a
much higher voltage than the supply voltage of a tar-
get electric system, a DC-DC converter is typically
used between the PV array and the electric system for
the step-down conversion. However, the conversion
dissipates a considerable amount of power in the DC-
DC converter if the voltage difference between its in-
put and output is large. Figure 2 shows characteristics
of a recent commercial very high efficient buck-boost
converter from TI (Texas Instruments, 2012). This
shows that the power dissipation in the converter is
37.8mW, if the input and output voltages are 5.5V and
1.8V, and the output current is 100mA respectively.
This power loss, 44.4mW is about 25% (= 44.4/180)
overhead for the output power, 180mW.
3.2 Motivational Example
Suppose we have an embedded system consisting of
an energy generator, several types of electronic mod-
ules, and dedicated DC-DC converters as shown in
Figure 3. As mentioned above, the power loss in a
DC-DC converter is roughly proportional to the dif-
ference between the input and output voltages. Ac-
cording to a commercial buck-boost converter (Texas
Instruments, 2012), 44.4mW is dissipated in the con-
verter if the input and output voltages are 5.5V and
1.8V when the output current is 100mA. In this case,
25% (= 44.4/180) of the load power consumption is
SMARTGREENS2012-1stInternationalConferenceonSmartGridsandGreenITSystems
176
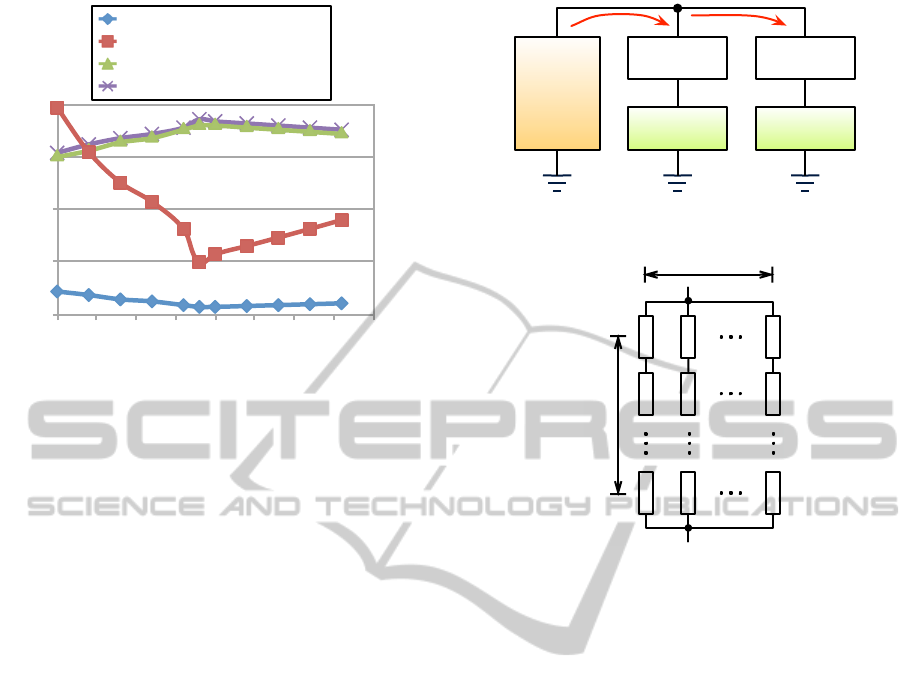
Power loss (mW)
Voltage di↵erence (V
in
V
out
)
0
25
50
75
100
-1.5 -1.0 -0.5 0 0.5 1.0 1.5 2.0 2.5
Power loss at 10 mA output
Power loss at 100 mA output
Efficiency at 10 mA output
Efficiency at 100 mA output
Efficiency (%)
100
75
50
25
0
Figure 2: The efficiency and power loss of buck-boost dc-
dc converter when the output voltage is 3.3V (Texas Instru-
ments, 2012).
dissipated in the converter since supply voltage and
current of a load are assumed to be 1.8V and 100mA,
respectively in this example.
If we can change the output voltage of the energy
generator somehow into 2.1V, the power loss in the
converter can be reduced from 44.4mW to 13.5mW.
This is more than 13.7% (= (44.4-13.5)/(44.4+180))
reduction in the total power consumption.
Now we assume that the energy generator is a PV
cells array. A single PV cell is assumed to follow the
MPP to maximize the power generation in this paper.
This is because the decreasing power slope in a PV
cell is generally much deeper than the increasing effi-
ciency slope in a DC-DC converter. This means that
following MPP always results in the maximum power
generation. According to Figure 1, the output volt-
age of the single PV cell is roughly 0.5V. Therefore,
we can make 2.0V by connecting each cell in series or
parallel connection. The m×n configuration is shown
in Figure 4. This is one of the key ideas in (Braun-
stein, 1981).
However, recent embedded systems contain more
than one supply voltage. Figure 3 shows a typical
embedded system. A and B will use different sup-
ply voltages, and the number of components will be
more than one. In this system we need to consider
the power consumption of each consumer component
since the power loss in the DC-DC converter strongly
depends on its output current. More specifically, a
higher output current results in a larger power loss in
the converter. Therefore, if there are multiple loads
which use different supply voltages in a target system
as shown in Figure 3, the total power loss in DC-DC
converters can be reduced by considering all power
DC-DC
converter
DC-DC
converter
A B
Energy
generator
Figure 3: A embedded system of PV cells.
m
n
Figure 4: The (m,n) array matrix.
consuming loads. This is the key difference from the
previous work.
For example, if A using a 1.8V voltage supply con-
sumes 100mA and B using a 5.0V supply consumes
1mA, the DC-DC converter dedicated for A wastes
39.9mW and that for B dissipates 0.6mW when the
output voltage of the power source is 5.08V. The to-
tal power loss in the DC-DC converters is 40.5mW
in this case. However, if the output voltage of the
power source is set to 2.0V, the total power loss can
be reduced to 22.4mW since the converter for B dis-
sipates only 2.3mW and the converter for A dissipates
20.2mW. This means that the power loss in the con-
verters can be reduced by 45% (= (40.5-22.4)/40.5) by
appropriately setting the output voltage of the power
source. We can see that even the converter widely
steps up the voltage from 2.0V to 5.0V, the effect also
may be small if the current is small. On the other
hand, if A and B consume 10mA and 80mA, respec-
tively, the dedicated DC-DC converter for A dissipates
only 2.0mW when the output voltage of the power
source is set to 2.0V. However, the DC-DC converter
of B dissipates 183.1mW for boosting up the voltage
from 2.0V to 5.0V. In this case, choosing a 5.08V as
the output voltage of the power source is much bet-
ter solution than choosing 2.0V (only total 51.4mW
dissipation in this situation).
The example described above shows that the volt-
age selection for the output voltage of the power
ADYNAMICRECONFIGURATIONTECHNIQUEFORPVANDCAPACITORARRAYSTOIMPROVETHE
EFFICIENCYINENERGYHARVESTINGEMBEDDEDSYSTEMS
177
DC-DC
DC-DC
DC-DC
DC-DC
Charger
L
1
L
2
L
i
(m
pv
,n
pv
)
PV
Cap(m
c
,n
c
)
SW1
SW2
SW3
V
junc
Figure 5: The proposed system blockdiagram.
source with taking the power consumptions in the
loads has a strong impact on the power losses in the
DC-DC converters. However, previous techniques do
not consider the variety of power consumptions in
multiple loads.
4 OUR APPROACH
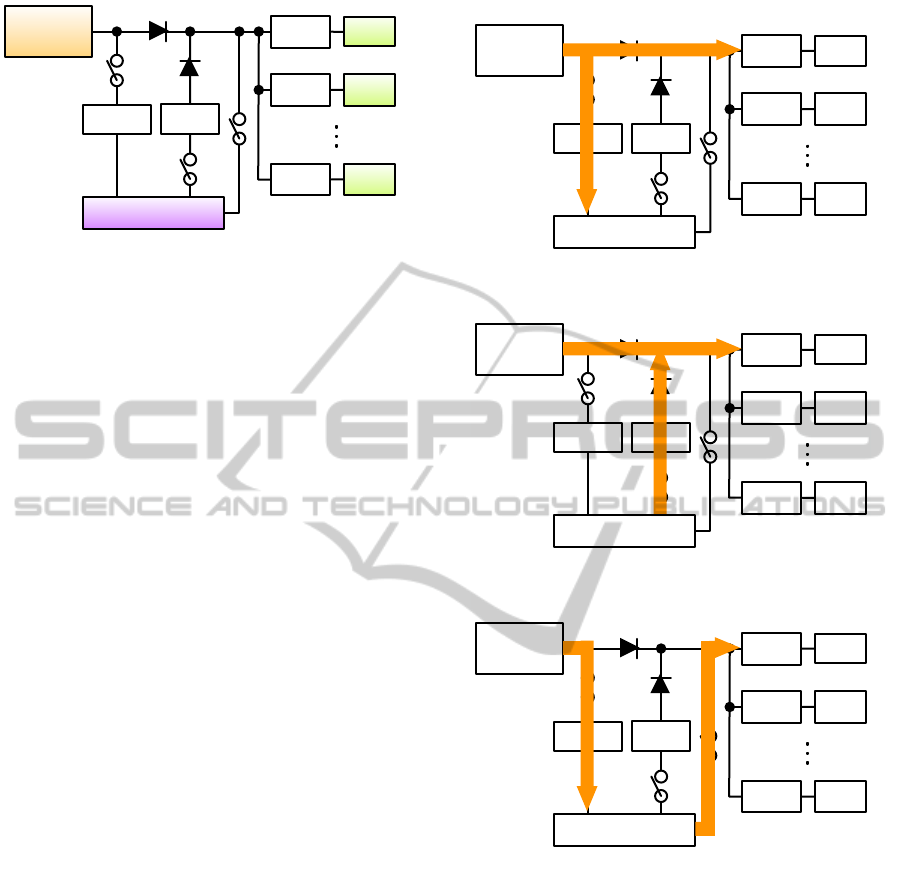
4.1 Proposed System Architecture
Our proposed system block diagram is presented in
Figure 5. The proposed system contains a PV array, a
supercapacitor array, a supercapacitor charger, a DC-
DC converter for a supercapacitor array, three load
components and its DC-DC converters, three switches
and two diodes.
The PV/supercapacitor array has many small
cells, and their series-parallel connection can be dy-
namically changed. The configuration (m,n) should
be balanced because the size of each cell is same (Fig-
ure 4). As an example, four cells can be connected
(4,1), (2,2) or (1,4) only. The number of possible con-
figuration is the same as the number of common divi-
sor. The number of possible configuration for four
cells is three because 4 = 2
2
(2 + 1 = 3). As an-
other example, twelve cells can make six configura-
tions (12 = 2
2
×3 this means (2 + 1) ×(1 + 1) = 6).
This configuration is controlled by switches, and dy-
namic reconfiguration is possible at the running time.
Each load component has a different supply volt-
age and a different power consumption. The output of
a PV array and a supercapacitor array has wide range
because of the configuration or the environment. To
make adjustable, all DC-DC converter is buck-boost
type converter. If a L
i
(i-th load) requires a supply
voltage of V
L
i
, a Conv
i
(a DC-DC converter of L
i
) will
generate V
L
i
. It is similar to the Char
cap
(supercapac-
itor charger) and the Conv
cap
(supercapacitor DC-DC
converter).
The purpose of the diode is implementing a multi-
DC-DC
DC-DC
DC-DC
DC-DC
Charger
L
1
L
2
L
i
(m
pv
,n
pv
)
PV
Cap(m
c
,n
c
)
SW1
SW2
SW3
DC-DC
DC-DC
DC-DC
DC-DC
Charger
L
1
L
2
L
i
(m
pv
,n
pv
)
PV
Cap(m
c
,n
c
)
SW1
SW2
SW3
(a) Good harvest mode
(b) Hybrid mode
(c) Bad harvest mode
DC-DC
DC-DC
DC-DC
DC-DC
Charger
L
1
L
2
L
i
(m
pv
,n
pv
)
PV
Cap(m
c
,n
c
)
SW1
SW2
SW3
V
junc
= V
MPP
V
junc
= V
Cap
V
junc
= V
MPP
Figure 6: The operating mode in the proposed system.
source power system in case that the output power
of PV array is not enough for the consumer com-
ponents. We can maintain MPP in the PV array by
setting the output voltage of Conv
cap
to the voltage
of MPP. However, the power dissipation in the nor-
mal diode demands lots of power due to its forward
voltage drop. Even though it is a Schottky diode, it
has 0.5V forward voltage drop. As a solution for this
problem, we use an ideal diode from Linear Technol-
ogy (Linear Technology, 2012) in our proposed de-
sign.
The system operation is changed in three modes
by the sunlight strength and the power consumption
behavior. If the sunlight is enough to generate the
SMARTGREENS2012-1stInternationalConferenceonSmartGridsandGreenITSystems
178

power consumption of the loads, the remaining power
is needed to charge to the supercapacitor. In this case
SW1 is turned on, and SW2 and SW3 are turned off
(Figure 6(a)). The amount of charging current is con-
trolled by an energy management system (EMS) to
keep the PV array in MPP, and so the input voltage
of the load DC-DC converters is V
MPP
. EMS should
monitor the status of system components in all the
time. This is the first operating mode; good harvest
mode. The second mode; hybrid mode is that the sun-
light is not enough to cover the power consumption
of the loads. In this case SW1 and SW3 are turned
off, and SW2 is turned on (Figure 6(b)). The output
voltage of the Conv
cap
is set to the voltage of MPP to
keep the PV array in MPP, and so the input voltage of
the load DC-DC converters follows V
MPP
. The power
is supplied by the PV array and the supercapacitor ar-
ray at the same time. Only the necessary amount of
power will be automatically supplied from the super-
capacitor array because of the diode and the output
voltage of Conv
cap
. The last third mode is bad har-
vest mode. If the sunlight is very low, the power loss
in the Conv
cap
may be more than the amount of gener-
ated power from the PV array. In this case, EMS turns
on SW1 and SW3, and it turns off SW2 (Figure 6(c)).
The output voltage of the PV array is V
MPP
to max-
imize the generated power, and the input voltage of
the load DC-DC converter is V
cap
. The power is di-
rectly supplied by the supercapacitor array without a
DC-DC converter.
4.2 Component Modeling
We assume that there is no power loss in switch and
diode. Also, we assume that there is no characteristic
changing when the PV or supercapacitor array con-
figuration is changed. As an example, if we make a
(m,n) connection of PV cells, the output voltage will
be n times of the single cell output voltage, and the
output current will be m times of the single cell cur-
rent. Similarly, a (m,n) connection of supercapacitors
will be n times of the single supercapacitor output
voltage with m/n times of the single supercapacitor
capacity.
A power converter is to deliver regulated voltage
or current at a desired level regardless of a variation
in the input power source and/or the load device. The
efficiency of a common buck converter or boost con-
verter is related by i) output current, ii) input voltage
and iii) output voltage. However, recent high efficient
buck-boost converter such as TPS63030 (Texas In-
struments, 2012) from TI changes its operation mode
by an operation situation. As a result, this converter
will maintain almost same efficiency at the range of 1
to 100 mA output current, and its efficiency is almost
only affected by the input and output voltage differ-
ence. In this paper, we assume that all the converter
efficiency (including supercapacitor charger) can be
achieve by the following equation. This equation is
estimated from the datasheet of TPS63030.
1 5 V
in
5 7.5
0 5 V
out
5 7.5
x = V
in
−V
out
η
converter
(V
in
,V
out
) =
0.213x
3
+ 1.34x
2
+ 9.23x + 89.2 : x < 0.3
−2.67x + 93.5 : x = 0.3
(1)
The buck mode and boost mode is changed by
0.3V difference. If the voltage difference is smaller
than 0.3V, the converter operates in boost mode, and
the converter operates in buck mode in the other case.
4.3 The Proposed Algorithm
The power loss in a converter is defined by
P
loss
= P
in
−P
out
. (2)
Also, the converter efficiency is
η =
P
out
P
in
. (3)
From the equation (2) and (3) the power loss in a con-
verter can be expressed by
P
loss
= P
out
×(
1
η
−1) (4)
= P
in
×(1 −η). (5)
The pseudocode of the proposed algorithm is pre-
sented in Figure 7. The proposed algorithm does not
decide the operating point of the PV array. However
the voltage point is decided by MPPT algorithm. The
amount of charging current to the supercapacitor ar-
ray is also decided by MPPT algorithm. This MPPT
algorithm can be any technique such as perturb and
observe, incremental conduction, etc. The proposed
algorithm will be used in EMS, which monitors the
entire system. The output of the proposed algorithm is
the configuration of the PV/supercapacitor array and
the switch control.
We first calculate the power consumption of the
loads including the power loss of its DC-DC convert-
ers (line 5). If the sunlight is enough to charge, we
will consider it as good harvest mode that will make
the system to charge energy to the supercapacitor ar-
ray (line 6-12). If the generated power is not enough,
we should decide the operation mode between hybrid
ADYNAMICRECONFIGURATIONTECHNIQUEFORPVANDCAPACITORARRAYSTOIMPROVETHE
EFFICIENCYINENERGYHARVESTINGEMBEDDEDSYSTEMS
179

Input: V
MPPT
: optimal voltage decided by MPPT
S
cap
: SoC of single supercapacitor
P(L
i
): power consumption in L
i
component
Output: m
c
, n
c
: supercapacitor array configuration
m
pv
, n
pv
: PV array configuration
SW : SW1, SW2 and SW3 system switch on/off
1. SW ←(1,0,0)
2. P
pv
← PV generating power by MPPT
3. P
loss
← ∞
4. for each configuration of PV and supercapacitor array
5. P
load
←
∑
(P
L
i
×(1/η
L
i
))
6. if P
pv
= P
load
then
7. P
temp
← P
load
+ (P
pv
−P
load
)(1 −η
charger
)
8. if P
loss
> P
temp
then
9. P
loss
← P
temp
10. SW ← (1, 0, 0)
11. (m
c
,n
c
,m
pv
,n
pv
) ←current configuration
12. end if
13. else then
14. P
caploss
← (P
load
−P
pv
)(1/η
Conv
cap
−1)
15. if P
pv
> P
caploss
then
16. P
temp
← P
load
+ (P
load
−P
pv
)(1/η
Conv
cap
−1)
17. if P
loss
> P
temp
then
18. P
loss
← P
temp
19. SW ← (0, 1, 0)
20. (m
c
,n
c
,m
pv
,n
pv
) ←current configuration
21. end if
22. else then
23. P
temp
← P
load
+ P
pv
(1 −η
charger
)
24. if P
loss
> P
temp
then
25. P
loss
← P
temp
26. SW ← (1, 0, 1)
27. (m
c
,n
c
,m
pv
,n
pv
) ←current configuration
28. end if
29. end if
30. end if
31. end for
32. Return (m
c
,n
c
,m
pv
,n
pv
) and SW.
Figure 7: Pseudocode of the configuration algorithm.
mode and bad harvest mode. The power loss in the
Conv
cap
may be more than the amount of generated
power from the PV array, and it will be better to sup-
ply directly by the supercapacitor array without the
power loss in the Conv
cap
. To decide the operation
mode, we first assume hybrid mode, and we calculate
the power loss in the Conv
cap
(line 14). If the power
loss in the Conv
cap
is smaller than the generated
power from the PV array, the system will operate in
hybrid mode (line 15-21). If it is larger than the gen-
erated power, the system will operate in bad harvest
mode (line 22-28). We will compare the total power
loss in all the possible configuration cases, and then
decide the optimal setting for the PV/supercapacitor
array and the control of switches.
5 EXPERIMENTS AND RESULTS
5.1 Experimental Setup
We use three electronic components as a load. A
CPU operates in 1.2V with 100mA consumption, a
memory operates in 3.3V with 30mA consumption
and a RF amplifier for WCDMA operates in 5V with
100mA consumption. The PV array is composed with
twelve cells, and the supercapacitor array has six 1F
supercapacitors. The number of possible configura-
tion is 24 because the PV array has 6 possible con-
figurations, and the supercapacitor array has 4 possi-
ble configurations, as we already present the counting
method in Section 4.1. One PV cell generates 41mW
(81.8mA, 0.5V) in 100% sunlight strength.
We use two systems as a baseline. One is a MPPT
system with a 490.8mW PV array (81.8mA, 6V, same
as a PV(1,12) array) and a 2 series connection with 6F
capacitor (same as a C(3,2) array). This MPPT sys-
tem will not change the PV/supercapacitor array con-
figuration, and the output voltage of single PV cell is
the same as that of the proposed system. The other
is a MPTT system with the same PV/supercapacitor
array of the MPPT system. This means the MPPT
and MPTT system will maintain the (3,2,1,12) con-
figuration all the time. The MPTT system is target-
ing to reduce the power loss in the supercapacitor
charger only because it does not consider the power
loss at the load DC-DC converter. One different thing
from the proposed system and the MPPT system is
that the PV array operation point in the MPTT sys-
tem will be changed to maximize P
charge
. The gen-
erated power (P
pv
) will be decreased by changing the
operating point. However the supercapacitor charger
efficiency may increase in the MPTT system.
We will show the result of 10 selected cases,
which are shown in Table 1. Each case contains the
power consumption of the load, sunlight strength and
a state-of-charge (SoC) of the supercapacitor. We do
not include 0% sunlight strength case because MPPT
and MPTT can optimize nothing in this case.
5.2 Results
First, we show an accumulated bar by the power
loss of each converter in Figure 8. We can see
that (2,3,2,6) configuration has the lowest power loss
among the cases. There is a configuration that has the
lowest power loss in one converter, yet it is not mean
that the total power loss is the lowest. The total power
loss may be the lowest, even though a power loss in
one converter is larger than the other configuration.
This means we should consider the power loss in the
SMARTGREENS2012-1stInternationalConferenceonSmartGridsandGreenITSystems
180
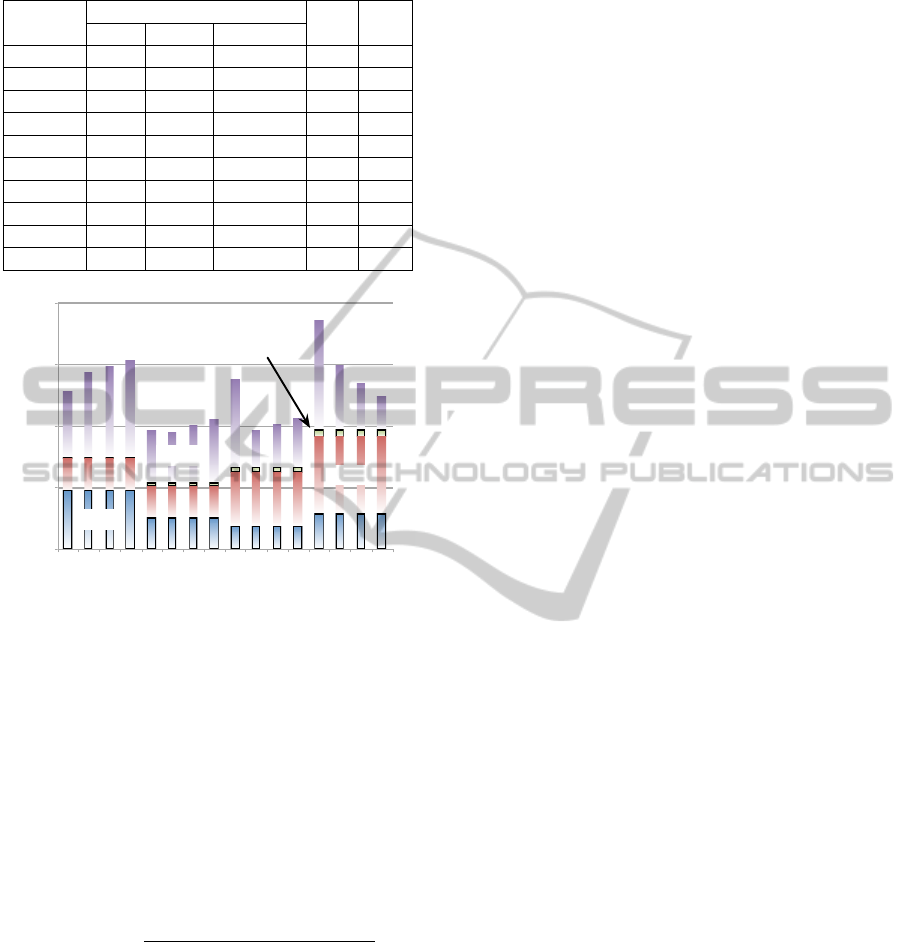
Table 1: Selected cases for the experimental result.
Current (mA) Sun S
cap
No.
CPU Mem. RF Amp. (%) (%)
Case 1 1 1 1 100 20
Case 2 1 1 1 100 40
Case 3 1 1 1 100 60
Case 4 1 1 1 100 80
Case 5 100 30 1 50 20
Case 6 100 30 1 50 80
Case 7 100 30 1 100 40
Case 8 1 30 100 50 20
Case 9 1 30 100 50 40
Case 10 1 30 100 50 80
Power loss (mW)
(1,6,1,12)
0
30
60
90
Configuration (m
c
,n
c
,m
pv
,n
pv
)
(2,3,1,12)
(3,2,1,12)
(6,1,1,12)
(1,6,2,6)
(2,3,2,6)
(3,2,2,6)
(6,1,2,6)
(1,6,3,4)
(2,3,3,4)
(3,2,3,4)
(6,1,3,4)
(1,6,6,2)
(2,3,6,2)
(3,2,6,2)
(6,1,6,2)
120
CPU
Mem.
RF Amp.
Charg.
Figure 8: The power loss in each converter in one case by
the configuration (CPU, Mem. and RF amplifier module
consume 100, 30, 1 mA. Sun 100% and S
cap
=20%.
system all together.
Table 2 shows the result of the selected cases. The
alphabet in Oper. mode column shows the operation
mode; G: good harvest mode, H: hybrid mode and B:
bad harvest mode. The Red. means the reduction ra-
tio, and it is calculated by the following equation
Red.(system) =
P
loss
(MPPT ) −P
loss
(system)
P
loss
(MPPT )
. (6)
In all cases, the MPTT cannot achieve more than
1% reduction comparing the MPPT system. There-
fore, we just show one case result for the MPTT. This
is because we assume i) small size of PV cell and
ii) a high efficiency in the supercapacitor charger. A
small size of PV cell and a high efficiency charger
will make hard to move the operating point in the PV
array. Even If the operating point is slightly changed,
the generating power from PV array will highly de-
crease. At the same time the efficiency of charger
is not changed much to compensate the decreasing
amount of generated power. Therefore, the MPTT is
almost same as the MPPT in our design.
We can see that the operation mode is changed
by the load profile, a supercapacitor SoC or sunlight
strength changing. Case 5 and Case 8 show the situ-
ation of load profile changing, and Case 7 and Case
9 show the situation of sunlight strength changing.
Case 8, Case 9 and Case 10 clearly show the situation
of direct discharging from the supercapacitor array.
Although there is sunlight, we cannot use the gener-
ated power directly by a system situation to maintain
MPP. The generated power from the PV array should
be charged to the supercapacitor array, and the load
component should be directly supplied by the super-
capacitor array. This reduces the total power loss in
this case.
6 CONCLUSIONS
This paper presents a generalized technique for op-
timizing the series-parallel connections of PV array
and supercapacitor array with considering the power
consumptions in multiple loads which use different
supply voltages as well as the power dissipated in the
corresponding DC-DC converters. The output of the
proposed algorithm is the control of the power path
switch and the configuration of the PV/supercapacitor
array in the proposed system. The configuration of
PV array should be dynamically changed when the
system status is changed. The supercapacitor array
can be a source or load in the system by supercapac-
itor converter and charger. This means even in the
same operating condition, the configuration of PV ar-
rays and supercapacitor array need to be changed by
the SoC of supercapacitor.
While conventional MPPT maximizes the solar
cell output power without considering the power loss
in the DC-DC converter and charger when there are
multiple loads, we consider the power loss and in-
troduce a dynamic reconfiguration of PV arrays and
supercapacitor arrays. Also, our proposed technique
can be used with any kind of MPPT techniques.
Our proposed technique will increase the reliabil-
ity of the system without increasing a PV array or an
energy storage. The proposed technique increases the
transferring efficiency by minimizing the total power
loss in the converters.
ACKNOWLEDGEMENTS
This work is supported by JSPS NEXT program un-
der grant number GR076.
ADYNAMICRECONFIGURATIONTECHNIQUEFORPVANDCAPACITORARRAYSTOIMPROVETHE
EFFICIENCYINENERGYHARVESTINGEMBEDDEDSYSTEMS
181
Table 2: Selected experimental results.
Configuration Oper. Converter power loss (mW) Red.
Case
(m
c
,n
c
,m
pv
,n
pv
) mode CPU Mem. RF Amp. Charg. Conv
cap
Total (%)
MPPT 0.3 0.5 0.5 95.3 - 96.6 -
Case 1 MPTT G 0.3 0.5 0.5 95.0 - 96.3 0
Proposed (2,3,3,4) 0.1 0.9 2.4 37.4 - 40.8 58
MPPT 0.3 0.5 0.5 82.5 - 83.8 -
Case 2
Proposed (3,2,2,6)
G
0.2 0.5 1.7 43.9 - 46.3 45
MPPT 0.3 0.5 0.5 69.6 - 71.0 -
Case 3
Proposed (6,1,3,4)
G
0.1 0.9 2.4 37.4 - 40.8 42
MPPT 0.3 0.5 0.5 56.8 - 58.1 -
Case 4
Proposed (6,1,2,6)
G
0.2 0.5 1.7 43.9 - 46.3 20
MPPT 28.7 15.7 0.5 - 29.0 74.0 -
Case 5
Proposed (1,6,2,6)
H
15.3 15.4 1.7 - 2.0 34.4 54
MPPT 28.7 15.7 0.5 - 10.0 54.9 -
Case 6
Proposed (3,2,2,6)
H
15.3 15.4 1.7 - 1.7 34.1 38
MPPT 0.3 15.7 50.5 - 116.8 183.3 -
Case 7
Proposed (1,6,1,12)
H
0.3 15.7 50.5 - 21.3 87.8 52
MPPT 0.2 37.6 332.1 47.6 - 417.5 -
Case 8
Proposed (1,6,2,6)
B
0.2 15.4 172.1 25.9 - 213.5 49
MPPT 0.1 26.3 237.3 41.2 - 304.9 -
Case 9
Proposed (1,6,1,12)
B
0.3 15.7 50.5 25.9 - 92.4 70
MPPT 0.2 9.0 116.5 28.4 - 154.2 -
Case 10
Proposed (2,3,1,12)
B
0.3 15.7 50.5 25.9 - 92.4 40
REFERENCES
Braunstein, A. (1981). On the dynamic optimal coupling of
a solar cell array to a load and storage batteries. Power
Apparatus and Systems, IEEE Transactions on, PAS-
100(3):1183 –1188.
Brunelli, D., Dondi, D., Bertacchini, A., Larcher, L., Pa-
van, P., and Benini, L. (2009). Photovoltaic scaveng-
ing systems: Modeling and optimization. Microelec-
tronics Journal, 40(9):1337 – 1344.
Choi, Y., Chang, N., and Kim, T. (2007). Dc-dc converter-
aware power management for low-power embedded
systems. Computer-Aided Design of Integrated Cir-
cuits and Systems, IEEE Transactions on, 26(8):1367
–1381.
Esram., T., Kimball, J., Krein., P., Chapman, P., and Midya,
P. (2006). Dynamic maximum power point tracking
of photovoltaic arrays using ripple correlation control.
Power Electronics, IEEE Transactions on, 21(5):1282
–1291.
Hohm, D. and Ropp, M. (2000). Comparative study of
maximum power point tracking algorithms using an
experimental, programmable, maximum power point
tracking test bed. In Proceedings of Photovoltaic Spe-
cialists Conference 2000, pages 1699 –1702.
Kim, Y., Chang, N., Wang, Y., and Pedram, M. (2010).
Maximum power transfer tracking for a photovoltaic-
supercapacitor energy system. In Proceedings of
IEEE/ACM International Symposium on Low Power
Electronics and Design (ISLPED), pages 307–312.
Kim, Y., Park, S., Wang, Y., Xie, Q., Chang, N., Poncino,
M., and Pedram, M. (2011). Balanced reconfiguration
of storage banks in a hybrid electrical energy storage
system. In Proceedings of the 2011 IEEE/ACM inter-
national conference on Computer-aided design (IC-
CAD), pages 624–631.
Linear Technology (2012). LTC4413 datasheet. http://
www.linear.com/product/LTC4413.
Rong, P. and Pedram, M. (2002). Battery-aware power
management based on markovian decision processes.
In Proceedings of the 2002 IEEE/ACM interna-
tional conference on Computer-aided design (IC-
CAD), pages 707–713, New York, NY, USA. ACM.
Simjee, F. and Chou, P. (2006). Everlast: Long-life,
supercapacitor-operated wireless sensor node. In Pro-
ceedings of IEEE/ACM International Symposium on
Low Power Electronics and Design (ISLPED), pages
197 –202.
Texas Instruments (2012). TPS63030 datasheet. http://
www.ti.com/lit/ds/symlink/tps63030.pdf.
Towada Solar Co. LTD. (2012). TS410M datasheet. http://
www.towada-gp.com/solar/.
Uno, M. (2009). Series-parallel reconfiguration technique
for supercapacitor eneryg storage systems. In Pro-
ceedings of TENCON 2009 - 2009 IEEE Region 10
Conference, pages 1 –5.
SMARTGREENS2012-1stInternationalConferenceonSmartGridsandGreenITSystems
182
