
REAL-TIME NON-INTRUSIVE APPLIANCE LOAD MONITOR
Feedback System for Single-point per Appliance Electricity Usage
Tuomo Alasalmi, Jaakko Suutala and Juha R¨oning
Department of Computer Science and Engineering, University of Oulu, Erkki Koiso-Kanttilan katu 3, Oulu, Finland
Keywords:
Single-point Sensing, Pattern Recognition, Machine Learning, Energy Efficiency, Context-awareness, Smart
Home.
Abstract:
External single-point appliance load monitoring gives detailed information about appliance electricity use
without expensive or intrusive installation. This is vital for a wide distribution of practical solutions. Current
research has focused on improving the load disaggregation algorithms, whereas consumers would benefit most
from a good feedback system, even if the energy usage estimates are not perfect. A good feedback system can
motivate consumers to save energy from 10% to 15%. In an ongoing project on energy efficient living at the
University of Oulu, we have developed a real-time application using a non-intrusive appliance load monitoring
algorithm. The algorithm is based on thresholding, kNN-classifier, and on-and-off event matching. Accuracy
of the developed system is in line with other similar work and provides a real-time operation. In a test setting,
events were detected with 96.1% accuracy and the total energy estimate differed from the actual consumption
by 11.3%. With such a solution, consumers can easily see the energy used by different appliances and can
make energy saving decisions because they can see the effects of their actions immediately. This kind of
technologies will play a key role if ever increasing energy saving targets set by international contracts are to
be met.
1 INTRODUCTION
Climate change is already happening and represents
one of the greatest environmental, social and eco-
nomic threats facing the planet. For example, in US
households consume 21% of nation’s energy produc-
ing 20% of CO
2
emissions, as well as use half of the
publicly supplied water (Froehlich et al., 2009).
It is stated in an European Union directive that
Member States shall aim to achieve an overall na-
tional energy savings target of 9% by the year 2016
(Commission et al., 2006). Therefore, developing a
technology for making consumers aware of their en-
ergy consumption habits is of great importance if this
goal is to be reached. This among other investments
in energy saving technology and renewable energy
production could also have a positive impact on the
financial status of the countries involved. In this sec-
tor, there is an abundance of possibilities for European
countries to aim at the top of competition as providers
of clean future technologies.
In an ongoing project here in the Department of
Computer Science and Engineering of University of
Oulu in association with Tokyo University of Agri-
culture and Technology, we have been developing an
interactive context-aware sensor-based feedback and
control system to support energy efficient housing.
The aim of the system is to motivate inhabitants to be
aware of their energy consumption habits and make
decreasing energy costs easier. In a long run, this
leads to a more efficient use of energy resources for
living in the whole society.
Typically, consumers are unaware of their energy
consumption such as electricity consumption of dif-
ferent household appliances. It is common to get an
electric bill only a few times a year. This kind of
feedback as such is not helpful, especially because the
consumers only see the total energyused. To motivate
consumers to actually save energy, they must be made
aware of the energy consumption amounts of certain
appliances or appliance groups. They must also be
made aware of the times when those appliances are
used and the amount of energy those appliances are
using. With this kind of accurate information, es-
pecially if the information is real-time, it is easier
to make energy saving decisions. Raw energy con-
sumption statistics might not be as motivating as see-
ing the same figures in price estimates. According to
Matthews (Matthews et al., 2008), a reduction of 10 to
15% might be possible with feedback related to elec-
203
Alasalmi T., Suutala J. and Röning J..
REAL-TIME NON-INTRUSIVE APPLIANCE LOAD MONITOR - Feedback System for Single-point per Appliance Electricity Usage.
DOI: 10.5220/0003951802030208
In Proceedings of the 1st International Conference on Smart Grids and Green IT Systems (SMARTGREENS-2012), pages 203-208
ISBN: 978-989-8565-09-9
Copyright
c
2012 SCITEPRESS (Science and Technology Publications, Lda.)
tricity consumption. With a real-time system showing
the disaggregated per appliance consumption figures,
the potential savings may even increase.
Appliance load monitoring refers to techniques
that measure individual appliance electrical loads ei-
ther directly or indirectly. For consumer applications,
indirect estimation of electrical loads is usually the
most practical way if several appliances are to be
monitored. Typically, such a system’s development
focuses on providing an even better accuracy of dis-
aggregation of individual appliances from a total load
measured at the breaker panel or the main cord, com-
pared to previous research. This allows users to see
which appliances have used the most energy and help
them to make better energy saving decisions in the
future. Having this information in real-time provides
even more useful feedback to the users, and most im-
portantly, they can see the effects of their actions im-
mediately and react accordingly.
We use single-point sensing of aggregated appli-
ance power consumption to determine individual ap-
pliance consumption. Noise and the lack of resolution
in the measurements make the use of machine learn-
ing and pattern recognition techniques (Bishop, 2006)
a rational choice to address this problem.
Here in the Department of Computer Science and
Engineering of University of Oulu, we have devel-
oped a low cost system that is operating in real-time
and is able to infer which appliances or appliance
groups are turned on or off during operation. It works
by feeding real-time measurement data to the event
detection algorithm. It also calculates estimates of
energy consumption of each appliance or appliance
group in both energy used and price in Euros. With
this system, the consumers can see in real-time how
the use of different appliances affects the energy us-
age figures and cost. They can then make informed
decisions to save energy where possible and see the
effects of their decisions immediately. The developed
prototype system uses only one sensor to make instal-
lation very easy and as non-intrusive and as cheap as
possible. These features make it a practical solution
for wide deployment.
The article is ordered as follows: in Section 2, a
background for non-intrusive appliance load monitor-
ing in general is briefly discussed. In Section 3, meth-
ods used in the developed real-time system are pre-
sented. Experiments run with the system are then pre-
sented in Section 4 and the specifics of the developed
Real-Time Appliance Load Monitor software are dis-
cussed in Section 5. Finally, Section 6 concludes the
article.
2 LOAD DISAGGREGATION
METHODS
Groundwork for non-intrusive appliance load moni-
toring (NIALM) research was done in the 80’s and
early 90’s. Pioneer work of the field was presented in
(Hart, 1992). In this breakthrough article the meth-
ods still used today in NIALM systems are described.
Recently methods such as detecting the electromag-
netic interference (EMI) of appliances (Gupta et al.,
2010) have been developed but they tend to be ex-
pensive compared to the extra value they offer over
traditional lower cost sensor based approaches. In the
next sections the most commonly used methods are
introduced.
2.1 Steady State Methods
Steady state analysis of power consumption data
refers to the methods where the power value changes
from a nearly constant value to another (Najmeddine
et al., 2008) when a certain appliance turns on or off.
In fundamental frequency steady state analysis, step
changes in power consumption, both active and reac-
tive power, are recorded and can be used as signatures.
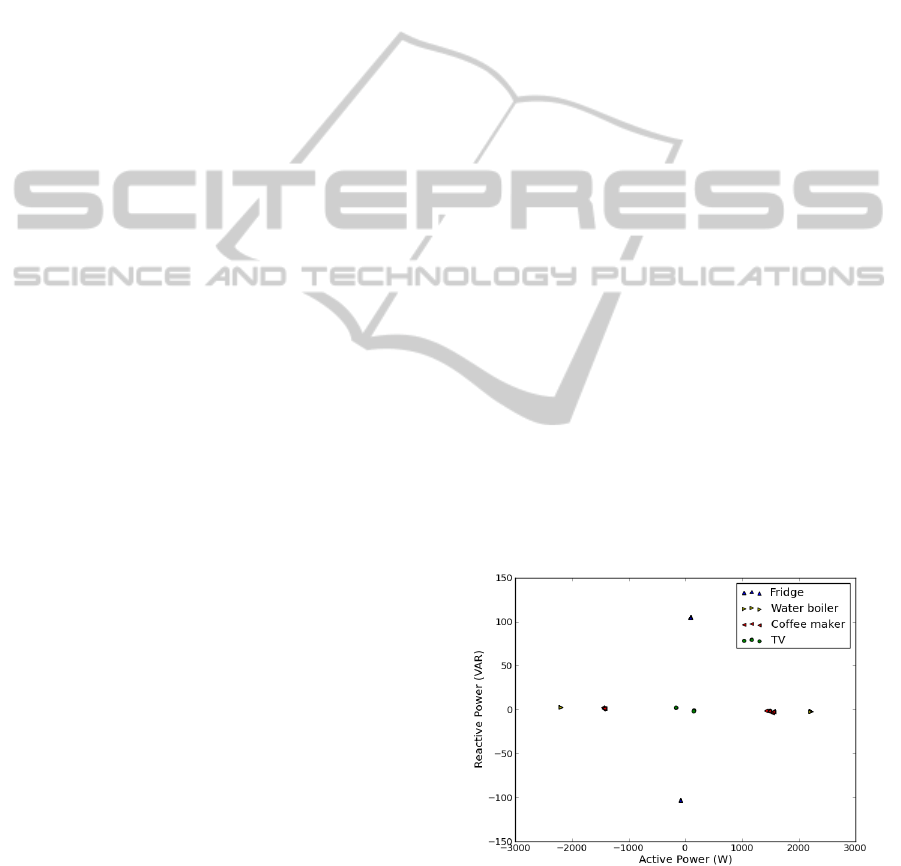
In our test setting, there are four different appliances
forming the aggregate consumption: a TV, a fridge, a
water boiler, and a coffee maker. A sample recording
from our test setting can be seen in Figure 2. The step
changes in the graph are detected and the magnitude
of those changes are used as signatures by the classi-
fier. In this case, the feature space is two dimensional
and is presented in Figure 1 using the four aforemen-
tioned appliances.
Figure 1: Feature space of the appliance signatures from a
test setting.
Power consumption values should be normalized
to take account of voltage fluctuations. This is be-
cause power line voltage and current can fluctuate
±10% so that the measured power figures can vary
SMARTGREENS2012-1stInternationalConferenceonSmartGridsandGreenITSystems
204
as much as about ±20%. Equation 1 can be used to
calculate the normalized power values. The optimal
value for β in the equation is different for different
types of appliances, but typically, a value of two is
used (Hart, 1992).
P(t)
Norm
= (
230
V(t)
)
β
P(t). (1)
In addition to fundamental frequency signatures
explained above, current harmonics can be used as
signatures as well. This is because most appliances
are not strictly linear and therefore produce detectable
currents on the odd harmonic frequencies that differ
from one appliance type to another. It might be pos-
sible, e.g., to differentiate between two small appli-
ances that are too difficult to differentiate based only
on power changes (Hart, 1992).
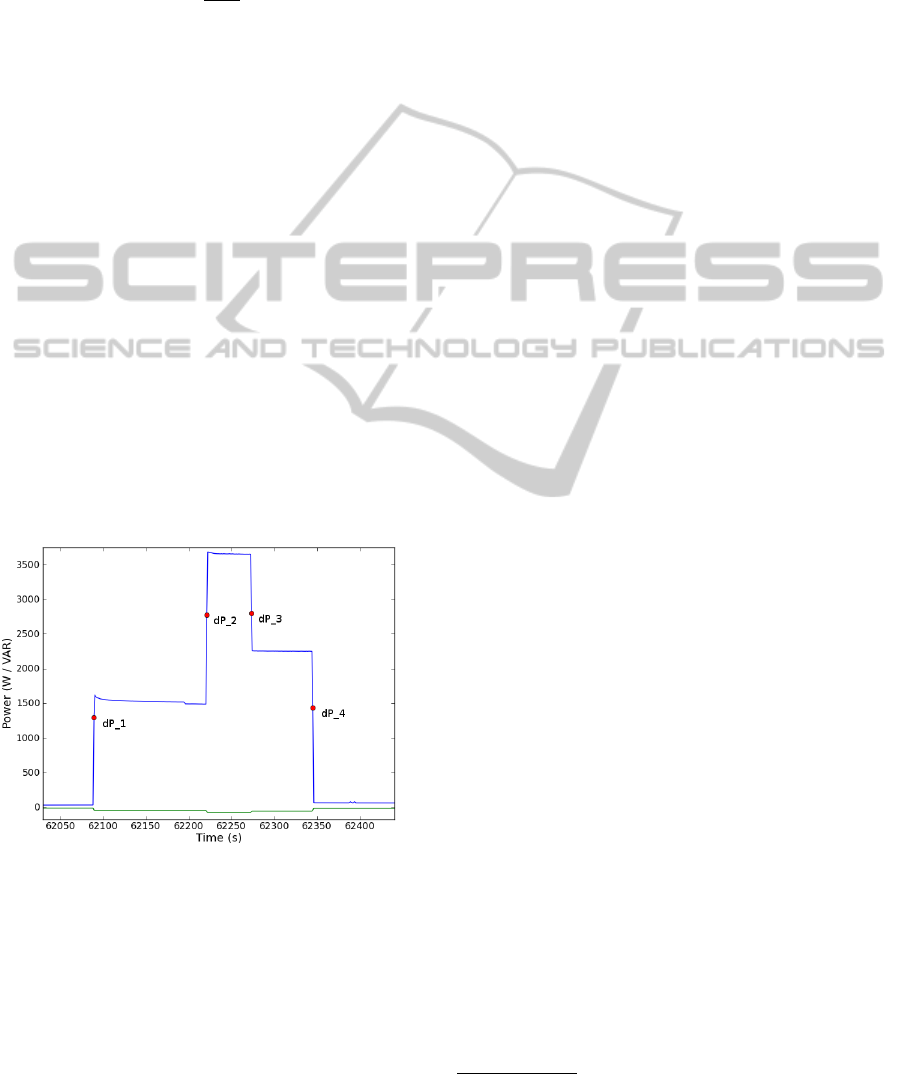
The found events are finally matched so that when
a switch-off event of some appliance is found, the
previous unmatched switch-on event of the same ap-
pliance is matched with it. The operation time of
the appliance can then be determined from the time
difference in timestamps of the events. The energy
consumption estimate can be calculated based on the
magnitude of change in the power value of the switch-
off event (Pihala, 1998). The process is illustrated in
Figure 2. In the figure, dP
1
and dP
3
are from one
appliance and dP
2
and dP
4
are from another. The al-
gorithm matches those corresponding events and esti-
mates the energy used.
Figure 2: Event matching in real-time appliance load mon-
itor.
2.2 Other Methods
If higher frequencydata is available, it is also possible
to use transient state signatures to aid identification
of appliances. Transients are of different shapes, de-
pending on the mechanism they are produced (Leeb
et al., 1995). Other transient classification criteria
are their size, duration, time constants, or parametric
values in models of waveforms (Hart, 1992). Tran-
sients are only detectable during switch-on events and
provide therefore less information than steady state
methods. Switch-off events do not produce transients;
thus, only switch-on events can be detected with tran-
sient methods (Hart, 1992).
A novel method to detect appliance use with a
single sensor has been developed by Gupta (Gupta
et al., 2010). It makes use of the electromagnetic in-
terference (EMI) signals that are unique to each appli-
ance. Others have used magnetic sensors, light inten-
sity sensors, and microphones (Kim et al., 2009) to
aid appliance identification. Also, a thermal camera
has been used (Ho et al., 2011) in trying to estimate
appliance usage.
All the above methods require more expensive and
complex sensing hardware than the steady state fun-
damental frequency measurements. For practical do-
mestic solutions, they might not yet be sensible op-
tions.
3 METHODS FOR THE
REAL-TIME APPLIANCE
LOAD MONITOR
In this work, we focus on providing a real-time, low
cost, and non-intrusive load monitoring system for
consumer households. This has influenced the selec-
tion of the used hardware and load disaggregation al-
gorithms.
Single point sensing was chosen to minimize in-
trusiveness of the system. The sensor we are using
is Plogg
1
. It is a type of sensor that is plugged into
an electric socket. This kind of sensor allows the
development of a prototype system that can be later
used as a basis for a system capable of monitoring a
whole household. The sensor has a maximum sam-
pling rate of 1Hz. This is enough if fundamental fre-
quency steady state signatures are used, but does not
allow the use of harmonics or transients as signatures.
Consumption values are fetched from the sensor
every second. These consumption values are normal-
ized according to Equation 1 to minimize distortion of
voltage and then fed to the event detection algorithm.
The event detection algorithm finds step changes in
the consumption data and extracts the steady state sig-
natures of those step changes. The event detection
algorithm is presented in Algorithm 1. The real-time
version of the algorithm differentiates from the offline
version that was presented in (Hart, 1992) in one way.
To operate in real-time, event signatures must be re-
1
http://www.plogginternational.com/
REAL-TIMENON-INTRUSIVEAPPLIANCELOADMONITOR-FeedbackSystemforSingle-pointperAppliance
ElectricityUsage
205

Algorithm 1: Event detection algorithm for the Real-Time
Appliance Load Monitor. In the algorithm, representation c
stands for current sample, ws for window size, bl for base-
line, th for threshold, and ls for the last stable baseline in-
dex.
while True do
bl ← average(data[ls : (ls+ ws)])
if max|bl − data[ls : (ls+ ws)]| < th then
break
end if
ls ← ls+ 1
end while
while application running do
if eventstarted = 0 then
if |data[c] − bl| > th then
eventstarted ← timestamp
continue
else
bl ← average(data[ls : c])
end if
else
if (c− eventstarted) ≥ ws then
avg ← average(data[(c− ws) : c])
if max|avg− data[(c− ws) : c]| < th then
if avg− bl > th then
eventqueue ← (eventstarted, avg− bl)
ls ← c
end if
eventstarted ← 0
end if
end if
end if
end while
corded right after the event has occurred. In com-
parison, the offline version takes averages of each
steady states and uses the difference of two consec-
utive steady states as signatures. Switch-on events
therefore are different in these two algorithms as we
do not have time to take the average of the whole on-
cycle to calculate the switch-on signature. These sig-
natures along with timestamps are then fed to a classi-
fier that has been trained on data from the appliances
or appliance groups that we are interested in. The
classifier then identifies to which appliance the sig-
nature belong. It uses k-nearest neighbor algorithm
(Duda et al., 2000) that finds the data point’s nearest
neighbors in training data in the feature space using
Euclidean distance as a distance metric. The class for
the data point is then chosen based on the majority
vote of the nearest neighbors’ classes. K’s value of
three was chosen based on the validation dataset to
account for the greater variance compared to the of-
fline algorithm and noise in the data while maximiz-
ing performance.
4 EXPERIMENTS
A test environment was built in the coffee room of our
department. One Plogg sensor was installed so that
every appliance in the test setup drew its power from
the socket where the sensor was plugged. In addi-
tion to that, an individual sensor was installed to each
test appliance to obtain accurate reference data. There
were four test appliances in the setup: a fridge, an old
CRT TV, a water boiler and a twin coffee maker.
Test data were collected for a total of 27 days 11
hours. The collected data were then analyzed with
an offline version of the software using the same load
disaggregation algorithm as the real-time version of
the software. A previously collected dataset with only
one appliance in the setting at a time was used as
training data. A minimum of seven on/off event pairs
was collected for each appliance’s training dataset. As
fine tuning the algorithm was not the main research
topic, the tests were only run with one set of con-
figuration values. Threshold values of 65W/15VAR
were used for the event detection triggering. A win-
dow length of three seconds was used for finding a
new stable steady state after an event. These values
were determined by experimenting with training data.
In other work (Hart, 1992), 15W/15VAR has been
used as a threshold. In this case, the measurement
noise from TV made it impossible to use such a low
threshold value. Thus, a higher threshold was selected
based on the training data. Real power was found
to more susceptible to noise than reactive power so
higher threshold value was used for real power than
for reactive power. A window size of three seconds
was used (Hart, 1992). The effect of the threshold
value used can be seen in Figure 3. With 15W/15VAR
(3(a)) threshold there are tens of false events detected
whereas with 65W/15VAR (3(b)) threshold only real
events are detected.
From the tests, two performance measures were
determined: first, energy use estimate, and second,
event detection accuracy of each appliance. The test
results are presented in Tables 1 and 2. The event de-
tection accuracy is tabulated as a confusion matrix.
The confusion matrix is based on the first two parts
of the six part test data. As seen from the results, the
event detection accuracy is excellent, whereas the en-
ergy consumption estimates could be better. A total of
382 events were detected in the analyzed dataset. Of
those events, 367 of those events were correctly clas-
sified, which makes the overall event detection accu-
racy of 96.1% for the system. Energy consumption
estimate accuracy varied from one appliance to an-
other. The largest error is seen with the TV. It was
noted that the hot plates of the coffee maker some-
SMARTGREENS2012-1stInternationalConferenceonSmartGridsandGreenITSystems
206
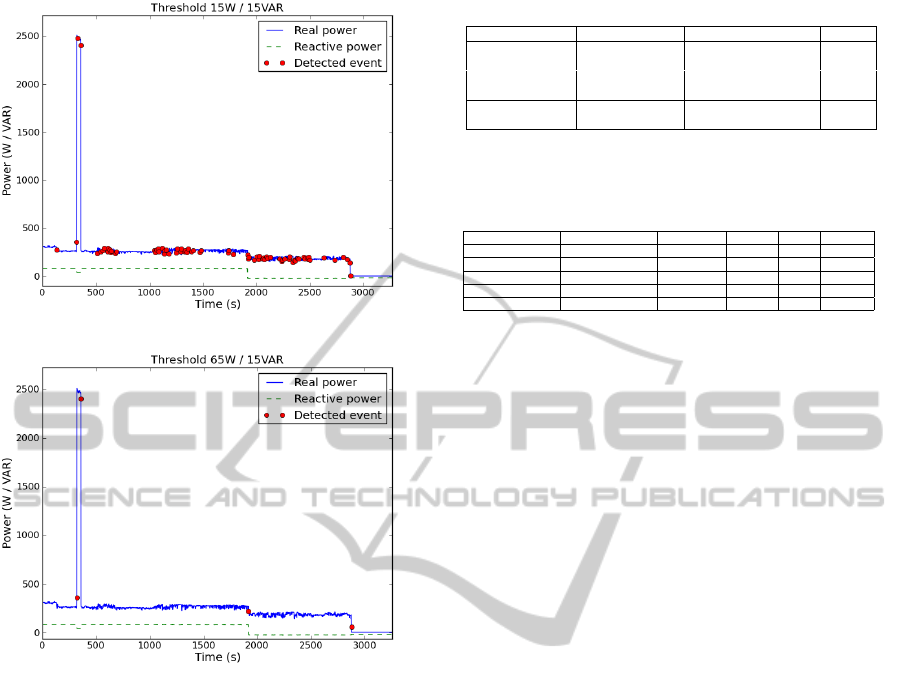
(a) Event detection with threshold with 15W/15VAR
(b) Event detection with threshold 65W/15VAR
Figure 3: Effect of threshold value selection on event detec-
tion.
times triggered an event that was classified to an event
caused by the TV. The hot plates also account for most
of the error in the coffee makers energy estimate. The
coffee maker was sometimes left on for long periods
of time and the hot plate consumption was not de-
tected by the system. The total energy estimate was
11.3% lower than the actual consumption. Ignoring
the TV, the overall energy estimate was 2.6% higher
than the actual total consumption. The results are in
line with other work in the field (Pihala, 1998).
The TV used in the test setting is extremely noisy
and makes detection of other appliances harder. In
Figure 3(a), this phenomena can be seen. The false
events affect the energy estimates and also the detec-
tion accuracy, especially regarding the TV. Neverthe-
less, the appliance class detection accuracies of the
other appliances remain high. The noise also makes it
harder to accurately detect other appliances as finding
a stable steady state before and after events is harder.
Also, the threshold value for event detection must
be raised to avoid false alarms and therefore small ap-
Table 1: NIALM system energy consumption estimates.
Appliance True consumption Estimated consumption Error-%
Twin coffee maker 10.54 kWh 8.24 kWh -21.9%
Water boiler 20.59 kWh 22.11 kWh +7.3%
CRT TV 13.90 kWh 5.44 kWh -60.9%
Fridge 18.28 kWh 20.36 kWh +11.4%
Total 63.31 kWh 56.14 kWh -11.3%
Total without TV 49.42 kWh 50.70 kWh +2.6%
Table 2: NIALM system confusion matrix for the event de-
tection algorithm. Each row represents the actual appliance
class. Each column represents the predicted appliance class.
Twin coffee maker Water boiler CRT TV Fridge No event
Twin coffee maker 55 0 0 0 1
Water boiler 1 111 0 0 0
CRT TV 0 0 13 0 0
Fridge 0 0 3 188 2
No event 0 0 8 0 -
pliances are undetectable. Additionally, one simul-
taneous event of two appliances was detected in the
analyzed dataset. This was falsely classified as the al-
gorithm does not take account for the possibility of
simultaneous events.
5 REAL-TIME APPLIANCE
LOAD MONITOR
An application capable of showing the users in real-
time the use of electrical appliances, called Real-Time
Appliance Load Monitor, was developed. The base
of the application was the NIALM algorithm, as de-
scribed in Section 3. The application shows the cur-
rent power consumption and also the total energy used
while the application was running. In addition to this,
for each appliance or appliance group, the application
shows information of the current state of the appli-
ance, its name, estimated consumption, total energy
used and the cost of the energy used by the appliance.
All detected events are shown in a text area at the bot-
tom of the application. A screenshot of the developed
application running on a Linux desktop computer can
be seen in Figure 4.
The total power consumption value is shown at the
top of the application in watts. This value is the raw
data from the sensor on any given moment rounded
to the nearest integer value for clarity. Below the
power consumption value, a total energy used while
the application was running is shown in kilowatthours
(kWh). The value can be fetched directly from the
sensor. An estimation of the cost of the total energy
used is also shown next to the total energy used figure.
A price of 0.12eper kWh is used as an estimate. In
the list of appliances, are all appliances that the sys-
tem knows of.
In the appliance or appliance group section, there
are five columns. In the first column, the current ap-
REAL-TIMENON-INTRUSIVEAPPLIANCELOADMONITOR-FeedbackSystemforSingle-pointperAppliance
ElectricityUsage
207
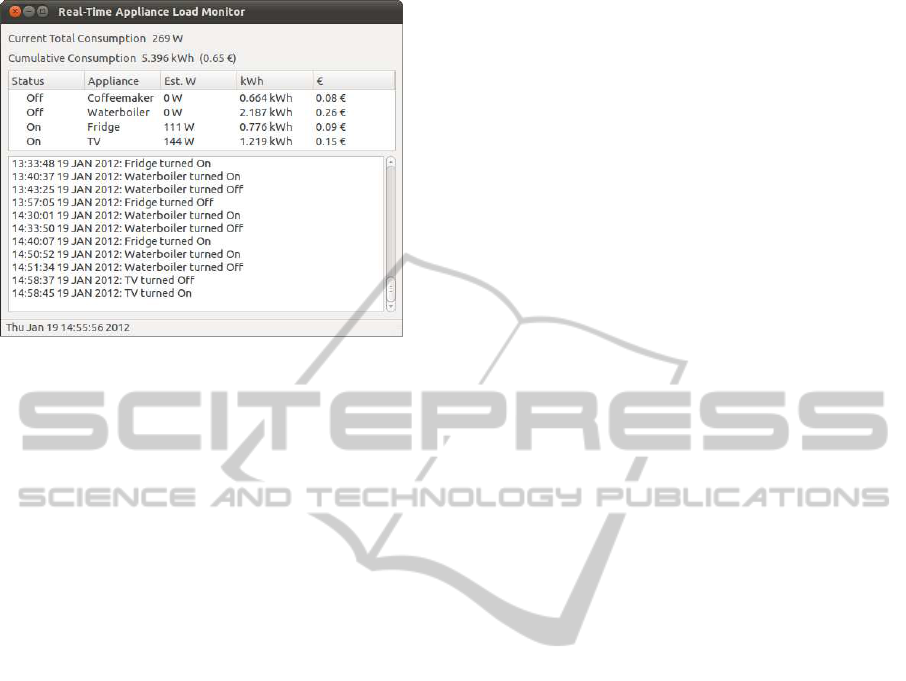
Figure 4: Graphical user interface of the developed soft-
ware.
pliance state is shown. If the state is unknown, i.e. no
events of that appliance have yet been seen, a dash is
shown. When an event regarding a certain appliance
is detected, the Status column of that appliance is up-
dated accordingly to either On or Off, depending on
the event. In the second column, the appliance name
is shown. The third column shows an estimate of the
appliance’s current consumption. The fourth column
shows the energy use estimate of the corresponding
appliance. This column is updated every time an ap-
pliance is turned off. The value is calculated based on
the real power magnitude in the off-event signature
and the time from the switch-on event. This value can
then be used to calculate the price estimate in the last
column.
6 CONCLUSIONS
To meet the energy saving targets set by governments,
it is vital to motivate average consumers to make en-
ergy saving decisions. Feedback for energy use has
been found to be an effective way to decrease en-
ergy use. Therefore, a need for a cheap solution for
a wide deployment of energy usage feedback sys-
tems in households exists. A prototype application
for providing feedback about individual appliance use
in real-time to consumers was presented. The sys-
tem was tested in a real test environment and was ob-
served to give accurate appliance use statistics on av-
erage. Events were correctly identified 96.1% of the
time and the total energy estimate was within 11.3%
of the real consumption.
ACKNOWLEDGEMENTS
We would like to thank the Academy of Finland and
Infotech Oulu for financial support.
REFERENCES
Bishop, C. M. (2006). Pattern Recognition and Machine
Learning. Springer-Verlag New York, Inc., Secaucus,
NJ, USA.
Commission, E. et al. (2006). Directive 2006/32/ec of the
european parliament and of the council of april 5,
2006, on energy end-use efficiency and energy ser-
vices and repealing council directive 93/76/eec. Eu-
ropean Commission, Brussels.
Duda, R. O., Hart, P. E., and Stork, D. G. (2000). Pattern
Classification (2nd Edition). Wiley-Interscience.
Froehlich, J., Everitt, K., Fogarty, J., Patel, S., and Landay,
J. (2009). Sensing opportunities for personalized feed-
back technology to reduce consumption. In Proc. CHI
Workshop on Defining the Role of HCI in the Chal-
lenge of Sustainability.
Gupta, S., Reynolds, M., and Patel, S. (2010). Electrisense:
single-point sensing using emi for electrical event de-
tection and classification in the home. In Proceedings
of the 12th ACM international conference on Ubiqui-
tous computing, pages 139–148. ACM.
Hart, G. (1992). Nonintrusive appliance load monitoring.
Proceedings of the IEEE, 80(12):1870–1891.
Ho, B., Kao, H., Chen, N., You, C., Chu, H., and Chen,
M. (2011). Heatprobe: a thermal-based power me-
ter for accounting disaggregated electricity usage. In
Proceedings of the 13th international conference on
Ubiquitous computing, pages 55–64. ACM.
Kim, Y., Schmid, T., Charbiwala, Z., and Srivastava, M.
(2009). Viridiscope: design and implementation of a
fine grained power monitoring system for homes. In
Proceedings of the 11th international conference on
Ubiquitous computing, pages 245–254. ACM.
Leeb, S., Shaw, S., and Kirtley Jr, J. (1995). Transient event
detection in spectral envelope estimates for nonintru-
sive load monitoring. Power Delivery, IEEE Transac-
tions on, 10(3):1200–1210.
Matthews, H., Soibelman, L., Berges, M., and Goldman, E.
(2008). Automatically disaggregating the total elec-
trical load in residential buildings: A profile of the
required solution. Proc. Intelligent Computing in En-
gineering, pages 381–389.
Najmeddine, H., El Khamlichi Drissi, K., Pasquier, C.,
Faure, C., Kerroum, K., Diop, A., Jouannet, T., and
Michou, M. (2008). State of art on load monitoring
methods. In Power and Energy Conference, 2008.
PECon 2008. IEEE 2nd International, pages 1256–
1258. IEEE.
Pihala, H. (1998). Non-intrusive appliance load monitoring
system based on a modern kWh-meter. Number 356.
Technical Research Centre of Finland Espoo.
SMARTGREENS2012-1stInternationalConferenceonSmartGridsandGreenITSystems
208
