
Product Quantization for Vector Retrieval with No Error
Andrzej Wichert
Department of Informatics, INESC-ID/IST, Technical University of Lisboa, Lisboa, Portugal
Keywords:
High Dimensional Indexing, Multi-resolution, Quantization, Vector Data Bases.
Abstract:
We propose a coding mechanism for less costly exact vector retrieval for data bases representing vectors. The
search starts at the subspace with the lowest dimension. In this subspace, the set of all possible similar vectors
is determined. In the next subspace, additional metric information corresponding to a higher dimension is used
to reduce this set. We demonstrate the method performing experiments on image retrieval on one thousand
gray images of the size 128× 96. Our model is twelve times less complex than a list matching.
1 INTRODUCTION
In this paper we propose a hierarchical product quan-
tization for less costly vector retrieval. The space in
which a vector is represented is decomposed into low
dimensional subspaces and quantize each subspace
separately. Each subspace corresponds to a subvector
described by a mask. A global feature corresponds to
a subvector of a higher dimension, a local feature to
a subvector of a lower dimension. During similarity-
based vector retrieval, the search starts from the im-
ages represented by global features. In this represen-
tation, the set of all possible similar images is deter-
mined. In the next stage, additional information cor-
responding to the representation of more local feature
is used to reduce this set. This procedure is repeated
until the similar vectors can be determined. The de-
scribed method represents a vector indexing method
that speeds up the search considerably and does not
suffer from the curse of dimensionality. The method
is related to the subspace trees (Wichert et al., 2010).
We describe a mathematical model of the hierar-
chical product quantization. The paper is organized
as follows:
• We show why the search with the product quan-
tization is an improvement to simple quantization
due to the curse of dimensionality.
• We introduce a new indexing method, called hier-
archical product quantization and preform exper-
iments on image retrieval on one thousand gray
images of the size 128× 96 resulting in vectors of
dimension 12288.
2 HIERARCHICAL PRODUCT
QUANTIZATION
2.1 Euclidean ε-similarity
Two vectors~x and~y are similar if their Euclidian dis-
tance is smaller or equal to ε, d(~x,~y) ≤ ε. Let DB be
a database of s vectors~x
(i)
dimension m in which the
index i is an explicit key identifying each vector,
{~x
(i)
∈ DB|i ∈ {1..s}}. (1)
The set DB can be ordered according to a given query
vector~y using an Euclidian distance function d. This
is done by a monotone increasing sequence corre-
sponding to the increasing distance of ~y to ~x
(i)
with
an explicit key that identifies each vector indicated by
the index i,
d[y]
t
:= {d(x
(i
n
)
,y)
t
| ∀t ∈ {1..s}, ∀i
t
∈ {1..s} :
d(x
(i
1
)
,y)
1
≤ d(x
(i
2
)
,y)
2
≤ ... ≤ d(x
(i
n
)
,y)
t
.... ≤ d(x
(i
s
)
,y)
s
} (2)
if~y ∈ DB, then d[y]
1
:= 0. The set of similar vectors
in correspondence to ~y, DB[y]
ε
, is the subset of DB,
DB[y]
ε
⊆ DB with size σ = |DB[y]
ε
|, σ ≤ s:
DB[y]
ε
:= {x
(i)
∈ DB | d[y]
t
= d(x
(i)
,y) ≤ ε}. (3)
2.2 Related Work
Could we take advantage of the grouping of the vec-
tors into clusters?
87
Wichert A..
Product Quantization for Vector Retrieval with No Error.
DOI: 10.5220/0003952800870092
In Proceedings of the 14th International Conference on Enterprise Information Systems (ICEIS-2012), pages 87-92
ISBN: 978-989-8565-10-5
Copyright
c
2012 SCITEPRESS (Science and Technology Publications, Lda.)

The idea would be to determine the most similar
cluster center which represents the most similar cate-
gory. In the next step we would search for the most
similar vectors DB[y]
ε
only in this cluster. By do-
ing so we could save some considerable computation.
Such a structure can be simply modeled by a cluster-
ing algorithm, as for example k-means. We group the
images into clusters represented by the cluster centers
c
j
. After the clustering cluster centers c
1
,c
2
,c
3
,...,c
k
with clusters C
1
,C
2
,C
3
,...,C
k
are present with:
C
j
= {x|d(x,c
j
) = min
i
d(x, c
i
)} (4)
c
j
= {
1
|C
j
|
∑
x∈C
j
x}. (5)
Suppose s = min
i
d(y,c
i
) is the distance to the
closest cluster center and r
max
the maximal radius of
all the clusters. Only if s ≥ ε ≥ r
max
we are guaranteed
to determine DB[y]
ε
. Otherwise we have to analyze
other clusters as well. When a cluster with a minimum
distance s was determined, we know that the images
in this cluster have the distance between s+ r
max
and
s− r
max
. Because of that we have to analyze addition-
ally all the clusters with {∀i|d(y,c
i
) < (s+ r
max
)}. It
means that in the worst case we have to analyze all the
clusters. The worst case is present when the dimen-
sion of the images is high. High dimensional spaces
(like for example dimensions > 100) have negative
implications on the number of clusters we have to an-
alyze. These negative effects are named as the “curse
of dimensionality.” Most problems arise from the fact
that the volume of a sphere with the constant radius
grows exponentially with increasing dimension.
Could hierarchical clustering overcome those
problems? Indeed, traditional indexing methods are
based on the principle of hierarchical clustering of
the data space, in which metric properties are used to
build a tree that then can be used to prune branches
while processing the queries. Traditional indexing
trees can be described by two classes, trees derived
from the kd-tree and the trees composed by deriva-
tives of the R-tree. Trees in the first class divides the
data space along predefined hyper-planes regardless
of data distribution. The resulting regions are mutu-
ally disjoint and most of them do not represent any
objects. In fact with the growing dimension of space
we would require exponential many objects to fill the
space. The second class tries to overcome this prob-
lem by dividing the data space according to the data
distribution into overlapping regions, as described in
the second section. An example of the second class
is the M-tree (Paolo Ciaccia, 1997). It performs ex-
act retrieval with 10 dimensions. However its perfor-
mance deteriorates in high dimensional spaces. Most
indexing methods operate efficiently only when the
number of dimensions is small (< 10). The growth
in the number of dimensions has negative implica-
tions in the performance; these negative effects are
also known as the “curse of dimensionality.”
A solution to this problem consists of approximate
queries which allow a relative error during retrieval.
M-tree (Ciaccia and Patella, 2002) and A-tree (Saku-
rai et al., 2002) with approximate queries perform re-
trieval in dimensions of several hundreds. A-tree uses
approximated MBR instead of a the MBR of the R-
tree. Approximate metric trees like NV-trees (Olafs-
son et al., 2008), locality sensitive hashing (LSH)
(Andoni et al., 2006) or product quantization for near-
est neighbor search
(Jegou et al., 2011) work with an acceptable error up
to dimension 1000.
We introduce hierarchical product quantizer, who
preforms exact vector queries in high dimensions.
The hierarchical product quantizer model is related to
the subspace-tree. In a subspace-tree instead of quam-
tizing the subvectors defined by masks the mean value
is computed (Wichert, 2008),
(Wichert et al., 2010). Mathematical methods and
tools that were developed for the analysis of the sub-
space tree, like the correct estimation of ε (Wichert,
2008) and the algorithmic complexity (Wichert,
2008) can be as well applied for the hierarchical quan-
tization method. Hierarchical quantization for image
retrieval was first proposed by (Wichert, 2009).
2.3 Searching with Product Quantizers
The vector ~x of dimension m is split into f distinct
subvectors of dimension p = dim(m/ f ). The subvec-
tors are quantizied using f quantiziers:
~x = x
1
,,x
2
,·· · ,x
p
|
{z }
u
1
(~x)
,·· · ,x
m−p+1
,·· · ,x
m
|
{z }
u
f
(~x)
(6)
u
t
(x) ∈ x|t ∈ {1.. f}
We group the subvectors of dimension p =
dim(m/ f ) into clusters represented by the cluster cen-
ters c
j
of dimension p. After the clustering cluster
centers c
1
,c
2
,c
3
,...,c
k
with clusters C
1
,C
2
,C
3
,...,C
k
are present with
C
j
= {u
t
(x)|d(u
t
(x),c
j
) = min
i
d(u
t
(x),c
i
)} (7)
c
j
= {
1
|C
j
|
∑
u
t
(x)∈C
j
u
t
(x)}. (8)
ICEIS2012-14thInternationalConferenceonEnterpriseInformationSystems
88

We assume that all subquantuzers have the same
number k of clusters. To a query vector y we deter-
mine the most similar vector x of the database using
the qunatizied codes and the Euclidean distance func-
tion d.
d(U(~x),U(~y)) =
v
u
u
t
f
∑
t=1
d(u
t
(~x),(u
t
(~y))
2
d(U(~x),U(~y)) =
v
u
u
t
f
∑
t=1
d(c
t(x)
,c
t(y)
)
2
(9)
We represent vectors by the corresponding cluster
centers:
U(~x) = c
i1
,c
i2
,·· · ,c
ip
|
{z }
u
1
(~x)=c
1(x)
=c
i
,·· · , c
j1
,·· · ,c
jp
|
{z }
u
f
(~x)=c
f(x)
=c
j
(10)
By using d(U(~x),U(~y)) instead of d(~x,~y) an esti-
mation error is produced:
d(U(~x),U(~y)) + error = d(~x,~y) (11)
To speed up the computation of d(U(~x),U(~y)) all the
possible d(c
t(x)
,c
t(y)
)
2
are pre-computed and stored in
a look-up table. The size of the look-up table depends
on the number k, it is k
2
. The bigger the value of k, the
slower the computations due to the size of the look-up
table. However the bigger the value of k the smaller
is the estimation error. To determine ε similar vectors
according to the Euclidean distance to a given query y,
we have to compute d(~x,~y) for all vectors x out of the
database. If the distances computed by the quantizied
product d(U(~x),U(~y)) are smaller or equal than the
distances in the original space d(~x,~y), a lower bound
which is valid in both spaces can be determined. The
distance of similar objects is smaller or equal to ε in
the original space and, consequently, it is smaller or
equal to ε in the quantizied product as well. The use
of a lower bound between different spaces was first
suggested by
(Faloutsos et al., 1994), (Faloutsos, 1999). Because
of the estimation error the lower bound is only valid
for a certain ω value:
d(U(~x),U(~y)) − ω ≤ d(~x,~y). (12)
How can we estimate the ω value for all {~x
(i)
∈ DB|i ∈
{1..s}}? Suppose s = min
i
d(u
t
(y),c
i
) is the dis-
tance to the closest cluster center and r
max
the max-
imal radius of all the clusters. That means that in the
worst case we have d to subtract r
max
for each subvec-
tor before computing the Euclidian distance function,
ω = k × r
max
.
If we compute the Euclidian distance between
all vectors and {~x
(i)
∈ DB|i ∈ {1..s}} compare it to
the Euclidian distance between{U(~x)
(i)
, we find that
ω << k× r
max
.
We can estimate the ω value by computing the Eu-
clidian distance between a a random sample of vec-
tors and their product quantizier representation. If the
lower bound is satisfied with the correct value ω, all
vectors at a distance lower than ε in the original space
are also at a lower distance in the product quantizier
representation. The distance of some that are above
ε in the original space may be below ε in the product
quantizier representation. This vectors are called false
hits. The false hits are separated from the selected ob-
jects through comparison in the original space.
The set of ε similar vectors in correspondence to
a query vector~y is computed in two steps. In the first
step the set of possible candidates is determined us-
ing product quantizier representation. The speed re-
sults from the usage of the look-up table. In the sec-
ond step the false hits are separated from the selected
objects through comparison in the original space. A
saving compared to a simple list matching is achieved
if the set of possible candidates is sufficiently small in
comparison to the size of database. An even greater
saving can be achieved, if one applies this method hi-
erarchically.
2.4 Searching with Hierarchical
Product Quantizers
We apply the product quantizier recursively. The vec-
tor ~x of dimension m is split into f distinct subvec-
tors of dimension p = dim(m/ f). The subvectors
are quantizied using f quantiziers, the resulting quan-
tizied vectror are quantizied using e quantiziers with
g = dim(m/e) and f > e
~x = x
1
,x
2
,·· · ,x
p
|
{z }
u1
1
(~x)
,·· ·
|
{z }
u2
1
(U(~x))
,·· · ,· ·· ,x
m−p+1
,·· · ,x
m
|
{z }
u1
f
(~x)
|
{z }
u2
e
(U(~x))
(13)
with following hierarchical representation,
U1(~x) = U(~x) = c
i1
,c
i2
,· ·· , c
ip
,· ·· , c
j1
,· ·· , c
jp
U2(~x) = U(U1(~x)) = c
i1
,c
i2
,· ·· ,c
ig
,· ·· ,c
j1
,· ·· ,c
jg
·· ·
Un(~x) = U(U(n− 1)(~x)) = c
i1
,c
i2
,· ·· ,c
il
,· ··
·· · , c
j1
,· ·· ,c
jl
(14)
and
d
∗
(Uk(~x),Uk(~y) = d(Uk(~x),Uk(~y)) − ω
k
≤ d(~x,~y),
(15)
k ∈ {1..n}
The DB is mapped by the first product quantizers U1
into U1(DB), by the k th quantizers Uk into Uk(DB).
ProductQuantizationforVectorRetrievalwithNoError
89

The set Uk(DB) can be ordered according to a given
query vector Uk(~y) using an Euclidian distance func-
tion with ω
k
as explained before
d[Uk(y)]
t
:= {d
∗
(Uk(x
(i)
),Uk(y)) | ∀t ∈ {1..s} :
d
∗
[Uk(y)]
t
≤ d
∗
[Uk(y)]
t+1
}
for a certain ε value,
Uk(DB[y])
ε
:= {Uk(x)
(i)
t
∈ Uk(DB) | d[Uk(y)]
t
=
d
∗
(Uk(x)
(i)
,Uk(y)) ≤ ε}
with the sizeUk(σ) = |Uk(DB[y]
ε
)| and σ < U1(σ) <
U2(σ) < ··· < s.
To speed up the computation of d(U(~x),U(~y))
all the possible d(c
j(x)
,c
j(y)
)
2
are pre-computed and
stored in a look-up table For simplicity we assume
that the the cost for a look-up operation is a constant
c = 1. This is the case, given the size of the look-up
tables for each hierarchy is constant. Consequently
the computational dimensions of the quantized vector
~x is dim(Uk) = m/ f, where dim(Uk) is the number
of distinct subvectors of dimension f of the vector~x .
It follows, that dim(Uk) is the number of quantiziers.
The higher the hierarchy, the lower the number of the
used quantiziers. Given that dim(U0) =: m (the di-
mension of the vector~x), the computational cost of a
hierarchy on n level is:
cost
n
=
n
∑
i=1
Ui(σ) · dim(U(i− 1) + s· dim(Un) + n
(16)
where the last summand n represents the cost of the
look-up operation. The cost cost
n
of retrieving a
dozen most similar vectors out of the database DB to
a query vector ~y, is significantly lower as the cost of
simple list matching s· m.
To estimate ε we define a mean sequence
d[Uk(DB)]
n
which describes the characteristics of an
vector database of size s:
d
s
[Uk(DB)]
n
:=
s
∑
i=1
d[Uk(x
(i)
)]
n
s
. (17)
We will demonstrate this principle on an example
of high dimensional vectors representing gray images.
2.5 Example: Image Retrieval
The high dimensional vectors correspond to the
scaled gray images, representing the gray level dis-
tribution and the layout information. Two images ~x
and ~y are similar if their distance is smaller or equal
to ε, d(~x,~y) ≤ ε. The result of a range query computed
by this method is a set of images that have gray level
distribution that are similar to the query image.
We preformexperiments on image retrieval on one
thousand (s = 1000) gray images of the size 128× 96
resulting in vectors of dimension 12288. Each gray
level is represented by 8 bits, leading to 256 differ-
ent gray values. The image database consists images
with photos of landscapes and people, with several
outliers consisting of drawings of dinosaurs or photos
of flowers (Wang et al., 2001). We use a hierarchy of
four n = 4.
(a)
(b)
Figure 1: (a) Two examples of of squared masks M of a size
2× 2. (b) Two examples of of squared masks M of a size
4× 4.
• In the first level of hierarchy each image corre-
sponds to a of dimension 12288. It is is split
into 3072 distinct subvectors of dimension 4 =
dim(12288/3072). Each subvector corresponds
to a squared mask M of a size 2 × 2. A natu-
ral grouping of the components into subvectors is
achieved by the coverage of the image with 3072
masks M (see, Figure 1 (a)). The subvectors of
dimension four are grouped into clusters repre-
sented by 256 cluster centers.
• In the second level of the hierarchy the resulting
quantizied images are quantizied using 768 quan-
tiziers with 16 = dim(12288/768) . Each sub-
vector corresponds to a squared mask M of a size
4× 4 (see, Figure 1 (b)). The subvectors of dimen-
sion sxten are grouped into clusters represented by
256 cluster centers. We follow the procedure re-
cursively additionally two times.
• The resulting quantizied images are quantizied us-
ing 192 quantiziers with 64 = dim(12288/192) .
Each subvector corresponds to a squared mask M
of a size 8× 8 (see, Figure 2 (a)). The subvectors
of dimension 64 are grouped into clusters repre-
sented by 256 cluster centers.
• The resulting quantizied images are quantizied us-
ing 48 quantiziers with 256 = dim(12288/48) .
ICEIS2012-14thInternationalConferenceonEnterpriseInformationSystems
90
Each subvector corresponds to a squared mask M
of a size 16 × 16 (see, Figure 2 (b)). The sub-
vectors of dimension256 are grouped into clus-
ters represented by 256 cluster centers. (Note:
The number of cluster centers remains constant
through the hierarchy.)
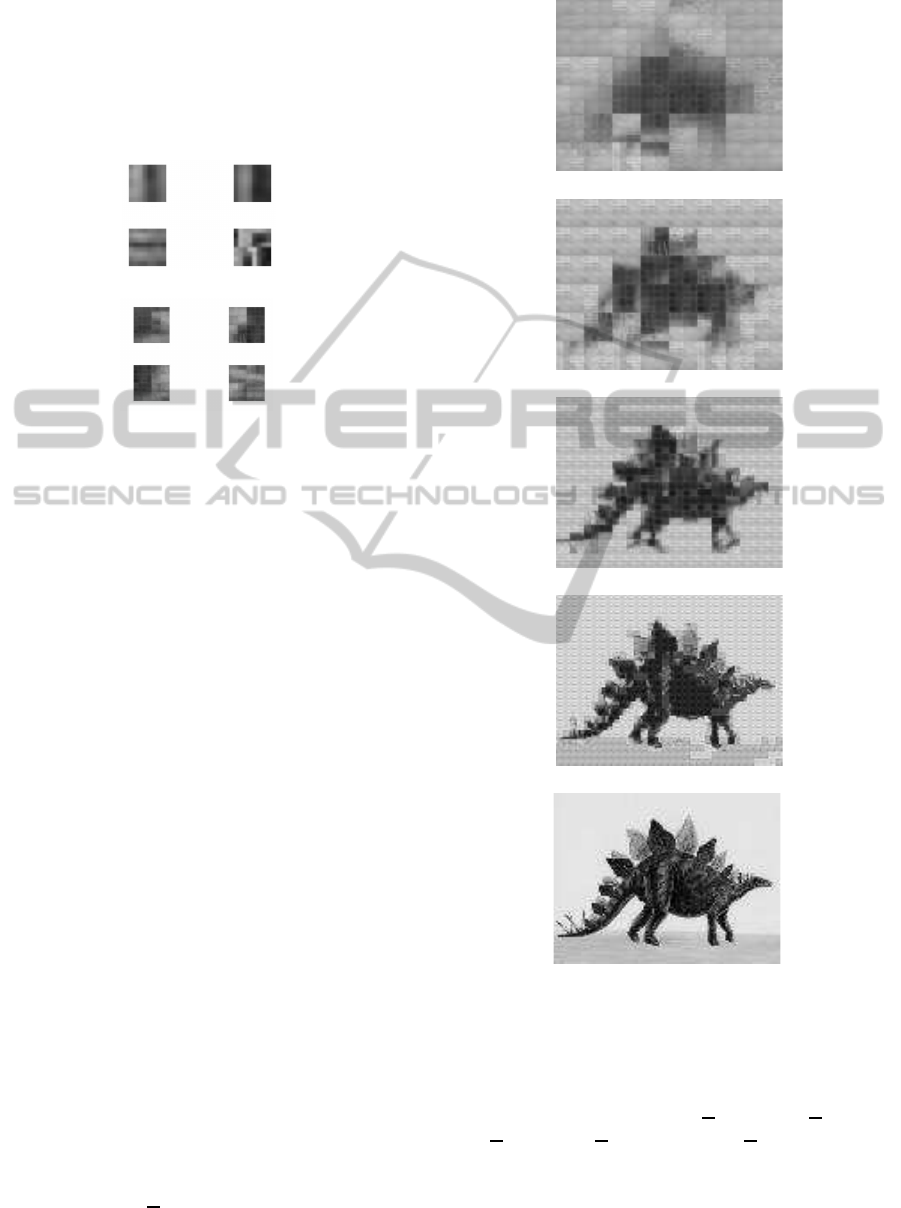
(a)
(b)
Figure 2: (a) Two examples of of squared masks M of a size
8× 8. (b) Two examples of of squared masks M of a size
16× 16.
The computational dimensions of the quantized
vectors are dim(U1) = 3072, dim(U2) = 768,
dim(U3) = 192 and dim(U4) = 48. An example of
the quantizied representation of an image is indicated
in the Figure 3. In each layer the image is described
with less accuracy, so that the following layers repre-
sent less information. The set of ε similar vectors in
correspondence to a query vector ~y is computed in 5
steps. For the estimation of the value of ε we use the
characteristics, see Equation 17 and Figure 4
• In the first step the set of possible candidates is de-
termined using product quantizier representation
in theU4(DB) of the computational dimension 48
and determine the subset U4(DB[y])
ε
.
• Recursively out of the set U4(DB[y])
ε
we deter-
mine U3(DB[y])
ε
=
U3(U4(DB[y])
ε
)
ε
,
• U2(DB[y])
ε
= U2(U3(DB[y])
ε
)
ε
,
• U1(DB[y])
ε
= U2(U2(DB[y])
ε
)
ε
and
• finally the set DB[y]
ε
in which the false hits
are separated from the selected objects through
comparison in the original space by DB[y]
ε
=
U0(U1(DB[y])
ε
)
ε
.
To retrieve in the mean 5 most similar images the
estimated ε value is 6036. We estimate the values
ω
k
and ε by a random sample of hundred vectors and
their product quantizier representation. We computed
the mean value Uk(
σ) over all possible queries (one
thousand queries, each time we take an element out
(a)
(b)
(c)
(d)
(e)
Figure 3: Gray image and its quantized representation, (e)
is equal to the original space, (d) corresponds to U1(DB),
(c) to U2(DB), (b) to U3(DB) and (a) to U4(DB).
of the database out and and preform a query). For
ε = 6036 the values are U0(
σ) = 5, U1(σ) = 20,
U2(
σ) = 95, U
3
(σ) = 315 and U4(σ) = 835. To re-
trieve the 5 most similar images to a given query im-
age of the image test database, the mean computation
costs are according to Equation 16:
ProductQuantizationforVectorRetrievalwithNoError
91
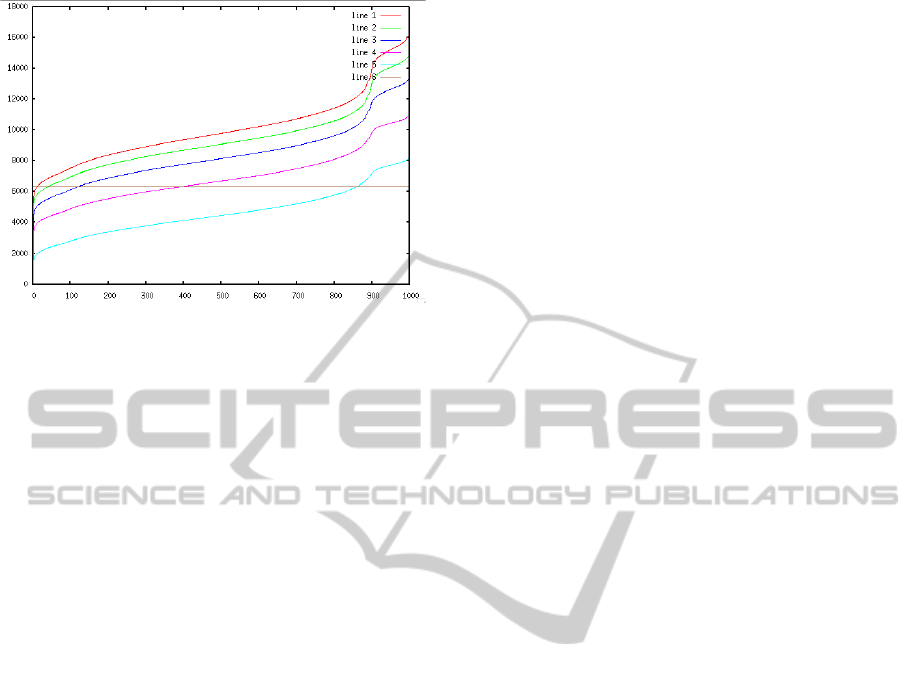
Figure 4: Characteristics of s = 1000, d
s
[U0(DB)]
n
=
line 1, d
s
[U1(DB)]
n
= line 2, d
s
[U2(DB)]
n
= line 3,
d
s
[U3(DB)]
n
= line 4 and d
s
[U4(DB)]
n
= line 5. Line 5
represents ε.
(12288 · 20+ 3072· 95+ 768· 315+ 192· 835+
+48· 1000+ 4 = 987844
which is 12.4 times less complex than a list matching
which requires 12288· 1000 operations. Further op-
timization of our results could be achieved by better
quantization training (clustering algorithms).
3 CONCLUSIONS
We propose hierarchical product quantization for vec-
tor retrieval with no error for vector based databases.
Through quantization by hierarchical clustering the
distribution of the points in the high dimensional vec-
tor space can be estimated. Our method is exact and
not approximative. It means we are guaranted to find
the most similar vector according to a distance or sim-
ilarity function. We demonstrated the working prin-
ciples of our model by empirical experiment on one
thousand gray images which correspond to 12288 di-
mensional vectors.
ACKNOWLEDGEMENTS
This work was supported by Fundac¸˜ao para a Ciˆencia
e Tecnologia (FCT): PTDC/EIA-CCO/119722/2010.
REFERENCES
Andoni, A., Dater, M., Indyk, P., Immorlica, N., and Mir-
rokni, V. (2006). Locality-sensitive hashing using sta-
ble distributions. In MIT-Press, editor, Nearest Neigh-
bor Methods in Learning and Vision: Theory and
Practice, chapter 4. T. Darrell and P. Indyk and G.
Shakhnarovich.
Ciaccia, P. and Patella, M. (2002). Searching in metric
spaces with user-defined and approximate distances.
ACM Transactions on Database Systems, 27(4).
Faloutsos, C. (1999). Modern information retrieval. In
Baeza-Yates, R. and Ribeiro-Neto, B., editors, Mod-
ern Information Retrieval, chapter 12, pages 345–365.
Addison-Wesley.
Faloutsos, C., Barber, R., Flickner, M., Hafner, J., Niblack,
W., Petkovic, D., and Equitz, W. (1994). Efficient and
effective querying by image content. Journal of Intel-
ligent Information Systems, 3(3/4):231–262.
Jegou, H., Douze, M., and Schmid, S. (2011). Product quan-
tization for nearest neighbor search. IEEE Transac-
tions on Pattern Analysis and Machine Intelligence,
33(1):117–128.
Olafsson, A., Jonsson, B., and Amsaleg, L. (2008). Dy-
namic behavior of balanced nv-trees. In Interna-
tional Workshop on Content-Based Multimedia Index-
ing Conference Proceedings, IEEE, pages 174–183.
Paolo Ciaccia, Marco Patella, P. Z. (1997). M-tree: An ef-
ficient access method for similarity search in metric
spaces. In VLDB, pages 426–435.
Sakurai, Y., Yoshikawa, M., Uemura, S., and Kojima, H.
(2002). Spatial indexing of high-dimensional data
based on relative approximation. VLDB Journal,
11(2):93–108.
Wang, J., Li, J., and Wiederhold, G. (2001). Simplicity:
Semantics-sensitive integrated matching for picture li-
braries. IEEE Transactions on Pattern Analysis and
Machine Intelligence, 23(9):947–963.
Wichert, A. (2008). Content-based image retrieval by hier-
archical linear subspace method. Journal of Intelligent
Information Systems, 31(1):85–107.
Wichert, A. (2009). Image categorization and retrieval. In
Proceedings of the 11th Neural Computation and Psy-
chology Workshop. World Scientific.
Wichert, A., Teixeira, P., Santos, P., and Galhardas, H.
(2010). Subspace tree: High dimensional multimedia
indexing with logarithmic temporal complexity. Jour-
nal of Intelligent Information Systems, 35(3):495–
516.
ICEIS2012-14thInternationalConferenceonEnterpriseInformationSystems
92
