
CLOUD MANAGEMENT ON THE ASSUMPTION OF
FAILURE OF RESOURCE DEMAND PREDICTION
Tadaoki Uesugi
1
, Max Tritschler
2
, Hoa Dung Ha Duong
3
, Andrey Baboshin
4
,
Yuri Glickman
2
and Peter Deussen
2
1
Yokohama Research Laboratory, Hitachi Ltd., 292 Yoshida-cho, Totsuka-ku, Yokohama, 244-0817, Kanagawa, Japan
2
Fraunhofer Institute FOKUS, Kaiserin-Augusta Allee 31. 10589 Berlin, Germany
3
Institut Telecom, Telecom ParisTech, CNRS, UMR 5141, 46 rue Barrault, 75013, Paris, France
4
TrustedSafe GmbH, Helmholtzstrasse 13/14, 10587, Berlin, Germany
Keywords: Cloud Computing, Virtualization, Optimization, Predictable/Unpredictable Virtual Machine,
Shared/Occupied Region.
Abstract: One of the important issues in cloud computing is an advanced management of large scale server clusters
enabling efficient energy use and SLA compliance. That includes smart placement of virtual machines to
appropriate hosts and thereby, efficient allocation of physical resources to virtual machines. One of the
promising approaches is to optimize the placement based on predicting future requested physical resources
for each virtual machine. However, often predictions cannot always be accurate and might cause increasing
rates of SLA violation. In this paper we present an adaptive algorithm for predictive resource allocation and
optimized VM placement that offers a solution to this problem.
1 INTRODUCTION
As datacenters today keep growing larger and more
complex with increasing requirements on capacity
and computing power, cloud users and providers are
forced to optimize their ways of managing enterprise
application systems and supporting infrastructures.
One of the main goals of cloud management
from provider perspective is reducing the total
operational cost while still being able to comply to
the Service Level Agreement (SLA) with the
customers. One approach for achieving cost
reduction is to lower the energy consumption of
physical hosts, which is one of the main cost factors
in operating cloud infrastructures. Minimization of
energy consumption is achieved by packing as many
VMs as possible on the smallest number of hosts,
based on their current resource demands, and turning
off idle hosts, whose baseline power consumption
makes up a significant part of the overall power
consumption in datacenters (Beloglazov et al.,
2010) . However, this strategy will most likely result
in a high rate of SLA violations, when the resource
demands of a VM increases rapidly beyond the
amount of physically available resources
(CPU/memory/network bandwidth/disk space) and
migrating the VM to another physical host with
enough available resources cannot be executed in
time. As long as cloud providers want to avoid
performance degradation of VMs, and therefore
customer dissatisfaction, they will try reducing the
number of SLA violations as much as possible,
which is the other important goal of the VM
placement. This describes the trade-off between
wanting to reduce energy consumption and keeping
the rate of SLA violations to a minimum
(Beloglazov et al., 2010; Beloglazov et al., 2011;
Okitsu et al., 2010; Mehta et al., 2011).
The optimal placement of VMs on physical hosts
in order to meet the SLAs requires a precise
estimation of physical resources requested by each
VM in the future. However, generally the prediction
of the physical resources is not always accurate and
optimizing based on data with a significant
prediction error will most likely cause an
unacceptable amount of SLA violations.
This paper focuses on the issue on prediction
difficulty and offers a solution with the basic idea of
classifying VMs as either predictable or
unpredictable. Predictable VMs are put in the
153
Uesugi T., Tritschler M., Dung Ha Duong H., Baboshin A., Glickman Y. and Deussen P..
CLOUD MANAGEMENT ON THE ASSUMPTION OF FAILURE OF RESOURCE DEMAND PREDICTION.
DOI: 10.5220/0003959301530160
In Proceedings of the 2nd International Conference on Cloud Computing and Services Science (CLOSER-2012), pages 153-160
ISBN: 978-989-8565-05-1
Copyright
c
2012 SCITEPRESS (Science and Technology Publications, Lda.)

shared region of hosts, where physical resources are
shared by the VMs. Unpredictable VMs are put in
the occupied region of hosts, where the maximum of
physical resources as promised in the SLA is
assigned statically to each VM. This approach
reduces the rate of SLA violations compared to the
existing purely predictive approach.
This paper continues in Section 2 with
background information on cloud management and
the focusing issue. Section 3 presents some related
works on cloud management. A solution to the issue
specified in Section 2 is proposed in Section 4 and is
evaluated in Section 5. The paper ends with future
directions of this research topic in Section 6.
2 BACKGROUND
The issue mentioned in section 1 stems from the
prediction step in the whole cloud management
procedure. A typical and already existing cloud
management procedure (Beloglazov et al., 2010;
Beloglazov et al., 2011; Okitsu et al., 2010; Mehta et
al., 2011) consists of the following four steps:
− Cloud management servers monitor information
on every operational status of physical hosts and
VMs, like utilization of CPU, memory, I/O of
VMs.
− Cloud management servers predict resource
demands of every VM in the future, e.g. how
CPU utilization of each VM might evolve in the
next 10 minutes.
− Cloud management servers optimize the VM
placement on hosts, based on the prediction. This
is the plan which determines which host each VM
should be placed on and which host should be
turned off.
− Cloud management servers control both of VMs
and hosts, based on the result of optimization.
Cloud management servers send control messages
of VM live migration from one host to another or
turning on/off physical hosts.
Except for maintenance processes like
replacement of broken parts of hardware, cloud
management processes by cloud management
servers are generally described as a cyclic rotation of
these four steps with a fixed interval.
As mentioned in section 1 an important goal of
cloud management is to reduce energy consumption
and a number of SLA violations. For cloud providers
which focus on highly reliable systems, it would
seem feasible trying to avoid SLA violations by
using multiple highly precise prediction algorithms
to improve the prediction accuracy. However, the
problem is that even then they cannot avoid
encountering low quality of prediction. The reasons
are:
− Some VMs do not provide any historical data,
which makes it impossible for the prediction
algorithm to create reliable prediction models.
For example, cloud providers do not know how
new VMs launched by cloud users will behave in
the future due to this reason.
− VM behavior might not be deterministic and is
caused by external events (e.g. increasing demand
on Twitter’s service during the FIFA World Cup)
− Customers (cloud users) can maintenance of
applications installed in each VM without
informing cloud providers in advance. This can
change behavior of VMs completely
This means that cloud providers have to accept
that prediction sometimes fails and take alternative
measures when it happens.
3 RELATED WORK
There have been many related works on allocation
of physical resources to VMs. Some of them
(Beloglazov et al., 2010; Perucci et al., 2010;
Beloglazov et al., 2011; Okitsu et al., 2010; Wu et
al., 2011; Dasgupta et al., 2011) regard this matter as
a mathematical optimization problem rather than the
prediction.
Other papers (Mehta et al., 2011; Duy et al.,
2010; Islam et al., 2010; Baryshnikov et al., 2005)
focus on the prediction issue. Typically they
improve an existing algorithm and show its
preciseness in the viewpoint of SLA or energy
reduction. Baryshnikov et al., 2005 shows that linear
regression works to some existing Web servers with
highly auto correlating behavior. Mehta et al., 2011
uses a regression formula based on their modified k-
Nearest Neighbor algorithm (kNN) to predict the
behavior of a cluster of Web servers. It shows that
the rate of SLA violations is improved compared to
the approach of Duy et al., 2010 which applies a
prediction algorithm based on neural networks to the
same application scenario. Islam et al., 2010
combines linear regression and an error-correcting
neural network to predict the behavior of VMs in a
simulated environment based on TPC-W
benchmarking data (Transaction Processing
Performance Council). They show that better results
can be achieved with error correcting mechanisms
such as their neural network.
CLOSER2012-2ndInternationalConferenceonCloudComputingandServicesScience
154

The common issue in those papers is that the
type of application scenarios to which their
algorithm can be applied is restricted. For example
Baryshnikov et al., 2005 shows that their algorithm
does not apply to Web servers without strong
autocorrelation. As far as cloud providers have to
deal with various types of VMs launched by their
customers, this prerequisite cannot be met.
Other papers develop more general approaches to
the prediction problem. Zhang and Figueiredo, 2007
uses multiple prediction algorithms, predicting in
parallel and to choose the algorithm which provides
the most accurately predicted value. Another
approach is to dynamically update parameters of the
prediction model, by incorporating time series
analyses of actual values and frequently re-optimize
the prediction model as shown by Casolari et al.,
2009 and Casolari et al., 2010.
However, even if all known prediction
algorithms are installed in the target system and the
parameters of all the algorithms get dynamically
updated, it cannot be guaranteed that they cover
every application scenarios. Moreover, these
approaches assume the existence of enough data
points to create a prediction model. As mentioned
before, this requirement doesn’t hold for newly
started VMs or VMs whose behavior is suddenly
changed by unexpected events, e.g. user
maintenance.
4 PROPOSED SOLUTION
In the previous section we argued that it is highly
unlikely to find a prediction model that fits for all
application scenarios and therefore we need to
consider faulty predictions. We present a cloud
system which assumes the possibility of failing
prediction and in this case dynamically switches to a
conservative fallback mechanism.
4.1 Overview
The idea as shown in Figure 1 is the following :
− All VMs in the cloud are classified as either
predictable or unpredictable.
− Physical resources of every host managed by a
VM Monitor (VMM) are separated into two types
of regions, shared and occupied.
− Basically, predictable VMs are placed in shared
regions and unpredictable ones are placed in
occupied regions.
− The status of a VM may change from predictable
to unpredictable or vice-versa, which also results
in moving the VM from one type of region to the
other.
Host
Host
Host
Host
Powered‐off
Host
VMM(occupied) VMM(shared)
UNPRE
VM2
PRE
VM3
Pre
VMs
Pre
VMs
PRE
VM
UNPRE
VM1
Host
VMM(occupied) VMM(shared)
UNPRE
VM
UNPRE
VM
Pre
VMs
Pre
VMs
PRE
VM
Host
VMM(occupied) VMM(shared)
PRE
VM
Pre
VMs
Pre
VMs
PRE
VM
CloudRuntime
Immediate
livemigration
VM4~7
[Definition]
• PREVM:PredictableVM
• UNPREVM:unpredictableVM
• VMM(occupied):
VMMworkingwithoccupiedmode
• VMM(shared):
VMMworkingwithsharedmode
Livemigrationatevery
optimizationcycle
Figure 1: Cloud management on the assumption of failure
of resource demand prediction.
The definition of the predictable / unpredictable
VM is given as follows:
− A predictable VM is a VM all of whose virtual
resources have valid prediction models.
(For each VM a maximum of four prediction
models can be defined, which correspond to
models for CPU, memory, network I/O and disk
I/O.)
− All other VMs are considered unpredictable.
A prediction model is VALID if both of the
following conditions are met:
− We have an amount of historical data larger than
some threshold value
− We have a metric on the precision of our
previous predictions larger than some threshold
value.
The first condition excludes VMs without a
sufficiently large history. Note that when VMs are
restarted, prediction models are constructed again.
Initially all VMs are considered unpredictable.
The second condition rejects any VMs where the
prediction algorithm returns inaccurate results. It is
possible here to choose any function measuring the
prediction error. We use the Mean Absolute
Percentage Error (MAPE), defined by:
.
(1)
where x
1
...x
N
represent the predictions and y
1
…y
N
represent the corresponding actual values for the
same time interval of N steps.
CLOUDMANAGEMENTONTHEASSUMPTIONOFFAILUREOFRESOURCEDEMANDPREDICTION
155

The VMM on a host is responsible for assigning
available physical resources to any region. The ratio
of resources allocated for shared or occupied regions
is determined dynamically where all resources
currently not assigned to VMs in occupied mode get
assigned to the shared region.
In the shared region all physical resources are
shared by the VMs running on it. More physical
resources are allocated to busier VMs. Even if a
non-busy VM is a high-spec server, the VMM
doesn’t have to secure enough physical resources to
cover the server spec as defined in the SLA. This
leads to reduced energy consumption compared with
the conservative approach of always allocating the
full amount of physical resources as agreed in the
SLA. However, the number of SLA violations will
increase in case of inaccurate predictions. Existing
approaches to cloud management (Beloglazov et al.,
2010; Beloglazov et al., 2011; Okitsu et al., 2010;
Mehta et al., 2011) use only mechanisms
comparable to the concept of a shared region.
In occupied regions, a part of a machine’s
physical resources will be allocated to one specific
VM running on it. The amount of allocated physical
resources to each VM is the maximum of promised
resources, thus avoiding any SLA violations.
However, physical resources assigned to a non-busy
VM in an occupied region are not utilized efficiently.
We propose to run predictable VMs in the shared
region with an optimistic resource allocation, while
at the same time VMs we classify as unpredictable
will be moved to the occupied region where
resources get allocated pessimistically.
4.2 State Diagram
Predictable VMs can change to unpredictable VMs
or vice-versa during a cloud management runtime.
This is because their application behavior sometimes
changes depending on behavior of end-users or VM
operators. Cloud management servers detect this
change by keeping checking if the preciseness of
prediction like the MAPE values in equation (1)
goes over the threshold value. Once they detect the
change, they perform VM live migration from the
current region to the other type of region.
Based on the basic consideration mentioned so
far, the following status diagram of predictable VMs
and unpredictable VMs are designed (Figure 2).
When a new VM is started ((1) in Figure 2),
there are no data accumulated on the resource
utilization so the VM is identified as an
unpredictable VM and is put on some part of
occupied regions. After time passes, an enough
NONPREVM
inOCC
PREVM
inOCC
PREVM
inSHA
NONPREVM
inSHA
Allthemodels
becomeValid.
(4)Migrationatthe
timeofoptimization
(5)AModel
becomes
Invalid.
(6)Migrationby
UrgentControl
Lifetimeisveryshort
Starting
aVM
AModelbecome
Invalid.
(1)
(2)
(3)
Figure 2: State Diagram of VMs.
amount of historical data on the resource utilization
on the VM is accumulated. If predicted results of
resource utilization are precise enough, the models
become valid and the VM changes its status from
unpredictable to predictable ((2) in Figure 2). On the
contrary, a predictable VM turns back to an
unpredictable VM immediately when at least one of
the models for its resource utilization is found out to
be imprecise ((3) in Figure 2).
A predictable VM in an occupied region has to
wait for the next optimization to be carried out and it
is migrated from the occupied region to a shared
region when it is executed, mixed with other
predictable VMs in the shared region ((4) in Figure
2). A predictable VM in a shared region can turn
into an unpredictable VM ((5) in Figure 2), when
cloud management servers find out that at least one
of the models of its resource utilization is not valid.
Then, the unpredictable VM is migrated to an
occupied region immediately ((6) in Figure 2),
which is defined as the URGENT CONTROL in this
paper. This is because it is dangerous to let an
unpredictable VM stay in a shared region, which
causes a high rate of SLA violations. In that sense a
lifetime of unpredictable VMs in shared regions are
very short, which is almost zero.
4.3 Algorithms
There are three types of algorithms used in this
scenario: A prediction algorithm, an urgent control
algorithm and an optimization algorithm. There are
no restrictions on which prediction algorithm should
be used. Any prediction algorithm can be applied to
this scenario.
The urgent control is a new concept defined in
Section 4.2. Its algorithm determines which
occupied region an unpredictable VM in a shared
region should be immediately migrated to. The best
place is an occupied region in the same host, and the
next one is an occupied region in the nearest host in
the sense of network distance. This is because a VM
live migration consumes a lot of network bandwidth,
which is a costly operation.
The optimization problem is close to what is
called the Bin-packing problem, in a sense that an
CLOSER2012-2ndInternationalConferenceonCloudComputingandServicesScience
156

optimizer in a cloud management server has to pack
objects (VMs) of different volumes (predicted
results of requested physical resources) into a finite
number of bins (hosts) in a way that minimizes the
number of bins (hosts) used. Several efficient
approximate solutions are already known and any
one of them can be applied to the scenario in this
paper. For example, Okitsu et al., 2010 is proposing
an approximate optimization algorithm described by
the following steps:
1. The optimizer sorts every host by values of the
POWER EFFICIENY in a descending order.
The POWER EFFICIENCY is defined by:
.
(2)
Here it is assumed that power consumption of a
host is described as a linear function of CPU
utilization (Beloglazov et al., 2010; Perucci et
al., 2010; Beloglazov et al., 2011; Okitsu et al.,
2010).
2. The optimizer sorts every VM by values of
predicted amounts of CPU utilization in a
descending order.
3. The optimizer tries to put the first VM in the
sorted list on the first host in the sorted list. If it
cannot put the VM in the host due to lack of
enough physical resources, it tries to put the
VM on the second host. It continues this until it
can find out the host on which the VM can be
placed.
4. If the VM can be put in the host, the optimizer
deletes the VM in the sorted list of VMs and
goes back to step 3.
5. The optimizer continues from step 3 to 4 until
there are no VMs left in the list.
An underlying principle in this algorithm is that
the optimizer tries to use up physical resources of
efficient hosts first rather than non-efficient ones.
Considering this principle a big modification is
not required to apply this algorithm to the scenario
in this paper. This algorithm should be applied to all
the predictable VMs first, and after that it should be
applied to all the unpredictable VMs. This is because
there is much higher possibility that predictable
VMs placed in shared regions use up physical
resources of a host than the possibility that
unpredictable VMs placed in occupied regions do
(Note that, as shown in Figure 2, predictable VMs in
occupied regions don’t exist right after the
optimization.). As explained before, the shared
region uses physical resources efficiently from the
perspective of energy consumption than the
occupied region. The pseudo code of the algorithm
is shown below.
I
NPUT: hostList, predictableVMList, unpredictableVMList
OUTPUT: vm.allocatedHost, host.allocatedVMInShared,
host.allocatedVMInOccupied
hostList.descendSortByPowerEfficiency()
predictableVMList.descendSortByPredictedMIPS()
unpredictableVMList.descendSortByMIPSInSpec()
foreach vm in predictableVMList do
foreach host in hostList do
if host has enough physical resource to put vm then
vm.allocatedHost host
host.allocatedVMInShared vm.predictedResource
break
foreach vm in unpredictableVMList do
foreach host in hostList do
if host has enough physical resource to put vm then
vm.allocatedHost host
host.allocatedVMInOccupied vm.specResource
break
return vm.allocatedHost, host.allocatedVMInShared,
host.allocatedVMInOccupied
Algorithm 1: Optimization Algorithm.
5 EVALUATION
The proposed idea is evaluated under the following
experimental setup.
− 11 hosts (From “Host0” to “Host10”) in the
same network segment with the specification
described in Table 1 are turned on.
− 28 VMs (From “VM0” to “VM27”) with the
specification described in Table 1 are created.
Initial allocation of VMs on hosts is described in
Table 2.
− These hosts and VMs are created as virtual
objects in a cloud simulator. The cloud simulator
was developed using some ideas from CloudSim
(Buyya et al., 2011; Calheiros et al., 2011) so
that:
9 It can handle both of the shared region and the
occupied region.
9 It can communicate with the cloud
management server, which is a separated
system component from the cloud simulator.
The cloud management server monitors CPU
and memory behavior of every VM running
in the cloud simulator, and the cloud
management server send control messages
including VM migration and turning on/off
hosts, which are executed by the cloud
simulator.
9 It can handle any non-artificial data describing
behavior of CPU and memory (realistic data
like the one mentioned below).
CLOUDMANAGEMENTONTHEASSUMPTIONOFFAILUREOFRESOURCEDEMANDPREDICTION
157
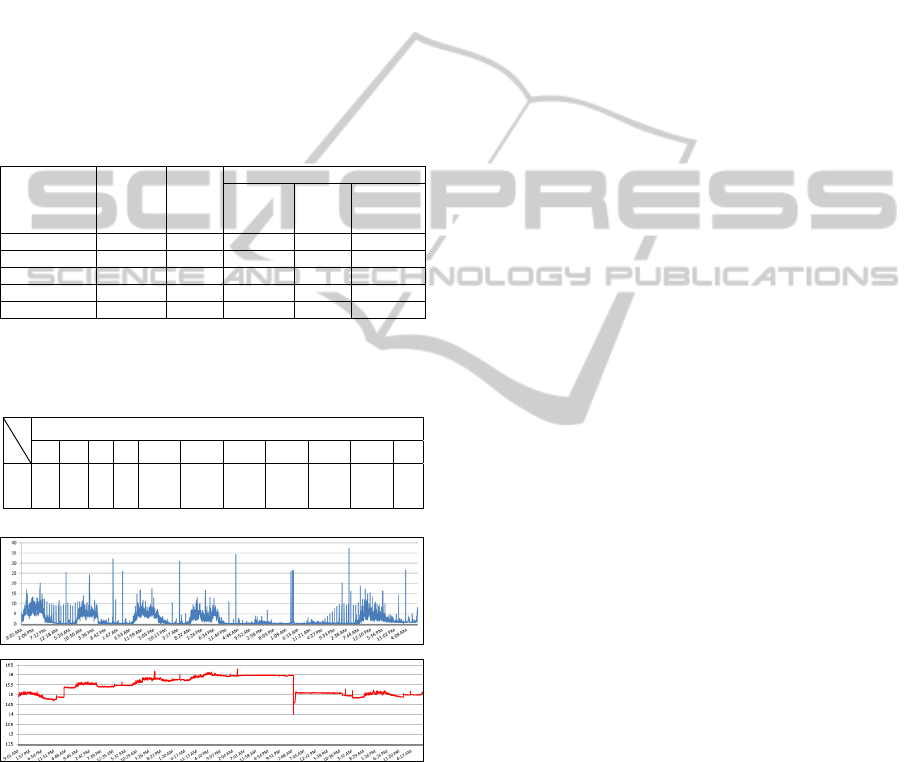
− Behavior of CPU and memory on VMs is
constructed from existing data shown in Figure 3.
This is the data monitored in some proxy server
for 7 days in January, 2012. A sampling interval
is 10 seconds. The specification of CPU used by
the proxy server is “Intel Xeon X5570 with
2.93GHz” (4 cores), which provides a capability
of processing 46880 MIPS, and the maximal
amount of memory is 5.12GB. The data is
separated into 28 pieces (4 pieces/day * 7 days),
and each piece is allocated to 28 VMs
respectively as the load of CPU and memory of
them.
Table 1: Specification of 11 hosts and 28 VMs. “MIPS” in
the table is an abbreviated word of Million Instructions
Per Second.
Machine
CPU
(MIPS)
Memory
(GB)
Power
Min
(W)
Max
(W)
Power
Efficiency
(MIPS/W)
Host 0, 1 105000 12 500 600 175.00
Host 2, 3, 4 160000 18 1000 1200 133.33
Host 5 ,6, 7 160000 18 900 1100 145.45
Host 8, 9, 10 105000 12 400 650 161.54
VM 0, 1,,,27 46880 5.12 - - -
Table 2: Initial allocation of VMs on hosts: The numbers
in the table are related to their names like “Host 5”, “VM
10”.
Host
0 1 2 3 4 5 6 7 8 9 10
VM
0,1 2,3
4,5,
6
7,8,
9
10,11,
12
13,14,
15
16,17,
18
19,20,
21
22,23 24,25
26,2
7
Figure 3: CPU (top) and Memory (bottom) behavior of the
monitored proxy server: The horizontal axis shows the
monitored time for 7 days in January, 2012. The vertical
axis shows CPU or memory utilization expressed by
percentage.
− The interval length of the cloud management
server’s monitoring the behavior of CPU and
memory of 28 VMs is 20 seconds. The cloud
management server obtains two points of (time,
utilization) of CPU and memory data for each
interval.
− The prediction algorithm used in the experiment
is the linear regression. The parameters used in
the linear regression are “history window size”
and “prediction window size”.
− The history window size is a parameter on a
time length used for learning. It is fixed with 60
minutes, which means that historical data for 60
minutes in the past from the present time is used
for learning. This specific value is determined so
that the linear regression provides the smallest
MAPE value defined in equation (1) for the
whole dataset on CPU and memory.
Every time the cloud management server gets
additional data (two points of (time, utilization) of
data on CPU and memory) from the cloud
simulator, the learning process using the
historical data is carried out and the coefficients
of the linear function is updated.
− The prediction window size is a parameter on a
time length which describes how far in the future
direction the cloud management server performs
prediction. It is fixed with 5 minutes, which
means that the server predicts the CPU and
memory utilization of each VM in 5 minutes from
the present time. This specific value is chosen
because generally the linear regression can be
applied only to short time prediction and at least
several minutes are required to complete
migrating all the VMs from hosts to hosts and
turning off every unnecessary host.
− The cloud management server carries out the
optimization so that the CPU and memory
utilization of each host does not exceed 90% of
its capacity.
The experiment was performed for both of the
existing cloud management approach (“predictive
approach”), which handles only predictable VMs
and shared regions (Beloglazov et al., 2010;
Beloglazov et al., 2011; Okitsu et al., 2010; Mehta et
al., 2011), and the new approach proposed in this
paper (“hybrid approach”). Their rates of SLA
violations and their amounts of power consumption
were compared to each other.
An important parameter seen only in the hybrid
approach is the threshold value of MAPE, which
determines if each VM is predictable or not. If this
value is large (small), the number of predictable
VMs increases (decreases) and that of unpredictable
VMs decreases (increases). The effect of changing
this value was also evaluated.
Figure 4 shows the relation between the SLA
violation rate and the amount of power consumption.
CLOSER2012-2ndInternationalConferenceonCloudComputingandServicesScience
158
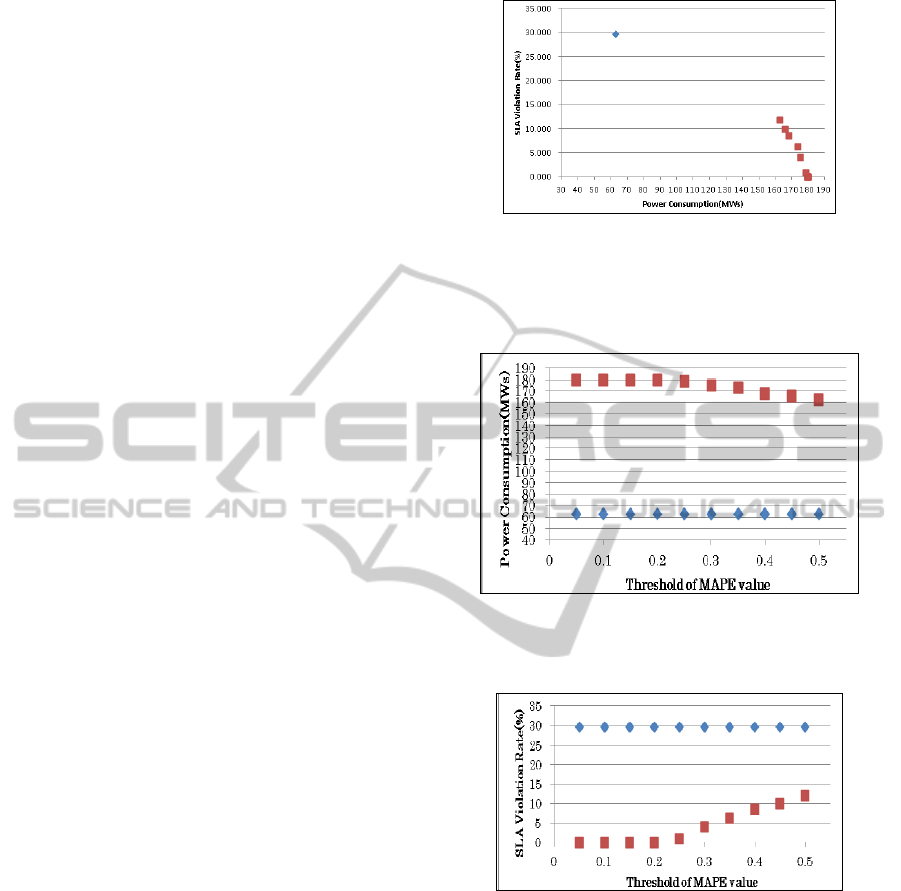
This graph is constructed by combining Figure 5 and
Figure 6. It is observed that the SLA violation rate
decreases when power consumption increases in the
hybrid-approach, which is the same relation as the
ones seen in the existing predictive-approach
(Beloglazov et al., 2010; Beloglazov et al., 2011;
Okitsu et al., 2010). Additionally it can be confirmed
that the hybrid-approach provides a much lower rate
of SLA violations than the predictive-approach,
while the former approach provides a much larger
amount of power consumption than the latter one.
The reason of the big difference between two
approaches is that the prediction algorithm (linear
regression) did not provide precise results enough to
this specific scenario. As a result, a large part of
VMs in the hybrid approach becomes unpredictable,
and most hosts in the hybrid-approach cannot be
turned down. The difference on power consumption
and SLA violation between the two approaches can
be reduced by using other prediction algorithms
which provide a more precise result of prediction,
although this paper doesn’t aim to provide a very
good prediction algorithm.
Figure 5 and 6 show how the amount of power
consumption and the SLA violation rate is affected
by changing the threshold value of MAPE. The
amount of power consumption in the predictive
approach is 62.6MWs, which is not affected by the
changing parameter. On the other hand, the amount
of power consumption in the hybrid-approach
changes from 179.6MWs to 162.3MWs when the
threshold value increases from 0.05 to 0.5. The SLA
violation rate in the predictive approach is 29.7%,
which is not affected by the changing parameter. On
the other hand, the SLA violation rate in the hybrid-
approach changes from 0% to 11.9% when the
threshold value increases from 0.05 to 0.5.
Especially, the result of Figure 6 shows that the
SLA violation rate in the hybrid-approach becomes
smaller than the one in the predictive approach, by
decreasing the threshold value of MAPE. When this
value becomes larger, a number of predictable VMs
relatively increases and as a result the hybrid
approach becomes closer to the predictive approach.
If the value is set to infinity, all VMs become
predictable VMs and the result in the hybrid
approach coincides with that in the predictive-
approach. An important observation is that the
hybrid approach enables cloud providers to have a
way of reducing SLA violation rates by any amount
without changing their prediction algorithms and
parameters used for them.
Figure 4: Relation between the power consumption and
the SLA violation rate (The square dots with red color in
the figures shows the results by hybrid-approach, and the
diamond-shaped dots with blue color shows the results by
predictive-approach).
Figure 5: Relation between the threshold of MAPE and the
power consumption (The meaning of colored dots is the
same as Figure 4).
Figure 6: Relation between the threshold of MAPE and the
SLA violation rate (The meaning of colored dots is the
same as Figure 4).
6 FUTURE DIRECTION
The experimental result provides that it is possible to
reduce a more number of SLA violations by
decreasing the threshold value of MAPE which is a
parameter to determine if VMs are predictable or
unpredictable. To evaluate this cloud management
strategy in more elaborate ways, it is necessary to
apply this into a real cloud environment, because
this paper uses the cloud simulator and creates hosts
CLOUDMANAGEMENTONTHEASSUMPTIONOFFAILUREOFRESOURCEDEMANDPREDICTION
159

as virtual objects. Additionally, since only CPU and
memory are monitored in the evaluation, it is
required to monitor I/Os as well to understand how
performance of network and disk accesses is
affected.
REFERENCES
Beloglazov, A., Buyya, R., 2010. Energy Efficient
resource Management in Virtualized Cloud Data
Centers. In 10
th
IEEE/ACM International Conference
on Cluster, Cloud and Grid Computing.
Petrucci, V., Loques, O., Mosse, D., 2010. A dynamic
optimization model for power and performance
management of virtualized clusters. In Proceedings of
the 1st International Conference on EnergyEfficient
Computing and Networking eEnergy.
Beloglazov, A., Abawajy, J., Buyya, R., 2011. Energy-
Aware Resource Allocation Heuristics for Efficient
Management of Data Centers for Cloud Computing. In
Future Generation Computer Systems.
Okitsu, J., Hirashima, Y., Asa, Y., Kato, T., Saito, T.,
2010. IT Workload Allocation Cooperative with Air
Conditioning System for Environment-Conscious Data
Center. In Forum Information Technology 2010 in
Japan, 2010, pp103-108.
Wu, L., Garg, S. K., Buyya, R., 2011. SLA-based
Resource Allocation for Software as a Service
Provider (SaaS) in Cloud Computing Environments. In
11th IEEE/ACM International Symposium on Cluster,
Cloud and Grid Computing.
Dasgupta, G., Sharma, A., Verma, A., Neogi, et al., 2011.
Workload Management for Power Efficiency in
Virtualized Data-Centers. In Communications of the
ACM.
Mehta, A., Menaria, M., Dangi, D., Rao, S., 2011. Energy
Conservation in Cloud Infrastructures. In IEEE
SysCon 2011, pp456-460.
Duy, T. V. T., Sato, Y., Inoguchi, Y., 2010. Performance
evaluation of a green scheduling algorithm for energy
savings in cloud computing. In Parallel Distributed
Processing, Workshops and Phd Forum (IPDPSW),
2010 IEEE International Symposium, pp.1-8.
Islam, S., Keung, J., Lee, K., Liu, A., 2010. An Empirical
Study into Adaptive Resource Provisioning in the
Cloud. In IEEE International Conference on Utility
and Cloud Computing UCC 2010
Transaction Processing Performance Council,
URL: http://www.tpc.org/tpcw/
Zhang, J., and Figueiredo, R.J., 2007. Adaptive Predictor
Integration for System Performance Prediction. In
Parallel and Distributed Processing Symposium, 2007.
IPDPS 2007. IEEE International, pp1-10.
Casolari, S., Colajanni, M., 2009. Short-term Prediction
models for server management in Internet-based
contexts. In Decision Support Systems 48, 2009,
pp212-223.
Casolari, S., Colajanni, M., 2010. On the Selection of
Models for Runtime Prediction of Systems Resources.
In Autonomic Systems, Springer, 2010, pp25-44.
Baryshnikov, Y., Coffman, E., Pierre, et al., 2005.
Predictability of Web-Server Traffic Congestion. In
the Tenth IEEE International Workshop on Web
Content Caching and Distribution, pp.97-103.
Buyya, R., Ranjan, R., Calheiros, R.N., 2011.
Modeling and Simulation of Scalable Cloud
Computing Environments and the CloudSim Toolkit:
Challenges and Opportunities. In Software: Practice
and Experience (SPE), Volume 41, Number 1, pp. 23-
50, Wiley Press.
Calheiros, R. N., Ranjan, R., Beloglazov, A., et al., 2011.
CloudSim: A Toolkit for Modeling and Simulation of
Cloud Computing Environments and Evaluation of
Resource Provisioning Algorithms. In Software:
Practice and Experience (SPE), Volume 41, Number 1,
pp. 23-50, Wiley Press.
CLOSER2012-2ndInternationalConferenceonCloudComputingandServicesScience
160
