
CFD in the Capillary Rheometry of Polyethylene Melts
Evan Mitsoulis
1
and Savvas G. Hatzikiriakos
2
1
School of Mining Engineering and Metallurgy, National Technical University of Athens, Zografou, Athens, Greece
2
Department of Chemical and Biological Engineering, The University of British Columbia, Vancouver, BC, Canada
Keywords: Capillary Rheometery, Polyethylenes, Entrance Pressure, Viscous.
Abstract: The capillary flow of a commercial LDPE melt was studied both experimentally and numerically. The
excess pressure drop due to entry (Bagley correction), the compressibility, the effect of pressure and
temperature on viscosity on the capillary data analysis have been examined. It was found that only the
viscoelastic simulations (using the K-BKZ constitutive relation) were capable of reproducing the
experimental data well, while any viscous modeling always underestimates the pressures, especially at the
higher apparent shear rates and L/D ratios.
1 INTRODUCTION
Capillary rheometry is extensively used in both
industry and academia to assess the rheological
behaviour of polymer melts at high shear rates
(Dealy and Wissbrun, 1990). When such a flow is
used and the raw data are collected, a number of
important corrections should be applied before the
rheological data can be compared with
corresponding data from a rotational rheometer
(Laun 2003; 2004).
First, capillary flow involves flow through a
contraction of a certain angle, known as entrance
pressure or Bagley correction [Bagley, 1957]. This
pressure is required in order to calculate the true
shear stress. Many studies have previously attempted
to examine the origin of entrance pressure and its
prediction for low-density polyethylenes (LDPEs)
(Feigl et al., 1994); (Barakos and Mitsoulis, 1995a);
(Beraudo et al., 1996); (Guillet et al., 1996);
(Hatzikiriakos and Mitsoulis, 1996; 2003);
(Mitsoulis et al., 1998). Only just recently the
problem of predicting the Bagley correction for
LDPE was solved satisfactorily at extremely high
shear rates (up to 1000 s
-1
) for the first time (Ansari
et al., 2010) by taking into account the effect of
pressure on the viscosity.
The effect of pressure on the viscosity is very
important for some polymer melts, including LDPE.
Using capillary data from dies of various length-to-
diameter (L/D) ratios, the dependence of viscosity
on pressure can be assessed (Couch and Binding,
2000); (Park and Dealy, 2006); (Carreras et al.,
2006); (Son, 2009); (Aho and Syrjala, 2010); (Koran
and Dealy, 1999). As a first approximation, the
following Barus equation can be used to determine
the parameter,
p
β
, known as the pressure coefficient
of viscosity:
()
0
exp
pp
p
ηη β
=
(1)
where
η
is the viscosity at pressure p, and
0p
η
is
the viscosity at ambient pressure. For the LDPE (of
main interest in the present work) a value between
8
1.3 10
−
×
Pa and
8
4.9 10
−
×
Pa has been reported by
various authors (Liang, 2001); (Cardinaels et al.,
2007; Park et al., 2008).
The analysis of the dependence of viscosity on
pressure is complicated by viscous dissipation
(viscous heating) effects. Viscous heating in the
capillary extrusion of polymer melts has been the
subject of several reviews and studies over the past
decades (Winter, 1977); (Ybarra and Eckert, 1980);
(Dihn and Armstrong, 1982); (Milthorpe and
Tanner, 1987); (Mitsoulis et al., 1988); (Warren,
1988); (Ko and Lodge, 1991); (Rosenbaum and
Hatzikiriakos, 1997).
It is the main objective of this work to study the
capillary flow of a LDPE melt numerically and
experimentally by considering all possible capillary
effects, combined and separately. Namely, the
effects of Bagley correction, compressibility,
pressure dependence of viscosity, and viscous
heating will be considered in order to assess the
significance of each effect.
291
Mitsoulis E. and G. Hatzikiriakos S..
CFD in the Capillary Rheometry of Polyethylene Melts.
DOI: 10.5220/0003963602910296
In Proceedings of the 2nd International Conference on Simulation and Modeling Methodologies, Technologies and Applications (SIMULTECH-2012),
pages 291-296
ISBN: 978-989-8565-20-4
Copyright
c
2012 SCITEPRESS (Science and Technology Publications, Lda.)

2 EXPERIMETAL
The experimental data used in the present
simulations have been obtained for a typical LDPE
melt in order to address the effects of pressure,
temperature and compressibility on its capillary
flow.
The viscoelastic moduli were determined over a
wide range of temperatures from 130 to 230
o
C.
Master curves were obtained using the time-
temperature superposition principle (TTS), and the
results are presented at the reference temperature of
160
o
C. The polymer was also rheologically
characterized in simple extension using the SER-2
Universal Testing Platform from Xpansion
Instruments (Sentmanat, 2003).
An Instron capillary rheometer (constant piston
speed) was used to determine the entrance pressure
(known also as Bagley method) and the viscosity as
a function of the wall shear stress,
σ
W
, and apparent
shear rate,
3
/32 DQ
A
πγ
=
&
at 160
o
C, where Q is the
volumetric flow rate and D is the capillary diameter.
3 GOVERNING EQUATIONS
We consider the conservation equations of mass,
momentum and energy for weakly compressible
fluids under non-isothermal, creeping, steady flow
conditions. These are written as (Tanner, 2000);
(Mitsoulis and Hatzikiriakos, 2009):
()
0uu
ρρ
⋅∇ + ∇⋅ =
(2)
0 p
τ
=−∇ +∇⋅
(3)
2
:
p
Cu T k T u
ρτ
⋅∇ = ∇ + ∇
(4)
where
ρ
is the density,
u
is the velocity vector, p is
the pressure,
τ
is the extra stress tensor, T is the
temperature, C
p
is the heat capacity, and k is the
thermal conductivity. For a compressible fluid,
pressure and density are connected as a first
approximation through a simple linear
thermodynamic equation of state (Mitsoulis and
Hatzikiriakos, 2009):
()
0
1
c
p
ρρ β
=+
(5)
where
β
c
is the isothermal compressibility with the
density to be ρ
0
at a reference pressure p
0
(=0).
To evaluate the role of viscoelasticity in the
prediction of Bagley correction, it is instructive to
consider first purely viscous models in the
simulations. Namely, the Carreau-Yasuda model
was used to fit the shear viscosity data of the LDPE
melt. The Carreau-Yasuda model is written as:
1
0,
1(||)
C
n
C
α
α
ηη λγ
−
⎡
⎤
=+
⎣
⎦
&
(6)
where
η
0,C
is the Carreau zero-shear-rate viscosity,
λ
is a time constant, n
C
is the Carreau power-law
index, and
α
is the Yasuda exponent (=2 for the
simple Carreau model). The parameters of the model
are listed in Table 1.
Table 1: Parameters for Eq. 6 at 160
o
C.
Parameter Value
η
0,
C
617,230 Pa⋅s
λ
17.727 s
n
C
0.221
α
0.215
For the capillary flow simulations the effect of
pressure on viscosity can be taken into account by
multiplying the constitutive relation with a pressure-
shift factor, a
p
, defined by the Barus equation, that is
(Son, 2009); (Carreras et al., 2006):
()
0
exp
pP
p
ap
η
β
η
≡=
(7)
where
P
β
is the pressure coefficient and p is the
absolute pressure, as discussed above.
Viscoelasticity is included using the K-BKZ
equation proposed by Papanastasiou et al. (1983)
and modified by Luo and Tanner (1988):
exp
() + ( 1 )
( )+ ( ) d
t
N
k
k = 1
- k k
a
1t t
=
1 3 + I I
ttt
α
θλ λα β β
θ
∞
′
−
−
−−−
′′′
⎛⎞
⎜⎟
⎝⎠
⎡⎤
⎣⎦
∑
∫
τ
-1
C
C
-1
tt
CC
(8)
where λ
k
and a
k
are the relaxation times and
relaxation modulus coefficients, α and β are material
constants, and I
C
, I
C
-1
are the first invariants of the
Cauchy tensor
C
t
and its inverse C
t
-1
, the Finger
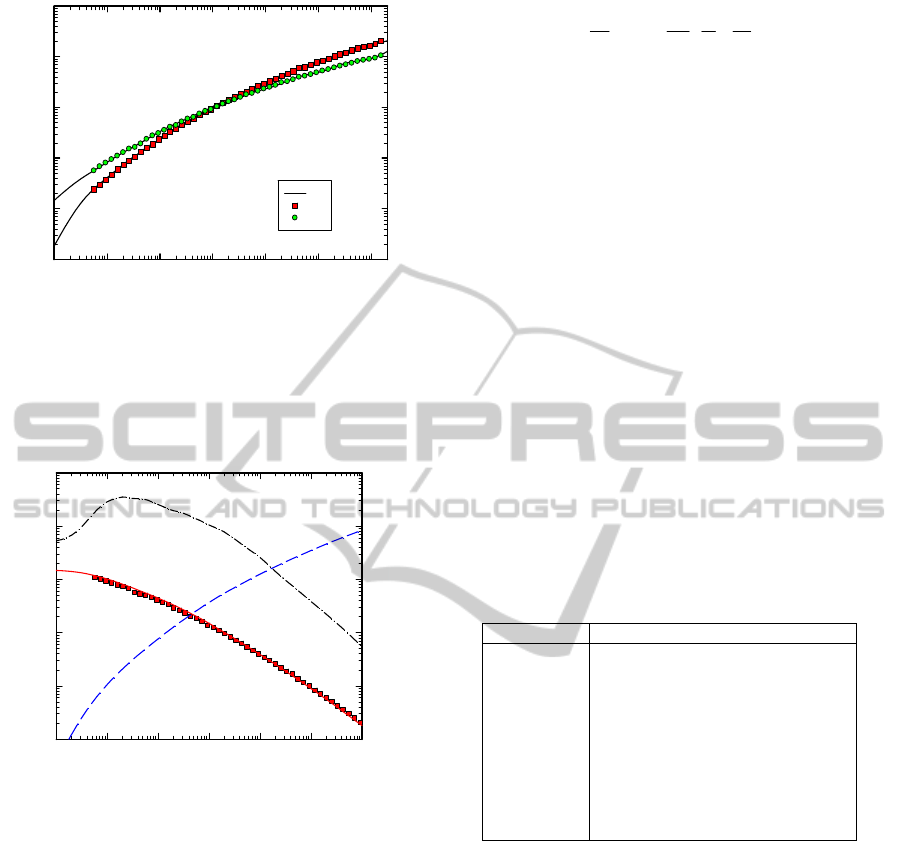
strain tensor. Figure 1 plots the master dynamic
moduli G' and G'' at 160
o
C and the model
predictions (Kajiwara et al., 1995). The parameters
are listed in Table 2.
Table 2: Parameters for the K-BKZ (Eq. 8) at 160
o
C.
α
=7.336
k
λ
k
(s )
a
k
(Pa)
β
k
1 1.28x10
-4
4.50x10
5
1
2 2.51x10
-3
98,795 1
3 2.06x10
-2
48,899 0.18
4 1.62x10
-1
22,089 0.45
5 1.224 8,842 0.049
6 6.733 3,397 0.026
7 43 948.5 0.024
8 248 287 0.014
SIMULTECH2012-2ndInternationalConferenceonSimulationandModelingMethodologies,Technologiesand
Applications
292
LDPE
T=160°C
Angular Frequency, ω (rad/s)
10
-3
10
-2
10
-1
10
0
10
1
10
2
10
3
Dynamic Moduli, G', G" (Pa)
10
1
10
2
10
3
10
4
10
5
10
6
Fit
G'
G''
Figure 1: Experimental and model predictions of G′ and
G′′ for the LDPE at 160
o
C.
Figure 2 plots a number of calculated and
experimental material functions for the LDPE melt
at the reference temperature of 160
o
C.
First Normal Stress Difference
,
N
1
(
Pa
)
Shear (Elongational) Rate,
γ (ε)
(s
-1
)
10
-3
10
-2
10
-1
10
0
10
1
10
2
10
3
Shear (Elongational) Viscosity,
η
S(E)
(Pa.s)
10
2
10
3
10
4
10
5
10
6
10
7
η
S
η
Ε
Ν
1
LDPE
T=160
o
C
.
.
Figure 2: Experimental data (solid symbols) and model
predictions of shear viscosity, η
S
, first normal stress
difference, N
1
, and elongational viscosity, η
E
, for the
LDPE melt at 160
o
C using the K-BKZ model (Eq. 12)
with the parameters listed in Table 3.
3.1 Non-isothermal Modeling
For the non-isothermal calculations it is necessary to
derive a non-isothermal constitutive equation from
the isothermal one. This has done by applying the
time-temperature shifting concept as explained by
Luo and Tanner (1987; 1988) and will not be
presented here. For LDPE melts, the following
temperature-shifting function has been found to be
adequate for the dependence of rheological
properties on temperature (Tanner, 2000);
(Meissner, 1975):
00
11
() exp
T
g
E
aT
RTT
η
η
⎡
⎤
⎛⎞
== −
⎢
⎥
⎜⎟
⎢
⎥
⎝⎠
⎣
⎦
(9)
In the above,
η
0
is a reference viscosity at T
0
, E is
the activation energy constant, R
g
is the ideal gas
constant, and T
0
is a reference temperature (in K).
The activation energy constant can be determined
from zero-shear-rate viscosity data (Meissner, 1975).
All these properties needed for the non-
isothermal simulations are gathered together in
Table 3.
4 METHOD OF SOLUTION
The solution to the above conservation and
constitutive equations is carried out with two codes,
one for viscous flows (u-v-p-T-h formulation) and
one for viscoelastic flows (Barakos and Mitsoulis,
1996); (Luo and Mitsoulis, 1990). The boundary
conditions for the problem can be found in our
earlier publications (Mitsoulis et al., 1998);
(Mitsoulis and Hatzikiriakos, 2003).
Table 3: Values of the various parameters for the LDPE
resin at 160
o
C.
Parameter Value
β
c
0.00095 MPa
-1
β
p
0.015 MPa
-1
m
0.65
1
GPa
p
n −
(0.11
1
MPa
p
n −
)
n
p
0.75
ρ
0.7828 g/cm
3
C
p
2.25 J/(g·K)
k 0.0017 J/(s·cm·K)
E 64,100 J/mol
R
g
8.3143 J/(mol·K)
T
0
160°C (433 K)
5 EXPERIMENTAL RESULTS
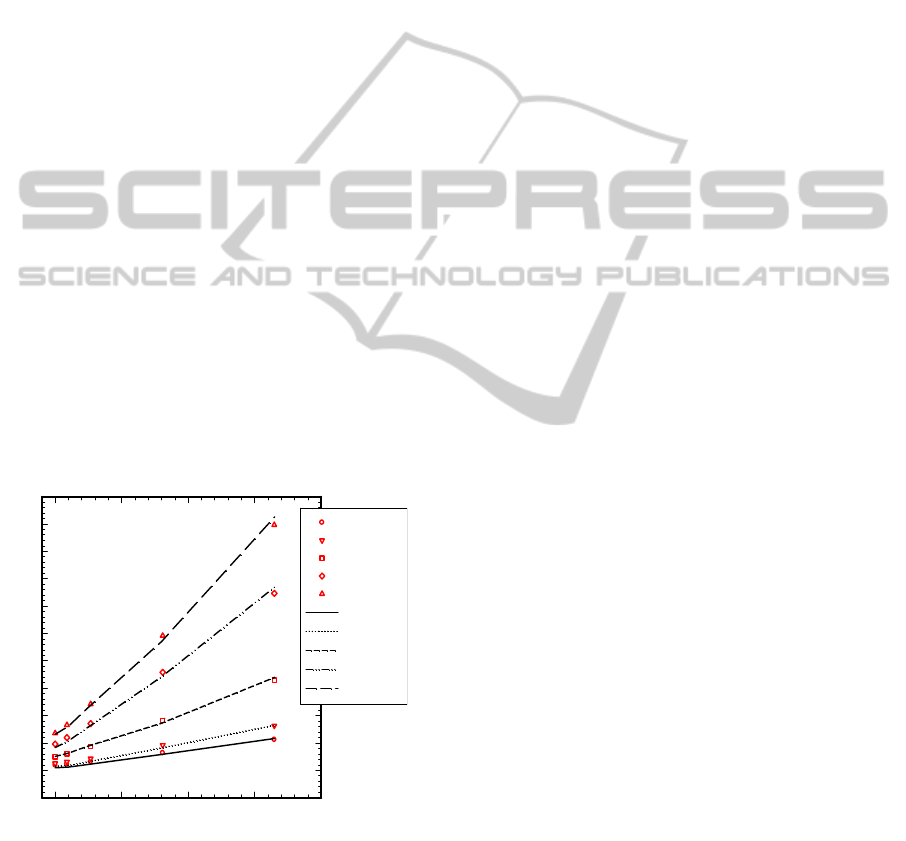
5.1 Entrance (End) Pressure
Figure 3 plots the entrance pressure (or end pressure
due to L/D=0) of LDPE at 160
o
C as a function of the
die length L/D for an extended range of values of the
apparent shear rate from 5 s
-1
to 1000 s
-1
. This plot is
also known as the Bagley plot. The data from an
orifice die are also plotted. The data show a
curvature with concavity pointing upwards
consistent with Eq. 1 (effect of pressure on
viscosity). These results are for a contraction angle
2
α
=90°.
CFDintheCapillaryRheometryofPolyethyleneMelts
293
L / D
0 10203040
Δ
P (MPa)
-5
0
5
10
15
20
25
30
35
40
45
50
γ
A
=5 s
-1
γ
A
=11 s
-1
γ
A
=64 s
-1
γ
A
=390 s
-1
γ
A
=1000 s
-1
γ
a
=5 s
-1
γ
a
=11 s
-1
γ
a
=64 s
-1
γ
a
=390 s
-1
γ
a
=1000 s
-1
LDPE,
T=160
o
C
symbols=exp.
Carreau lines
.
.
.
.
.
.
.
.
.
.
Figure 3: The effect of L/D on the pressure for the LDPE
melt at 160
o
C at various values of apparent shear rate (all
effects accounted for). Simulations with the Carreau-
Yasuda model (Eq. 6).
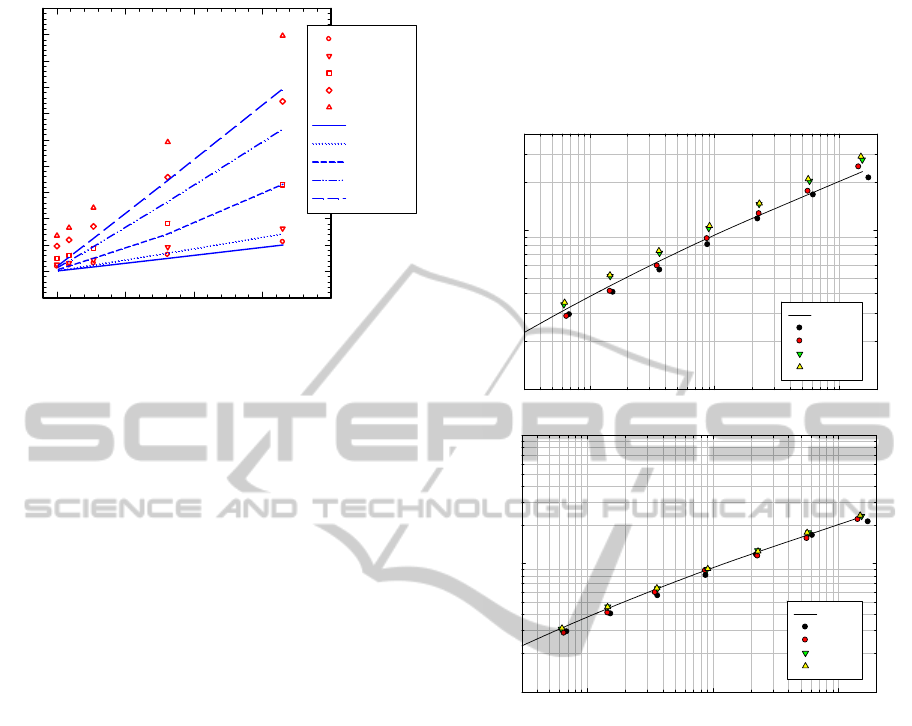
5.2 the Flow Curves
Figure 4a plots the flow curves of LDPE at 160
o
C
obtained with capillary dies having lengths of
L/D=2, 5, 16, and 33. The Bagley and Rabinowitsch
corrections have been applied to the data. Also
plotted are the linear viscoelastic data at 160
o
C,
which agree well with the data at L/D=2 and 5. The
data clearly shows that there is an effect of pressure
on viscosity. Using this set of data the
p
β
(which is a
shear-rate-dependent pressure coefficient) can be
obtained. In our case,
β
p
shows a power-law
dependency on pressure, according to the following
equation:
p
n
p
mp
β
−
=
(10)
where m=0.62
1
GPa
p
n −
and n
p
=0.75, with the
pressure p given in GPa. The pressure-corrected data
for the LDPE are plotted in Fig. 4b. The data
superposes well and the capillary data agrees well
with the LVE data.
6 NUMERICAL RESULTS
6.1 Viscous Modeling
It is instructive to perform first calculations with a
purely viscous model, so that the effect of
viscoelasticity will become evident later. The
numerical simulations have been undertaken using
the viscous Carreau-Yasuda model (Eq. 6). This
constitutive relation is solved together with the
conservation equations of mass and momentum
either for an incompressible or compressible fluid
under isothermal or non-isothermal conditions
(conservation of energy equation) with or without
the effect of pressure-dependence of the viscosity.
Shear Rate
(
s
-1
)
10
1
10
2
10
3
Wall Shear Stress (MPa)
10
-2
10
-1
LVE
L/D = 2
L/D = 5
L/D = 16
L/D = 33
T = 160°C
D = 0.787 mm
2α = 180°
Shear Rate
(
s
-1
)
10
1
10
2
10
3
Wall Shear Stress (MPa)
10
-2
10
-1
10
0
LVE
L/D=2
L/D=5
L/D=16
L/D=33
T = 160°C
D = 0.787mm
2α = 180°
β
p
(1/GPa)=0.62xP
-0.75
Figure 4: The flow curves of LDPE at 160°C determined
in capillary rheometry with dies having L/D ratios from 2
to 33. The data at the small L/Ds agree well with the LVE
data obtained from a rotational rheometer at ambient
pressure. The capillary data have been corrected by
applying both the Bagley and Rabinowitsch corrections
(top) and the effect of pressure on viscosity (bottom).
Collecting all the pressure results together for the
5 dies with L/D=0.2, 2, 5, 16, 33 and 5 apparent
shear rates
A
γ
&
gives in Fig. 3 the well-known
Bagley plot. The experimental results are shown as
symbols while the numerical results here and in the
subsequent graphs are shown as lines. The results
are below the experimental data, and this is mainly
due to the inability of a viscous model to capture the
end correction (for L/D=0). As it was found out in
[Ansari et al., 2010], a purely viscous model for
LDPE gives end corrections one order of magnitude
lower than the experimental ones. It is then at this
point that we turn our attention to the viscoelastic
results.
SIMULTECH2012-2ndInternationalConferenceonSimulationandModelingMethodologies,Technologiesand
Applications
294
6.2 Viscoelastic Modeling
It is again instructive to compare individual
distributions of pressure and temperature between
the viscous and the viscoelastic models. This is done
in Fig. 5, where we show the pressure results from
the K-BKZ models for the several pressure drops as
in Fig. 3. The viscoelastic pressures are markedly
higher than the viscous ones, and in fact they predict
the experimental data very well. More detailed
simulation results for various cases have shown that
the K-BKZ equation is capable of capturing all
important effects including the effects of
compressibility, pressure, viscous heating and
entrance pressure on the overall pressure required in
the capillary flow of LDPE.
7 CONCLUSIONS
A commercial low-density polyethylene melt
(LDPE) has been studied in entry flows through
tapered dies with different L/D ratios. The
experiments have shown a distinct pressure-
dependence of viscosity with a pressure coefficient
to be a power-law function of pressure. Full
rheological characterization was carried out both
with a viscous (Carreau-Yasuda) and a viscoelastic
(K-BKZ) model. All necessary material properties
data were collected for the simulations.
L / D
0 10203040
Δ
P (MPa)
-5
0
5
10
15
20
25
30
35
40
45
50
γ
A
=5 s
-1
γ
A
=11 s
-1
γ
A
=64 s
-1
γ
A
=390 s
-1
γ
A
=1000 s
-1
γ
A
=5 s
-1
γ
A
=11 s
-1
γ
A
=64 s
-1
γ
A
=390 s
-1
γ
A
=1000 s
-1
LDPE,
T=160
o
C
symbols=exp.
K-BKZ lines
.
.
.
.
.
.
.
.
.
.
Figure 5: The effect of L/D on the pressure for the LDPE
melt at 160
o
C at various values of apparent shear rate.
Non-isothermal simulations with the K-BKZ model with
pressure-dependence of the viscosity (variable
β
p
).
The viscous model was found to underestimate
the extrusion pressures. The viscoelastic model
showed a very good agreement with the
experimental results, which appears to be the first in
the literature for the elastic LDPE melt. The
simulations showed that: (a) compressibility is not
important in these steady flows; (b) viscous
dissipation is important, especially for the more
severe conditions (high L/D and apparent shear
rates); and (c) the pressure-dependence of viscosity
is very important and its correct function has to be
found experimentally. This is the first time that all
these effects are taken into account in a viscoelastic
simulation.
ACKNOWLEDGEMENTS
Financial assistance from the Natural Sciences and
Engineering Research Council (NSERC) of Canada
and the programme “PEBE 2009-2011” for basic
research from NTUA are gratefully acknowledged.
REFERENCES
Aho J., Syrjälä S., J. App. Polym. Sci., 117, 1076-1084
(2010).
Ansari M., A. Alabbas, E. Mitsoulis, S.G. Hatzikiriakos,
Intern. Polym. Proc., 25, 287-296 (2010).
Dealy, J. M., Wissbrun, K. F., Melt Rheology and its Role
in Plastics Processing - Theory and Applications, Van
Nostrand Reinhold, New York (1990).
Bagley, E. B., J. Appl. Phys., 28, 193-209 (1957).
Barakos, G., Mitsoulis, E., J. Non-Newtonian Fluid Mech.,
62, 55-79 (1996).
Barakos, G., Mitsoulis, E., J. Rheol., 39, 193-209 (1995a).
Barakos, G., Mitsoulis, E., J. Non-Newtonian Fluid Mech.,
58, 315-329 (1995b).
Béraudo, C., Coupez, T., Fortin, A., Demay, Y., Vergnes,
B., Agassant, J.-F., Proc. XIIth Int. Congr. Rheology,
Eds. A. Ait-Kadi, J.M. Dealy, D.F. James, M.C.
Williams, Quebec City, Canada, pp. 417-418 (1996).
Cardinaels R., Van Puyvelde P., Moldenaers P., Rheol.
Acta, 46, 495-505 (2007).
Carreras, E. S., El Kissi, N., Piau, J.-M., Toussaint, F.,
Nigen, S., Rheol Acta, 45, 209–222 (2006).
Couch M. A., Binding, D. M., Polymer, 41, 6323-6334
(2000).
Dinh, S. M., Armstrong, R. C., AIChE J., 28, 294-301
(1982).
Feigl, K., Öttinger, H. C., J. Rheol., 38, 847-874 (1994).
Guillet, J., Revenue, P., Béreaux, Y., Clermont, J.-R.,
Rheol. Acta, 35, 494-50 (1996).
Hatzikiriakos, S.G., Mitsoulis, E., Rheol. Acta, 35, 545-
555 (1996).
Laun H. M., Rheol. Acta, 42, 295–308 (2003).
Kajiwara, T., Barakos, G., Mitsoulis, E., Int. J. Polymer
Analysis & Characterization, 1, 201-215 (1995).
CFDintheCapillaryRheometryofPolyethyleneMelts
295

Ko, Y. S., Lodge, A. S., Rheol. Acta, 30, 357-368 (1991).
Koran F., and J. M. Dealy, J. Rheol., 43, 1279-1290
(1999).
Laun H. M., Rheol. Acta., 43, 509-528 (2004).
Liang J.-Z., Polymer, 42, 3709-3712 (2001).
Mitsoulis, E., Hatzikiriakos, S.G., Christodoulou, K.,
Vlassopoulos, D., Rheol. Acta, 37, 438-448 (1998).
Luo, X.-L., Tanner, R. I., Rheol. Acta, 26, 499-507
(1987).
Luo, X.-L., Tanner, R. I., Int. J. Num. Meth. Eng., 25, 9-22
(1988).
Luo, X.-L., Mitsoulis, E., Int. J. Num. Meth. Fluids, 11,
1015-1031 (1990).
Meissner, J., Pure Appl. Chem., 42, 551-612 (1975).
Milthorpe, J. F., Tanner, R. I., Int. J. Num. Meth. Engng.,
24, 263-270 (1987).
Mitsoulis, E., Wagner, R., Heng, F. L., Polym. Eng. Sci.,
28, 291-310 (1988).
Mitsoulis, E., Hatzikiriakos, S. G., J. Non-Newtonian
Fluid Mech., 157, 26-33 (2009).
Mitsoulis, E., Hatzikiriakos, S. G., Rheol. Acta, 42, 309-
320 (2003).
Park, H. E., Lim, S. T., Laun, H. M., Dealy, J. M.,
Macromolecules, 47, 1023-1038 (2008).
Park, H. E., Dealy, J. M., Macromolecules, 36, 5438-5452
(2006).
Papanastasiou, A. C., Scriven, L. E., Macosco, C. W., J.
Rheol., 27, 387-410 (1983).
Rosenbaum, E. E., Hatzikiriakos, S. G., AIChE J., 43,
598-608 (1997).
Sentmanat, M. L., Goodyear Co., U.S. Patent No.
6,578,413 (2003).
Son, Y., J. Polym. Res., 16, 667-671 (2009).
Tanner, R. I., “Engineering Rheology”, 2
nd
Edition,
Oxford University Press, Oxford, UK (2000).
Ybarra, R. M., Eckert, R. E., AIChE J., 26, 751-762
(1980).
Warren, R. C., Viscous Heating. Rheological
Measurement, Elsevier, London, 119-149 (1988).
Winter, H. H., Adv. Heat Transfer, 13, 205-267 (1977).
SIMULTECH2012-2ndInternationalConferenceonSimulationandModelingMethodologies,Technologiesand
Applications
296
