
Modeling the Performance and Scalability of a SAP ERP System
using an Evolutionary Algorithm
Daniel Tertilt
1
, André Bögelsack
1
and Helmut Krcmar
2
1
fortiss GmbH, An-Institut der Technischen Universität München, Guerickestr. 25, 80805 München, Germany
2
Technische Universitaet Muenchen, Boltzmannstraße 3, 85748 Garching, Germany
Keywords: Performance, Modeling, ERP, Synthetic Benchmark, Evolutionary Algorithm.
Abstract: Simulating the performance behavior of complex software systems, like Enterprise Resource Planning
(ERP) systems, is a hard task due to the high number of system components when using a white box
simulation approach. This paper utilizes a black box approach for establishing a simulation model for SAP
ERP systems on the basis of real world performance data, which is gathered by using a synthetic
benchmark. In this paper we introduce the benchmark, called Zachmanntest, and demonstrate that by using
an evolutionary algorithm basing on the results of the Zachmanntest, the exact performance behavior of the
ERP system can be modeled. Our work provides insights on how the algorithm is parameterized e.g. for the
mutation and crossover probability, to receive optimal results. Furthermore we show that the evolutionary
algorithm models the performance and scalability of an ERP system with an error less than 3.2%. With this
approach we are able to build simulation models representing the exact performance behavior of a SAP ERP
system with much less effort than required when using a white box simulation approach.
1 INTRODUCTION
The performance of an enterprise SAP ERP system
is a business critical factor, as the ERP system often
builds the basis for many semi-automated business
processes. The throughput and response time of the
ERP system determines how fast the business
operations can be performed. Any change on the
ERP system in hardware, software or user behavior
is a business critical action.
Software performance prediction is an approach
to reduce the risk of bad system performance after
such a change. Simulation approaches like layered
queuing networks (Franks et al., 2009) are
conventionally used to predict the performance
behavior of SAP ERP systems (Sithole et al., 2010).
Simulation approaches though require an insight into
the system (white box approach), which is not
always given. The white box approach becomes
more hardly to handle, when more than 60,000 SAP
ERP system’s components have to be represented in
an appropriate simulation model. Besides, existing
models often only assume the performance behavior
of the components (for example an exponential
function), which leads to incorrect simulation
results. In order to avoid incorrect simulation models
and results, a black box approach might be used
first.
This paper uses a black box approach for
creating a simulation model based on performance
data from a real-world SAP ERP system. We strictly
follow the proposed simulation way of Jain (Jain,
1991), where any simulation should be based on
reliable performance data. The appropriate
performance data set is gathered by executing a
synthetic benchmark, called Zachmanntest
(Bögelsack et al., 2010). We follow the black box
approach by executing the test from outside of the
SAP ERP system and only record the performance
results. Applying a white box approach to the
analyzed SAP ERP system would be possible too,
but very costly due to the system’s complexity. The
results of the black box approach are then used to
build up the simulation model. Whenever though
this data is used as input to a subsequent system like
a simulation engine, it has to be transformed into a
mathematical model. An algorithm that exactly
solves the mathematical modeling for any given set
of data is highly complex, resulting in an
inacceptable execution time. To avoid this execution
time we use a model approximation using an
evolutionary algorithm. As long as the
112
Tertilt D., Bögelsack A. and Krcmar H..
Modeling the Performance and Scalability of a SAP ERP System using an Evolutionary Algorithm.
DOI: 10.5220/0003971001120118
In Proceedings of the 14th International Conference on Enterprise Information Systems (ICEIS-2012), pages 112-118
ISBN: 978-989-8565-10-5
Copyright
c
2012 SCITEPRESS (Science and Technology Publications, Lda.)

approximation error is less than the estimated
measurement error, the approximation does not
negatively affect the exactness of the subsequent
system. This paper proves that evolutionary
algorithms can be used to establish a model
representing the performance behavior of a SAP
ERP system under different configurations and
workloads. We describe the model approximation
we performed on the results of the Zachmanntest,
using our evolutionary algorithm implementation
Mendel. Our research shows what affects the
efficiency of the algorithm, and how it has to be
configured to obtain best results. In addition we
depict the modeling results and interpret the
usability of evolutionary algorithms for black box
ERP performance prediction.
The rest of the paper is organized as follows:
section 2 provides an overview about related work in
the field of performance simulation of ERP systems
and the usage of evolutionary algorithms for the
purpose of performance modeling. Section 3
describes the background and functionality of the
Zachmanntest in detail. The explanation of the
evolutionary algorithm and the establishment of it
are explained in section 4. Section 5 summarizes the
paper and provides an outlook.
2 RELATED WORK
Exploring related work in the area of modeling and
simulating SAP ERP systems should be divided into
two subareas: 1) the application of any modeling and
simulation approach to SAP ERP systems and 2) the
application of evolutionary algorithms to the IS field
for any modeling or simulation purpose.
Regarding the first subarea there are several
papers available, all dealing with the common
problem of how to simulate a SAP ERP system,
which consists of more than 60,000 programs.
Modeling the performance of SAP ERP system is
firstly mentioned in (Bögelsack et al., 2008),
whereas the authors state out how they would tackle
the modeling problem of a complex software
product like SAP ERP system. The approach is
afterwards extended in (Gradl et al., 2009). Here a
concrete modeling approach called Layered Queuing
Network (LQN) is used and a first model is
populated manually with performance measurement
data and simulated afterwards. The same approach
of utilizing LQN is used in (Rolia et al., 2009) to
show the appropriateness of the LQN approach.
Further research of the authors lead to (Rolia et al.
2010), where a resource demand estimation
approach is presented.
In the area of applying evolutionary algorithms
to a IS-related problems, first papers are published in
the area of logistic problems, e.g. for the pallet
loading problem as in (Herbert/Dowsland 1996).
However, applying evolutionary algorithms in the
area of simulation and especially performance
simulation is very common. (Tikir et al., 2007)
shows the application of evolutionary algorithms in
the field of High Performance Computing. In
(Justesen 2009) a simulation model combined with
an evolutionary algorithm to find optimal processing
sequences for two cluster tools from the wafer
manufacturing.
3 PERFORMANCE
MEASUREMENT AND
WORKLOAD CREATION
Following the ideas of (Jain, 1991) and (Law, 2008)
every simulation must be either based on or
validated by performance measurement results and
obtaining data from real-world applications is the
best case for this. Generally spoken, application and
synthetic benchmarks can be used to obtain valuable
performance results. In this chapter we explain a
synthetic benchmark, called Zachmanntest, which is
used to gather performance results. Those results
form the basis of our simulation model and
algorithm.
3.1 Application and Synthetic
Benchmark
Measuring the performance of SAP ERP systems is
a hard task as there are two different perspectives of
how to measure the performance and how to
implement a measurement process. First, the usage
of so called application benchmarks is proposed.
Application benchmarks contain a sequence of
typical application usage steps. An exemplary step
would be the creation of a customer order or a
production order. The set of typical application
usage steps form the application benchmark, which
is then somehow instrumented with a performance
metric, e.g. the number of created production orders.
The most commonly known application benchmark
in the sector of SAP ERP systems is the sales and
distribution benchmark (SD benchmark).
Application benchmarks are used very often, which
can be proven by the large number of available SD-
ModelingthePerformanceandScalabilityofaSAPERPSystemusinganEvolutionaryAlgorithm
113

benchmark results (see (SAP, 2010)). One drawback
of application benchmark is that they are hard to
implement and need a huge testing environment.
Second, the usage of synthetic benchmarks is
proposed for measuring the performance of a SAP
ERP system. The synthetic approach derives from
the need of testing the performance of a very
specific element in the SAP ERP system. A
synthetic benchmark is a set of elementary
operations in the SAP ERP system
(Curnow/Wichmann, 1976). For example, applying
a TPC-benchmark for measuring the performance of
the underlying database system, is a popular
approach to get an understanding of the system’s
performance (Doppelhammer et al., 1997). One
drawback of any synthetic benchmark is that the
benchmark is very focused. However, the major
advantage is, that a synthetic benchmark can be
easily applied to the system and performance results
can be gained quickly.
In this paper we utilize a synthetic benchmark to
measure the performance and scalability of a SAP
ERP system. We chose the synthetic benchmark,
because it is easy to apply to the SAP ERP system, it
gains the necessary results for our simulation
approach and the benchmark steps are transparent to
us.
3.2 Zachmanntest – A Synthetic Main
Memory Benchmark
3.2.1 Zachmanntest: Architecture
The Zachmanntest consists of two Advanced
Business Application Programming (ABAP)
programs. The first program is an easy to use entry
mask to specify the test execution parameters. The
second one is the ultimate test executable, which
produces a lot of main memory operations in the
application server. In fact, those main memory
operations are operations on so called internal tables.
Each program of the SAP ERP system, which is
somehow interacting with the database management
system and stores/reads data from it, uses this
concept. From our point of view, this operation is a
universal one and therefore a suitable example for a
synthetic benchmark. A synthetic benchmark
requires a specific sequence of operations/programs
to be executed during runtime (Curnow and
Wichmann, 1976). This is achieved by specifying
the following steps during the execution. Please note
that we used pseudo-code instead of ABAP
statements:
1:While time < max_run
2: Create internal table
3: Fill internal table with data
4: While iteration <loop_cnt
5: Randomly select data set
6: Read selected data set
7: Increase throughput counter
8: Endwhile
9: Delete internal table
10:Endwhile
11:Print throughput counter
The value max_run defines the runtime (default: 900
seconds) after which the execution of the
Zachmanntest is aborted. The value loop_cnt
(default: 1,000,000) defines a numerical value for
how often the internal table should be cycled. By
executing the entire Zachmanntest, one instance of
the test executable is instantiated. The Zachmanntest
produces a heavy main memory load on the
application server.
3.2.2 Performance Metric
The Zachmanntest is meant to quantify the
performance of the underlying main memory system
from a SAP perspective. Generally, there are several
performance metrics available, e.g. response time
metrics or throughput metrics. The performance
metric of the Zachmanntest is throughput, measured
in rows per seconds. For example, after finishing
one run of one Zachmanntest, the throughput of the
SAP ERP system results in about 9,000 rows per
second. This metric is to be interpreted as follows: in
the case of one instantiated benchmark in the SAP
ERP system, approx. 9,000 rows per second can be
accessed for this benchmark instance. When
handling two benchmark instances at the same time
(we refer to them as two Zachmanntests) the
throughput might be less or equal. This is because
the maximum available throughput will be shared
between both Zachmanntests.
The throughput metric is the best metric for the
purpose of our simulation, as it can be easily applied
to the simulation model. The throughput is
expressed in a very simple numerical only way.
Thus it can be applied to our simulation without the
need of any transformation or mathematical
operation.
ICEIS2012-14thInternationalConferenceonEnterpriseInformationSystems
114

4 MODELING THE
PERFORMANCE USING
EVOLUTIONARY
ALGORITHMS
The next step after measuring the performance of the
ERP system using the Zachmanntest is to make the
measured data usable for performance and
scalability prediction. For this, the measured data
has to be transformed into a mathematical model.
For multi-dimensional data, an exact solution
becomes very complex in terms of the model size
and solution determination, making it unusable for
simulation approaches. Furthermore there is no
guarantee that exactly one optimal model exists for
the measured performance data – several Pareto-
optimal solutions might be possible (Zitzler and
Thiele, 1999) when factors like the model length and
evaluation time are considered. To limit the
maximum model size, as well as to reduce the time
for solution determination, an evolutionary
algorithm is used to approximately model any given
set of performance data.
4.1 Description of the Evolutionary
Algorithm Approach
The basic idea behind any evolutionary algorithm is
the imitation of Darwin’s idea of natural evolution.
The best individuals or genomes of a generation
survive and reproduce. Hence, an evolutionary
algorithm is a random search method performing
multi-criteria optimization on an n-dimensional
search area. The algorithm consists of multiple
individuals, competing on a limited resource. The
algorithm performs several iterations, each resulting
in a new generation of individuals. A fitness
function is used to determine every individual’s
fitness, resulting in the decision if an individual is
allowed to pass its genome to the next generation or
not. Mutation and crossover is performed whenever
a genome is passed to a new generation’s individual,
allowing moving or jumping in the search area.
In our actual prototype Mendel (named after the
researcher Gregor Johann Mendel), the limited
resource is the fixed size of individuals and the rule
that 50% of the individuals are passed to the next
generation, while new individuals replace the other
50%. The fitness of an individual is defined by the
negative geometrical distance of the generated
model from the underlying measured performance
data. An error value
is calculated as defined in
formula 1, with
being the i
th
measured
value,
the ith modeled value, and n the
number of measured performance values. Simply
saying, an individual is fitter than another if its
model fits closer to the measured data (i.e. the model
has a smaller error value
).
s
=
∑
r
r
r
n
4.2 Model Representation and
Mathematical Operators
The model of an individual is stored in a genome
structure. Every odd element in the genome is either
a fixed number, or a parameter, and every even
element is an operator. The genome is interpreted
from right to left, assuming a right bracketing.
Figure 1 is a visualization of the exemplary
model a+
(∗)
with a, b, c being fixed
numbers and x, y, z parameters.
A + x / b ^ y - sin c * z
Figure 1: Genome coding of an exemplary model.
4.3 Configuration of the Evolutionary
Algorithm
The performance and efficiency of the evolutionary
algorithm is strongly dependent on its configuration
(Zitzler/Thiele, 1999). Commonly used
configuration parameters are shown in Table 1.
Table 1: Configuration parameters of the evolutionary
algorithm.
Parameter Description
Population
Size
The number of individuals. Larger
population size results in higher model
variance, but also increases the resource
usage per iteration.
Genome
Length
The length of the genome. Longer genomes
result in more complex models.
Mutation
Probability
The probability for mutation when a model
is passed to the next generation.
Crossover
Probability
The probability for crossover when a model
is passed to the next generation.
For identifying the optimal configuration for
modeling the given performance data we carried out
five calculations for every combination of
configuration parameters, interrupted the
evolutionary algorithm after five minutes, and
compared the resulting models. As the evolutionary
algorithm is a non-deterministic algorithm, we
ModelingthePerformanceandScalabilityofaSAPERPSystemusinganEvolutionaryAlgorithm
115
compared the median value of the five calculations
per configuration.
4.3.1 Population Size and Genome Length
Population size defines the number of parallel
threads that are used for modeling, while the genome
length defines the length of the model. Both
parameters are correlated, as they both affect the
resource usage of the evolutionary algorithm. A
bigger population requires to evaluate and pass more
models per iteration, while the genome length
determines the required CPU cycles to evaluate and
the memory to store the model.
To get an indication for an appropriate
population size range we performed the modeling
with 100, 1,000, 5,000, 10,000 and 20,000
individuals. The results of this first iteration showed
that a population size bigger than 5,000 does not
provide usable results on the given hardware
configuration.
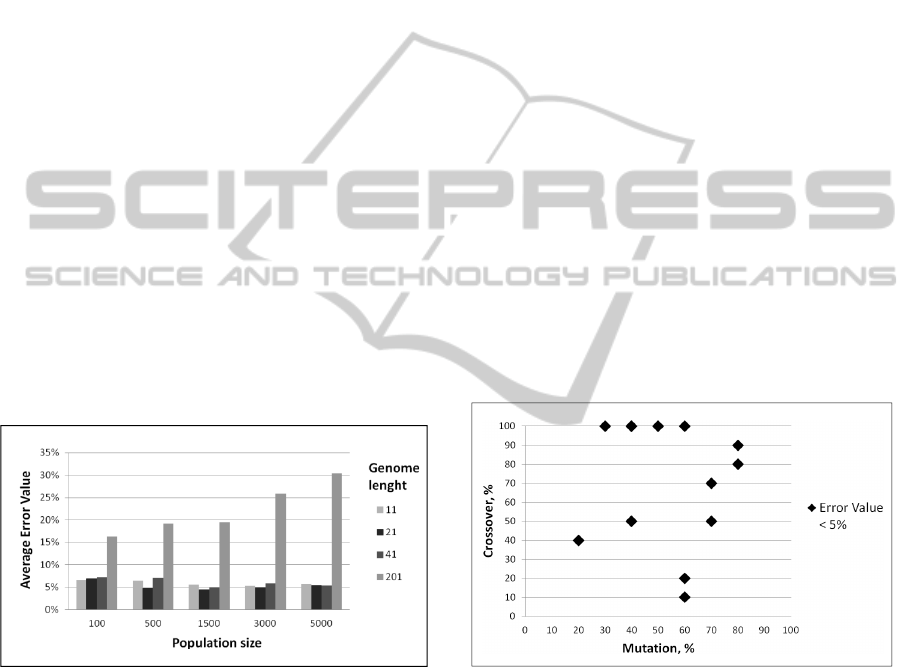
The same ranging was done for the genome
length. Modeling was performed for 11, 21, 41 and
201 genome length, showing that a genome longer
than 41 elements is not performing in the given
context. Figure 2 depicts the average modeling error
for all combinations of population size and genome
length.
Figure 2: Effect of population size and genome length on
modeling accuracy.
Higher population size results in more modeling
variation, which again results in a higher chance of
the model converging to the measured data. The
optimal population size though is determined by the
number of available CPUs. Too big populations (in
our case > 3,000 individuals) result in increased wait
times, reducing the efficiency of the algorithm.
From the data presented in the diagram it is
obvious that a too long genome also reduces the
modeling accuracy. On the one hand this inaccuracy
is caused by a reduced number of iterations
performed in the given timeframe due to an
increased resource need for the model evaluation.
On the other hand an analysis of intermediate result
revealed that with a long genome mutation becomes
inefficient. In every iteration mutation changes one
genome element. However, the longer a genome is
the higher is the chance that it contains elements
with small effects. Hence the possibility of
mutations advancing the model noticeably is
decreased. Short genomes though reduce the model
flexibility, inhibiting the approximation of complex
measured data. For the given ERP data a population
size of 1,500 or 3,000, and a genome length of 21
proved to return the best results.
4.3.2 Mutation and Crossover Probability
Mutation and crossover, as defined by Goldberg
(1989), build the random searching operations of the
evolutionary algorithm. Both operations are
performed with a given probability when a model is
passed to a new generation. To determine the effect
of the mutation and crossover probability the
average error value is compared for each
combination of mutation and crossover probability.
Figure 3 shows all the combinations resulting in an
average modeling error value of less than five
percent.
Figure 3: Effect of mutation and crossover probability on
modeling accuracy.
It is obvious that high crossover or mutation
probability leads to accurate models. Zero or small
mutation probability (< 20%) avoids convergence
towards an optimum, while zero or small crossover
probability restricts the jumping in the search area,
forces the algorithm to getting caught in a local
optimum.
4.4 Modeling Results
Given the correct configuration, the evolutionary
algorithm results in models approximating very
ICEIS2012-14thInternationalConferenceonEnterpriseInformationSystems
116
close the given scalability data. In our case study the
model fits to the given data with an error smaller
than four percent.
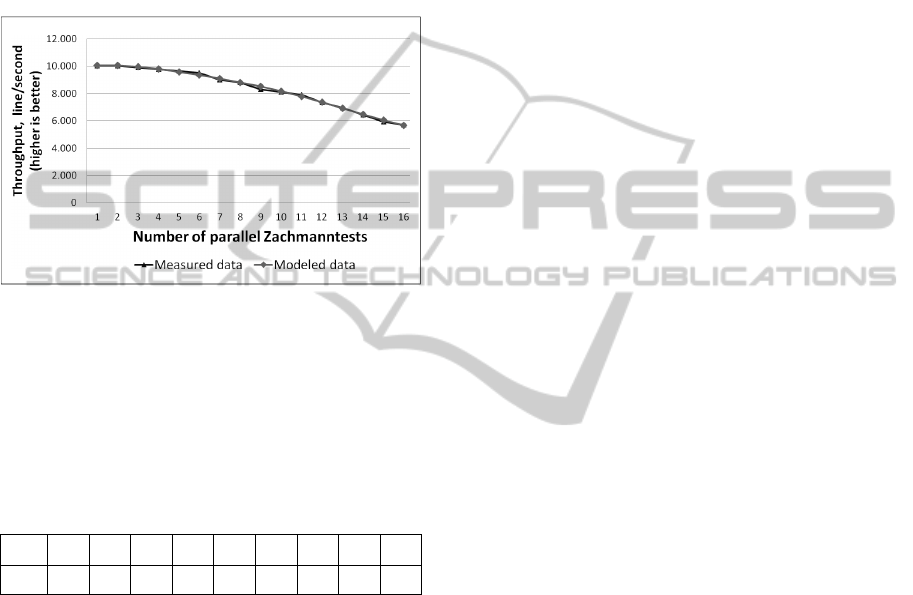
Figure 4 visualizes the modeled scalability data
compared to the measured data for an ERP system
configured with 12 work processes. It is visible that
the model comes very close to the measured data.
Providing the presented model the evolutionary
algorithm achieved an error of less than 0.7 percent,
in a modeling time of five minutes.
Figure 4: Comparison of measured and modeled data for
12 workflow processes.
Table 2 shows the error values (EV, in percent)
of all work process (WP) configurations. For each
configuration, modeling was performed for exactly
five minutes.
Table 2: Modeling error values for all measured work
process configurations.
WP 6 7 8 9 10 11 12 13 14
EV 2.2 3.2 2.8 0.9 1.7 1.2 0.7 2.0 1.4
Compared to other works in the field of
evolutionary algorithms (see (Tikir et al. 2007) for
example), our reached error values are very low.
Hence, we rate our gained error values as very good
ones.
5 CONCLUSIONS AND FUTURE
WORK
5.1 Conclusions
This paper presents our black box approach to create
a simulation model, which is based on an
evolutionary algorithm and real world performance
data from a SAP ERP system. The presented results
show that, given the correct configuration,
evolutionary algorithms perform well in modeling
scalability data of ERP systems with an error value
under 3.2%. The modeling error of approximately
two percent is less than the assumed measurement
error, and thus acceptable. A negative side of the
non-determinism of the evolutionary algorithm is
that an acceptable model is only found in
approximately ninety percent of all modeling runs in
an acceptable time, while in the other cases the
algorithm takes hours to result in a usable model.
This effect is independent on the given performance
data but results from the random model generation
and mutation. We neglected the effect by setting a
timeout, after which the algorithm was restarted.
One of the biggest benefits of using the
evolutionary algorithm proved to be its ability to
model any kind of data without being adopted. This
characteristic allows the modeling of multiple sets of
data automatically without any manual effort, and
allows the integration of the algorithm into an
automatic scalability and performance prediction
framework, bridging for example from the measured
scalability and performance data to the simulation
engine.
5.2 Future Work
This paper shows how to use the black box approach
for modeling a very complex SAP ERP system in a
first step. However, such a software system must be
modeled in a more detailed way. Thus our goal is to
extend the simulation model with more components
and to use real life monitoring data to establish an
evolutionary algorithm, which is able to reproduce
the exact performance behavior of the entire system.
Evolutionary algorithms as implemented in our
prototype Mendel, suite well in modeling the
performance and scalability data when the data is
equally distributed. When an equal distribution is
not given, the used fitness function might result in a
model not representing properly the scalability of the
ERP system. This might be the case if, for example,
a big data set is available for low load, but only few
data for high load. Then a well matching model for
all the low load data, not matching the high load
data, might result in a good fitness value. This effect
will be neglected by implementing clustering of the
scalability data and solving each cluster on its own.
Future work will also be to identify the optimal
configurations of the evolutionary algorithm for
different usage scenarios. As presented in this paper
the configuration strongly affects the modeling error
and the time the algorithm needs to finish.
ModelingthePerformanceandScalabilityofaSAPERPSystemusinganEvolutionaryAlgorithm
117

REFERENCES
Bögelsack, A., Jehle, H., Wittges, H., Schmidl, J., Krcmar,
H., 2008. An Approach to Simulate Enterprise
Resource Plannung Systems. 6th International
Workshop on Modelling, Simulation, Verification and
Validation of Enterprise Information Systems.
Barcelona, Spain.
Curnow, H., Wichmann, B., 1976. A synthetic benchmark.
In: The Computer Journal, Vol. 19 No. 1, pp. 43.
Doppelhammer, J., Höppler, T., Kemper, A., Kossmann,
D., 1997. Database performance in the real world:
TPC-D and SAP R/3. Proceedings of the 1997 ACM
SIGMOD international conference on Management of
data. Tucson, Arizona, United States: ACM.
Goldberg, D. E., 1989. Genetic algorithms in search,
optimization, and machine learning, Addison-Wesley
Professional, Upper Saddle River, NJ, USA.
Gradl, S., Bögelsack, A., Wittges, H., Krcmar, H., 2009.
Layered Queuing Networks for Simulating Enterprise
Resource Planning Systems. 6th International
Workshop on Modelling, Simulation, Verification and
Validation of Enterprise Information Systems. Milano,
Italy.
Herbert, E., Dowsland, K., 1996. A family of genetic
algorithms for the pallet loading problem. In: Annals
of Operations Research, Vol. 63 No. 3, pp. 415-436.
Jain, R., 1991. The Art of Computer Systems Performance
Analysis: Techniques for Experimental Design,
Measurement, Simulation, and Modeling: Techniques
for Experimental Design, Measurement, Simulation
and Modelling, John Wiley & Sons, Inc.
Justesen, P. D., 2009. Multi-objective Optimization using
Evolutionary Algorithms. Department of Computer
Science, University of Aarhus.
Law, A. M., 2008. How to build valid and credible
simulation models. Proceedings of the 40th
Conference on Winter Simulation (pp. 39-47). Miami,
Florida: Winter Simulation Conference.
Rolia, J., Casale, G., Krishnamurthy, D., Dawson, S.,
Kraft, S., 2009. Predictive modelling of SAP ERP
applications: challenges and solutions. Proceedings of
the Fourth International ICST Conference on
Performance Evaluation Methodologies and Tools
(pp. 1-9). Pisa, Italy: ICST (Institute for Computer
Sciences, Social-Informatics and Telecommunications
Engineering).
Rolia, J., Kalbasi, A., Krishnamurthy, D., Dawson, S.,
2010. Resource demand modeling for multi-tier
services. Proceedings of the first joint WOSP/SIPEW
international conference on Performance engineering
(pp. 207-216). San Jose, California, USA: ACM.
SAP, 2010. SAP Standard Application Benchmarks.
http://www.sap.com/solutions/benchmark/index.epx,
accessed at 12.3.2010.
Tikir, M. M., Carrington, L., Strohmaier, E., Snavely, A.,
2007. A genetic algorithms approach to modeling the
performance of memory-bound computations.
Proceedings of the 2007 ACM/IEEE conference on
Supercomputing (pp. 1-12). Reno, Nevada: ACM.
Zitzler, E., Thiele, L., 1999. Multiobjective Evolutionary
Algorithms: A Comparative Case Study and the
Strength Pareto Approach. In: IEEE Transactions on
Evolutionary Computation, Vol. 3 No. 4, pp. 257 -
271.
ICEIS2012-14thInternationalConferenceonEnterpriseInformationSystems
118
