
Developing A New Variables Sampling Scheme for Product
Acceptance Determination
Chien-Wei Wu
1
and James C. Chen
2
1
Department of Industrial Management, National Taiwan University of Science and Technology, Taipei, Taiwan
2
Department of Industrial Engineering and Engineering Management, National Tsing Hua University, Hsinchu, Taiwan
Keywords: Decision Making, Acceptance Sampling, Fraction of Defectives, Quality Assurance.
Abstract: Acceptance sampling is a useful tool for determining whether submitted lots should be accepted or rejected.
With the current increase in outsourcing production processes and the high quality levels required, it is very
desirable to have an efficient and economic sampling scheme. This paper develops a variables repetitive
group sampling (RGS) plan based on the third generation of process capability index. The plan parameters
are determined by minimizing the average sample number (ASN) for inspection and fulfilling the classical
two-point-condition on the operating characteristic (OC) curve. Besides, the efficiency of the proposed plan
is investigated and compared with the existing variables single sampling plan. Tables of the plan parameters
are also provided.
1 INTRODUCTION
Acceptance sampling is one of the most practical
tools in classical quality control and assurance
applications, which deal with quality contracts for
product orders between factories and their
customers. Acceptance sampling plans provide the
producer and the consumer with a general criterion
for lot sentencing. A well-designed sampling plan
can substantially reduce the difference between the
required and the actual supplied product quality
(Pearn and Wu, 2006; Pearn and Wu, 2007).
Unfortunately, it cannot avoid the risk of accepting
unwanted poor product lots, nor can it avoid the risk
of rejecting good product lots without implementing
100% inspection (e.g., Montgomery, D. C., 2009).
The criteria used to measure the performance in an
acceptance sampling plan are usually based on the
operating characteristic (OC) curve, which
quantifies the risks of producers and consumers. The
OC curve plots the probability of accepting a lot
against the actual quality level of the submitted lots.
In other words, the OC curve shows the
discriminatory power of the sampling plan, which
provides the producer and the buyer with a common
base for judging whether the sampling plan is
appropriate.
Sherman (1965) developed a new type of
sampling plan, called the repetitive group sampling
(RGS) plan, for attributes. The operating procedure
of this RGS plan is similar to that of the sequential
sampling plan. Balamurali and Jun (2006) extended
the RGS concept to variables inspection for a
normally distributed quality characteristic. They also
compared the efficiency of the variables RGS plan
with the variables single and double sampling plans.
These results indicate that the variables RGS plan
give the desired protection with the minimum
average sample number (ASN).
It is highly desirable to have an efficient and
economic acceptance sampling scheme, especially
when the required quality level is very high.
Therefore, the main purpose of this paper is to
develop a new variables sampling scheme for
product acceptance determination.
2 PROCESS CAPABILITY
INDICES
Process capability indices (PCIs), including C
p
, C
pk
,
C
pm
and C
pmk
, are convenient and powerful tools for
measuring process performance from different
perspectives. These indices establish the relationship
between actual performance and the specification
limits, and convey critical information regarding
whether a process is capable of reproducing items
satisfying customer requirements. For thorough
589
Wu C. and Chen J..
Developing A New Variables Sampling Scheme for Product Acceptance Determination.
DOI: 10.5220/0003972505890593
In Proceedings of the 9th International Conference on Informatics in Control, Automation and Robotics (OMDM-2012), pages 589-593
ISBN: 978-989-8565-22-8
Copyright
c
2012 SCITEPRESS (Science and Technology Publications, Lda.)

discussions on PCIs and the reviews for the
development of PCIs, refer to Kotz and Lovelace
(1998), Kotz and Johnson (2002), and Wu, Pearn
and Kotz (2009). In addition, Yum and Kim (2011)
summarized the related literature of process
capability analysis from 2000-2009.
In particular, the C
pmk
index is appropriate for
capability measure due to high standard and
stringent requirement on product quality and
reliability.
For a normally distributed process that is
demonstrably stable (under statistical control), Pearn
et al. (1992) suggested using the following
estimator:
2222
ˆ
min ,
3()3()
pmk
nn
USL X X LSL
C
SXT SXT
⎧⎫
−−
⎪⎪
=
⎨⎬
+− +−
⎪⎪
⎩⎭
22
||
3()
n
dXM
SXT
−−
=
+−
,
where
USL and
L
SL are the upper and lower
specification limits,
T is the target value,
()/2dUSLLSL=− is the half-length of the
specification interval and
()/2MUSLLSL=+
is the
midpoint of the specification limits,
1
/
n
i
i
X
Xn
=
=
∑
and
(
)
2
2
1
/
n
ni
i
SXXn
=
=−
∑
are the maximum
likelihood estimators of
μ
and
2
σ
, respectively.
Note that
22
()
n
SXT+−
2
1
()/
n
i
i
X
Tn
=
=−
∑
in the
denominator of
ˆ
p
mk
C is the uniformly minimum
variance unbiased estimator (UMVUE) of
22 2
()[( )]TEXT
σμ
+− = − , which appears in the
denominator of
p
mk
C (Pearn, Kotz and Johnson
(1992) and Pearn and Lin (2002)).
Wright (1998) developed an explicit but rather
complicated expression for the probability density
function (PDF) of
ˆ
p
mk
C . More recently, Pearn and
Lin (2002) rewrote the cumulative distribution
function (CDF) of
ˆ
p
mk
C by taking variables
transformation and the integration techniques similar
to that presented in Vännman (1997). The CDF can
be expressed as
2
/(1 3 )
2
ˆ
2
0
()
() 1
9
()()d,
pmk
bn y
C
bn w
Fy G w
y
wnwnw
φξ φξ
+
⎛⎞
−
=− −
⎜⎟
⎜⎟
⎝⎠
⎡⎤
×+ +−
⎣⎦
∫
for 0y > , where /bd
σ
= , ()/T
ξ
μσ
=− , ()G
⋅
is
the CDF of the chi-square distribution with degrees
of freedom
1n
−
, and
()
φ
⋅
is the PDF of the
standard normal distribution.
3 DEVELOPING A NEW
VARIABLES RGS SAMPLING
SCHEME
If the quality characteristic of interest follows a
normal distribution and has two-sided specification
limits (LSL and USL). It is common to use the AQL
(acceptable quality level) and LQL (limiting quality
level) points on the OC curve to designing an
acceptance sampling plan. This implies that the
probability of acceptance must be greater than
1
α
−
if the quality level of the submitted lot is at
AQLpmk
CC
=
(in high quality). The probability of
acceptance is no more than
β
if the quality level of
the submitted lot is only at
LQLpmk
CC= (in low
quality), where
α
and
β
are commonly called the
producer’s risk and the consumer’s risk,
respectively.
The operating procedure of the proposed
variables RGS plan based on the
p
mk
C index can be
stated as follows.
Step 1. Decide the capability requirements and
the risks for the consumer and the producer (i.e.,
determine the values of
AQL
C ,
LQL
C ,
α
, and
β
).
Step 2. Take a random sample of size
n from the
lot, and calculate the estimated
p
mk
C value,
ˆ
p
mk
C ,
based on these inspected samples.
Step 3. Make a decision based on the following
rules.
(i) Accept the entire lot if
ˆ
p
mk
C
is greater than the
critical value for acceptance
a
k .
(ii) Reject the entire lot if
ˆ
p
mk
C is smaller than
the critical value for rejection
r
k .
(iii) Otherwise, we do not have sufficient
information to determine if the submitted lot meets
the present capability requirement. In this case, we
should take a new sample for further judgment (i.e.,
repeat Step 2).
The definition of the
p
mk
C index can be rewritten
as
21/2
(/ ||)/[3(1 )]
pmk
Cd
σξ ξ
=− + , where
()/T
ξ
μσ
=
− . Further, given
pmk
CC= , /bd
σ
=
can be rewritten as
21/2
3(1 ) | |bC
ξ
ξ
=+ +. The
probability of accepting the lot based on the
p
mk
C
index can be expressed as
ICINCO2012-9thInternationalConferenceonInformaticsinControl,AutomationandRobotics
590

ˆ
()( )
apmk pmk a
PC PC k=≥
2
/(1 3 )
2
2
0
()
()()d.
9( )
a
bn k
a
bn w
Gwwnwnw
k
φξ φξ
+ ⎛⎞
−
⎡⎤
=−++−
⎜⎟
⎜⎟
⎣⎦
⎝⎠
∫
Similarly, the probability of rejecting the lot based
on the
p
mk
C index, ()
rpmk
PC , can be expressed as
ˆ
()( )
rpmk pmk r
PC PC k=<
2
/(1 3 )
2
2
0
()
1()()d.
9( )
r
bn k
r
bn w
Gwwnwnw
k
φξ φξ
+ ⎛⎞
−
⎡⎤
=− − + + −
⎜⎟
⎜⎟
⎣⎦
⎝⎠
∫
So, the OC function of the designed variables RGS
plan based on the
p
mk
C index, ()
Apmk
C
π
, can be
obtained as
()
() .
()()
apmk
Apmk
a pmk r pmk
PC
C
PC PC
π
=
+
As noted before, the parameters of the designed
variables RGS plan should simultaneously satisfy
the following two conditions specified by the
producer and the consumer:
AQL
AQL
AQL AQL
()
() 1
()()
a
A
ar
PC
C
PC PC
π
α
=≥−
+
and
LQL
LQL
LTPD LQL
()
()
()()
a
A
ar
PC
C
PC PC
π
β
=≤
+
,
where
AQL
C and
LQL
C denote the quality levels of
AQL and LQL based on the
p
mk
C index,
respectively.
Three plan parameters
(, , )
ar
nk k must be
determined for the designed variables RGS plan.
There may be several combinations of the plan
parameters that satisfy the above two equations.
The ASN for the proposed variables RGS plan
can be calculated by
ASN( ) .
()()
pmk
apmk rpmk
n
C
PC PC
=
+
It is usual to determine the plan parameters by
minimizing the ASN evaluated at AQL or LQL.
Therefore, the plan parameters
(, , )
ar
nk k of the
proposed VRGS plan based on the
p
mk
C index could
be determined simultaneously by solving the
following optimization problem while the ASN is
the objective function.
AQL
Min ASN( )C
subject to
AQL
()1,
A
C
π
α
≥−
LQL
(),
A
C
π
β
≤
AQL LQL
CC> , 0
ar
kk≥≥,
where
21/2
AQL
3(1)||
A
bC
ξ
ξ
=++ and
21/2
LQL
3(1)||
L
bC
ξ
ξ
=++. If
ar
kk= , the developed
variables RGS plan will reduce to the existing
variables single sampling plan based on the
p
mk
C
index by Wu and Pearn (2008).
4 DETERMINATION OF PLAN
PARAMETERS AND
DISCUSSIONS
Given the producer’s
α
-risk, the consumer’s
β
-risk
and two benchmarking quality levels
AQL LQL
(, )CC,
the plan parameters (
n
,
a
k ,
r
k ), the corresponding
ASN value of the proposed variables RGS plan can
be obtained by solving the above optimization
model.
Tables 1-2 summarize the plan parameters
(
n ,
a
k ,
r
k ) and the corresponding ASN value under
various
α
-risks and
β
-risks = 0.01, 0.05 and 0.10,
with several selected values of
AQL LQL
(, )CC= (1.33,
1.00) and (1.50, 1.00), respectively.
Based on the given tables, the practitioner can
know how large a sample size is required for
inspection and the associated critical values for
acceptance and rejection (
a
k
,
r
k
). For instance, if the
benchmarking quality levels
AQL LQL
(, )CC are set to
(1.33, 1.00) with (
α
,
β
) = (0.05, 0.10) then the plan
parameters will be
(, , )
ar
nk k = (34, 1.297, 1.031).
This implies that the lot will be accepted if the 34
inspected product items yield measurements with
ˆ
pmk
C > 1.297, and the lot will be rejected if
ˆ
pmk
C
<
1.031. Otherwise, a new sample must be
taken for further judgment.
DevelopingANewVariablesSamplingSchemeforProductAcceptanceDetermination
591
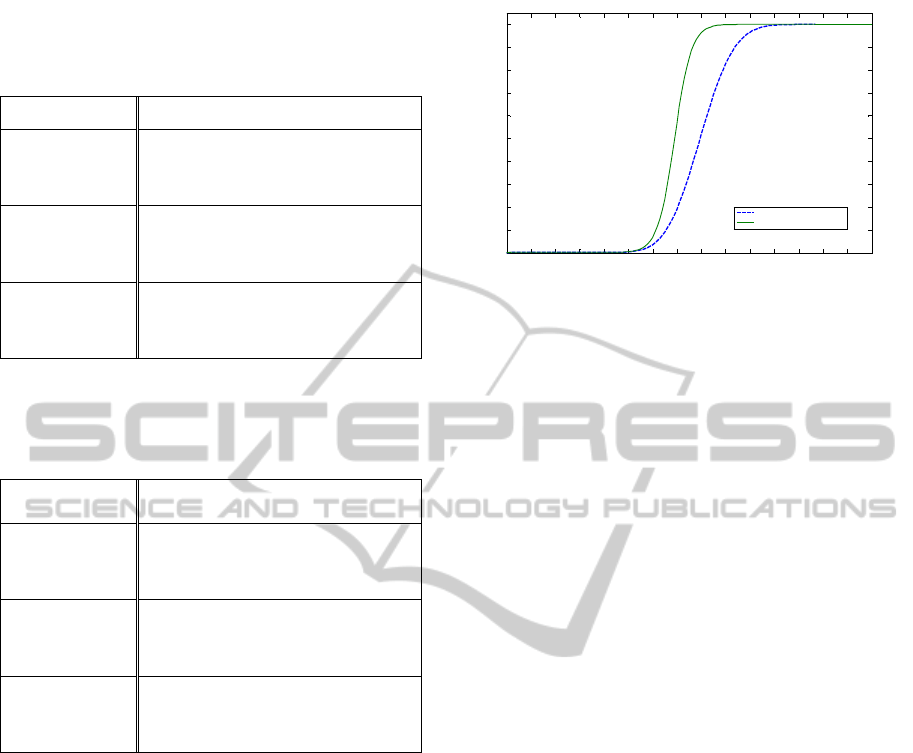
Table 1: The values of
n
,
a
k ,
r
k , and the corresponding
ASN for various
α
and
β
with quality levels
AQL LQL
(, )CC= (1.33, 1.00).
α β n k
a
k
r
ASN
0.010 0.010
87 1.278 1.074 124.4
0.050
56 1.275 1.021 82.1
0.100
44 1.271 0.989 65.2
0.050 0.010
78 1.289 1.258 114.2
0.050
45 1.295 1.068 74.2
0.100
34 1.297 1.031 52.8
0.100 0.010
74 1.295 1.159 106.3
0.050
40 1.311 1.099 62.8
0.100
30 1.319 1.059 45.6
Table 2: The values of n ,
a
k ,
r
k , and the corresponding
ASN for various
α
and
β
with quality levels
AQL LQL
(, )CC= (1.50, 1.00).
α β n k
a
k
r
ASN
0.010 0.010
44 1.418 1.127 62.1
0.050
28 1.416 1.050 40.5
0.100
22 1.413 1.003 31.8
0.050 0.010
41 1.433 1.203 57.5
0.050
23 1.447 1.120 35.0
0.100
17 1.455 1.066 26.0
0.100 0.010
39 1.441 1.252 53.7
0.050
21 1.470 1.166 31.5
0.100
15 1.486 1.096 22.6
Figure 1 displays OC curves of the variables
single sampling plan and the variables RGS plan
with
n =
100. It can be seen that the OC curve for
the proposed variables RGS plan is more
discriminating than the variables single sampling
plan. This is because a greater slope in the OC curve
represents greater discriminatory power. It provides
a better OC curve than the variables single sampling
plan at good quality levels and protects against the
consumer point of view at poor quality levels.
This implies that the same OC curve can be
achieved by the proposed variables RGS plan with
smaller sample size than required by the existing
variables single sampling plan. Thus, the proposed
variables RGS plan is economically superior to the
variables single sampling plan in terms of sample
size required for inspection. Thus, the proposed plan
will give the desired protection with minimum
inspection, and reduce the cost of inspection greatly.
0.5 0.6 0.7 0.8 0.9 1.0 1.1 1.2 1.3 1.4 1.5 1.6 1.7 1.8 1.9 2.0
0
0.1
0.2
0.3
0.4
0.5
0.6
0.7
0.8
0.9
1.0
Cpmk
Probability of acceptance
Variables Single Sampling Plan
Variables RGS Plan
Figure 1: OC curves of a variables single sampling plan
and a variables RGS plan with
n = 100.
5 CONCLUSIONS
This paper develops a variables RGS plan based on
the C
pmk
index. The OC curve of the proposed
variables RGS plan is based on an exact sampling
distribution rather than approximation. The sample
size required for inspection and the corresponding
acceptance and rejection criteria are determined by
minimizing the ASN such that two critical
constraints required by the producer and the
consumer can be satisfied. This paper also compares
the efficiency of the proposed variables RGS plan
with the existing variables single sampling plan in
terms of the ASN required for inspection. Results
indicate that the proposed variables RGS plan
requires less sampling for product acceptance
determination than the variables single sampling
plan under the same conditions. It would be useful
when inspection or testing of the product quality
characteristic is costly or destructive.
ACKNOWLEDGEMENTS
This work was partially supported by the National
Science Council of Taiwan under grant no. NSC
100-2628-E-011-013-MY3.
REFERENCES
Balamurali, S. and Jun, C.H. (2009). Designing of a
variables two-plan system by minimizing the average
sample number.
Journal of Applied Statistics, 36(10),
1159-1172.
ICINCO2012-9thInternationalConferenceonInformaticsinControl,AutomationandRobotics
592

Kotz, S. and Johnson, N. L. (2002). Process capability
indices – a review, 1992-2000.
Journal of Quality
Technology,
34(1), 1-19.
Kotz, S. and Lovelace, C. (1998).
Process Capability
Indices in Theory and Practice
. Arnold, London, U.K.
Montgomery, D. C. (2009).
Introduction to Statistical
Quality Control
(6th Edition), Wiley, New York.
Pearn, W.L., Kotz, S. and Johnson, N.L. (1992).
Distributional and inferential properties of process
capability indices.
Journal of Quality Technology,
24(4), 216-231.
Pearn, W.L. and Lin, P.C. (2002). Computer program for
calculating the
p-values in testing process capability
C
pmk
. Quality and Reliability Engineering
International
, 18(4), 333-342.
Pearn, W. L. and Wu, C. W. (2006). Critical acceptance
values and sample sizes of a variables sampling plan
for very low fraction of defectives.
Omega – The
International Journal of Management Science
, 34(1),
90-101.
Pearn, W. L. and Wu, C. W. (2007). An effective decision
making method for product acceptance.
Omega – The
International Journal of Management Science
, 35(1),
12-21.
Sherman, R. E. (1965). Design and evaluation of repetitive
group sampling plan.
Technometrics, 7, 11-21.
Vännman, K. (1997). Distribution and moments in
simplified form for a general class of capability
indices.
Communications in Statistics: Theory &
Methods
, 26, 159-179.
Wright, P. A. (2000). The cumulative distribution of
process capability index
C
pm
. Statistics and
Probability Letters
, 47, 249-251.
Wu, C. W., Pearn, W. L. and Kotz, S. (2009). An
overview of theory and practice on process capability
indices for quality assurance.
International Journal of
Production Economics
, 117(2), 338-359.
Wu, C. W. and Pearn, W. L. (2008). A variables sampling
plan based on
C
pmk
for product acceptance
determination.
European Journal of Operational
Research
, 184(2), 549-560.
Yum, B. J. and Kim, K. W. (2011). A bibliography of the
literature on process capability indices: 2000-2009.
Quality and Reliability Engineering International,
27(3), 251-268.
DevelopingANewVariablesSamplingSchemeforProductAcceptanceDetermination
593
