
AN INTEGRATION PLATFORM FOR IT-FOR-GREEN
Integrating Energy Awareness in Daily Business Decisions and Business Systems
Barbara Rapp
1
, Jan Vornberger
1
, Fabian Renatus
2
and Henning G
¨
osling
2
1
Department of Computing Science, University of Oldenburg, Oldenburg, Germany
2
Chair of Production and Logistics, University of G
¨
ottingen, G
¨
ottingen, Germany
Keywords:
Green ICT, Energy Aware Production, CEMIS, Data Center, Energy Monitoring, Sustainability, Green
Logistics, Green Production.
Abstract:
Political parameters and guiding principles for environmental protection, sustainability and energy efficiency
demand for assistance from environmental management systems. Indeed, a high-capacity environmental man-
agement system has a need for multiple diverse and heterogeneous data in order to meet the requirements of
planning, controlling and assessing versatile environmental tasks within an organization and beyond organiza-
tional boundaries. This data has to be provided by so called corporate environmental management information
systems (CEMIS) for a goal oriented processing. But, looking into business practice shows that currently
implemented CEMIS do not cope with the requirements from the sustainability debate. Current software is
mostly used to manage the damage done, hence an energy efficient behaviour can not come to daily busi-
ness. Knowledge about the energy footprint of a product throughout its life-cycle is currently not properly
made accessible to business people, stakeholders or customers. For this reason, we plan a new CEMIS that is
able to take into account e.g. ICT for designing, building or selling, product related transport and production
processes, as well as web store energy costs for the whole product life.
1 INTRODUCTION
An organizational, technical system for systemat-
ically capturing, processing and publishing envi-
ronmentally relevant data within an organization is
called corporate environmental management informa-
tion system (CEMIS). The main idea of sustainability
is in the public eye and forces companies to report
on ecological, economical and social aspects. At this
point, the traditional concepts of CEMIS could have
been used, but this did not happen.
From today’s perspective, traditional systems
failed for any number of reasons. Mainly, current
CEMIS focus just on achieving legal compliance
or realizing standardized environmental management
systems like ISO 14001. In business terms, such sys-
tems are at an operational management level. All in
all, present CEMIS aim at avoiding or lowering the
costs of environmental impacts, which are already
caused by organizations. These systems are merely
output oriented. But, according to the current situa-
tions for companies and the requirements from differ-
ent stakeholders a proactive approach is required.
Energy has become a major cost impact for most
companies. Raising energy awareness, enabling en-
ergy efficiency and saving money in this way will be
one of the most important duties for newly imple-
mented CEMIS. When a system like the one proposed
in this paper is in action within a company, energy
awareness becomes part of daily business decisions
and helps saving energy in a proactive way.
In this position paper we present our thoughts on
how energy awareness will be integrated into next
generation CEMIS.
2 THE IT-FOR-GREEN
APPROACH
Besides satisfying stakeholder interests, it is the prime
objective of sustainable development to establish a
harmonic balance of economy and ecology, for ex-
ample by lowering costs through material and energy
efficiency. The reduction of material and energy con-
sumption in companies has a direct positive impact
on both the environment and the economy. However,
such beneficial effects can only be achieved by imple-
226
Rapp B., Vornberger J., Renatus F. and Gösling H..
AN INTEGRATION PLATFORM FOR IT-FOR-GREEN - Integrating Energy Awareness in Daily Business Decisions and Business Systems.
DOI: 10.5220/0003978202260231
In Proceedings of the 1st International Conference on Smart Grids and Green IT Systems (SMARTGREENS-2012), pages 226-231
ISBN: 978-989-8565-09-9
Copyright
c
2012 SCITEPRESS (Science and Technology Publications, Lda.)

menting a new generation of more strategic CEMIS.
The term IT-for-Green aims at increasing the en-
vironmental friendliness of companies and their pro-
cesses by means of IT. In this context, CEMIS are to
be regarded essential for supporting the sustainability
integration. Conventional CEMIS are not sufficient to
achieve this objective, for they mostly serve the pur-
pose of ensuring legal compliance with relevant en-
vironmental laws and regulations, mainly in order to
avoid financial sanctions from state authorities. With
such a strong operational focus, the requirements en-
tailed by the concept of sustainable development can
only be fulfilled to a very limited degree. On the
other hand, companies may achieve profits by apply-
ing sustainable development measures: they reduce
costs through material savings and – becoming more
and more important – by implementing energy effi-
ciency and increase their turnovers through sustain-
able products and services, corporate image improve-
ment and advantages in competition.
Besides giving guidelines, the IT-for-Green
project aims at implementing a second generation
CEMIS. We are planning a system, that is based on
three building blocks. These modules correspond to
the life-cycle of products from input (measuring en-
ergy efficiency of the ICT used) to transformation (lo-
gistics and sustainable product development) to out-
put (corporate communication and sustainability re-
ports). The underlying architecture enables a collec-
tion of green web services. In future, they will pro-
vide a basis for a service platform (called green ser-
vice mall). To succeed in implementing a second gen-
eration CEMIS the expertise of different scientific and
industry partners is combined.
2.1 Goals
Second generation CEMIS will be located at the
strategic level of a company and provide relevant en-
vironmental information and algorithms for decision
support. Also, it will enable the evaluation of sus-
tainable development lines, of mission critical prices
of resources or of volatile energy markets. For this
reason related risks and system dynamical cause and
effects between economic, ecologic and social indica-
tors can be made visible.
Future CEMIS aim at using the company’s IT as
resource guiding, integrative system for intelligent
and strategic supervision. In this way a chance and
risk efficient, strategic environmental management
can be realized and sustainable shareholder value can
be generated. Such information systems will gain
broad importance for companies.
2.2 Planned Implementation
One result of the project will be a proof-of-concept
implementation. As mentioned above, three soft-
ware modules with corresponding services and pro-
cess models will be developed. The building blocks
will cover the complete product life-cycle from input
to transformation to output. The module ”Green IT”
(section 3) will provide services that deal with energy
efficiency of the ICT infrastructure. They can be used
stand-alone or as data source for other services and
modules. Section 4 focusses on ”Green Production
and Logistics”. This module provides services that
enable the reduction of energy and material flows.
The third module deals with sustainability reporting
and dialog-based communication. It provides ser-
vices, that for example enhance (external) data (e.g.
from module 1 or 2) and based on this, build reports
for different stakeholders.
The core system, that will finally make up the
next generation in the CEMIS, will be a service-
oriented platform that allows for loose coupling and
bundling of necessary methods. A green service mall
will provide a semantically enriched procurement of
CEMIS-functionality for individual embedding into
workflows. Embedding environmental considerations
into arbitrary (business) processes this way, allows for
an intermixed usage of specific functions from self-
hosted services, external service providers and non-
environmental services. Such architecture allows for
a highly flexible integration of environmental tasks
into traditional (already installed) information infras-
tructures with the new CEMIS as the integrating sys-
tem. For our prototype we will have to short-list the
functions that will be actually implemented.
With high priority, we will focus on energy aware-
ness and reduction as one of the most important use
cases for our first prototype. These services are cur-
rently implemented and tested with our industry part-
ners.
3 CAPTURING AND REPORTING
ICT ENERGY CONSUMPTION
The energy demand of ICT infrastructure is rising
continuously (Koomey, 2007). Looking at a typical
data center today, consumption has reached a point,
were the running costs of the ICT equipment is as
much an important factor as the investment costs in
the first place (Barroso, 2005).
Yet, many businesses do not have much informa-
tion about the energy requirements and consumption
ANINTEGRATIONPLATFORMFORIT-FOR-GREEN-IntegratingEnergyAwarenessinDailyBusinessDecisionsand
BusinessSystems
227
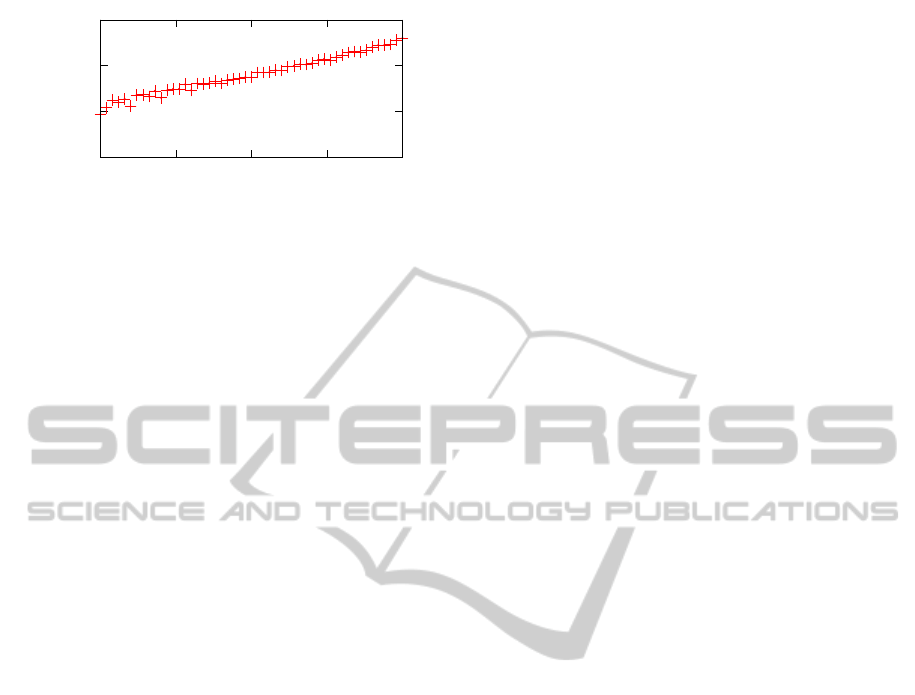
40 W
60 W
80 W
100 W
0 % 25 % 50 % 75 % 100 %
Active power
CPU utilization
Figure 1: Energy usage of a server in different load situa-
tions.
of their ICT equipment (BITKOM, 2008). It is there-
fore an important aspect of future CEMIS to support
companies in monitoring energy usage and attribute it
to the relevant business processes.
To tackle this problem, it is necessary to intro-
duce measuring hardware into the data center. A large
number of measuring points are required to reach
a high degree of detail in the reporting. To lessen
the burden of implementing this measuring infrastruc-
ture, our project will also look into ways to reduce the
number of measuring points needed.
One such approach consists of merely estimating
energy usage on the basis of equipment utilization
levels. Looking at the example of servers, this kind of
data – for example CPU utilization or network activ-
ity – is often readily available through software alone.
If this data can be used to accurately estimate power
usage, the implementation of a monitoring infrastruc-
ture can be simplified.
It will be a goal of the project to facilitate such
an approach by providing relevant services as part of
the green service mall. Preliminary work has started
to build reliable models that predict energy usage
based on server utilization. We validate these mod-
els through measurements performed in our lab server
environments as well as in larger data centers. Consis-
tent with other work in this area (Rivoire et al., 2008)
we see a strong influence of CPU activity on power
usage in our measurements (figure 1).
Even with a simple linear module based on CPU
utilization levels it is possible to attempt a power us-
age estimation. Figure 2 shows a screenshot of a soft-
ware module – which will be part of our prototype –
as it is estimating the power usage of a server. For
comparison, the actual measurements are tracked as
well and in our experiments this model achieves cor-
rect predictions with an average error of 6 %.
Of course there are many more components than
servers in a data center. Measuring points are also
required for the cooling infrastructure, for network
equipment and for the uninterruptible power supply.
Once all of these measurement points are in place,
the data can be fed into a model of the data center.
Such a model-based approach is helpful in two ways:
Firstly, it can be the basis for various reports and met-
rics (like PUE, power usage effectiveness) regarding
the current situation. Secondly, it becomes possible to
simulate the effect of changes to the data center and
thereby helps in the process of identifying power sav-
ing potentials.
Furthermore, a detailed understanding of the en-
ergy situation of the data center also helps in map-
ping business processes to the computing resources
they require and in turn the energy usage they cause.
Making this connection is a crucial part in making in-
formed decisions about the structure of these business
processes.
4 CAPTURING AND REPORTING
PRODUCTION AND
LOGISTICS PROCESSES
The ”Green Production and Logistics” module aims
at developing services, that allow small and medium-
sized enterprises (SMEs) for better analyzing the en-
vironmental impact of their production and/or logis-
tics processes. In both areas, international standard-
ized methodologies such as the Eco-Management and
Audit Scheme (EMAS), parts of the ISO 14000 se-
ries and the DIN EN 16258 are applied, in order to
ensure the comparability of results and long term us-
ability. However, one major obstacle is the difference
in those two process types. On the one hand, produc-
tion processes describe the physical transformation of
goods and can be very versatile depending on the in-
dustrial sector the enterprise is operating in. Logistic
processes, on the other hand, cover the transportation
of goods over space and time and are less industry-
specific, which means they require less customization
efforts after the installation of our tool.
4.1 Green Production
The module enables a SME to measure the environ-
mental performance of production processes. There-
fore, the first important step is to break down main
processes into subprocesses and further into single ac-
tivities. In this sense, it is not suitable to treat the en-
terprise as a whole (black-box) and just quantify its
in- and outputs, because thereby, potential improve-
ments can not be identified.
Each identified activity, specified by its core (e.g.
technical plant specification) and dynamic data (e.g.
material input), is used to create a basic material and
SMARTGREENS2012-1stInternationalConferenceonSmartGridsandGreenITSystems
228
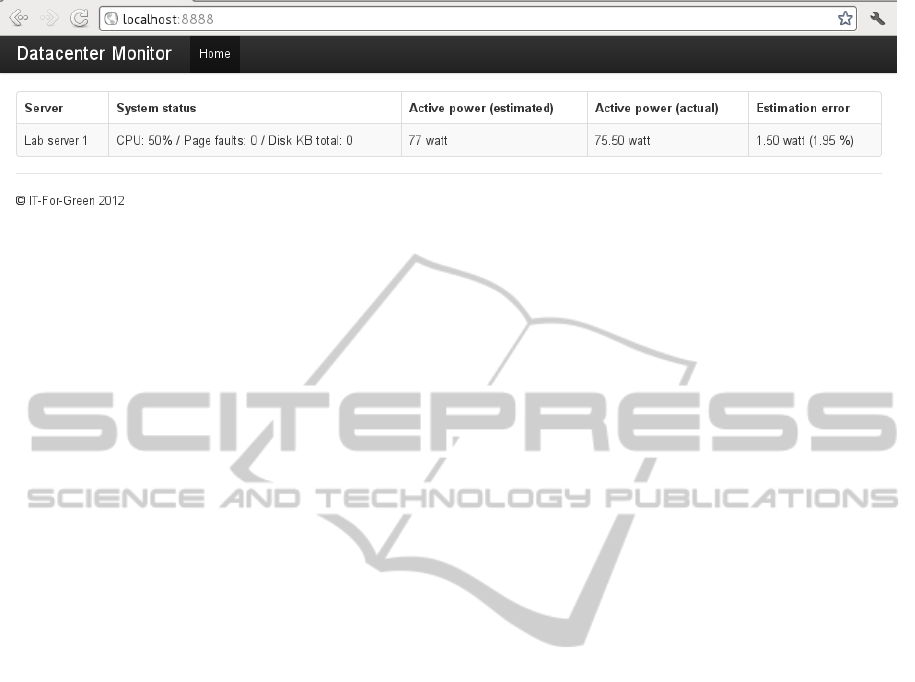
Figure 2: Software tool to estimate power usage based on server utilization.
energy flow model. In order to ease data assessment
and to reduce manual user input, links to repositories
which contain this specific informations, are estab-
lished. It is necessary to obtain information cover-
ing the following aspects: energy efficiency, mate-
rial efficiency, water, waste, biodiversity and emis-
sions, as these are the six core environmental indi-
cators stated by the EMAS (European Parliament and
Council, 2009). On top of that, it is advised to publish
additional branch specific indicators.
However, for the management it might be hard
to interpret the gathered data, due to missing com-
parative values and metrics that allow for an evalua-
tion of the environmental performance. To solve this
and to give the management the possibility of a quick
evaluation, several impact assessment methods exist.
Methods like CML 2001 (Guine et al., 2002) and IM-
PACT2002+ (Jolliet et al., 2003) can be used to aggre-
gate the environmental performance into a few total
values.
Besides the ability to evaluate the performance
in a short amount of time and to validate the results
against target values, enterprises are enabled to spot
economic and/or ecologic weaknesses in their pro-
duction processes. For instance, processes with the
highest energy consumption could be highlighted in
the material and energy flow model, which could lead
to a further investigation. In that sense, the identifi-
cation of ecological improvements could also lead to
monetary benefits.
Unfortunately, several feasible improvements may
contradict each other. In these situations, the manage-
ment is supported by certain multi-criteria decision
aiding methods. Our tool allows the decision maker
to set up different alternatives (the possible improve-
ments), which will be ranked according to the identi-
fied criteria and the decision makers preferences.
4.2 Green Logistics
Besides the evaluation of the production processes, a
SME might be interested in an assessment of their
transportation processes as well. For the purpose of
publication, it should not matter whether they perform
the transportation on their own or assign them to a for-
warding agency. The second part of module 2 helps
enterprises with that task and is based on the DIN EN
16258 norm (Deutsches Institut f
¨
ur Normung, 2011).
The norm incorporates two major advantages. Firstly,
the evaluation of the transportation processes is inde-
pendent of the various means of transport (e.g. trucks,
trains, aircrafts, etc.). Secondly, there is no set re-
quirement for the data source, which is used in the
calculations (although, the more accurate the data, the
better the result).
The assessment of the transportation processes has
to cover two different areas, which are to some ex-
tend in relation to scope 1 and scope 3 emissions
mentioned in the green house gas (GHG) protocol
(WRI and WBCSD, 2004). Scope 1 emissions re-
fer to direct emissions that arise from enterprise con-
trolled sources, like the combustion of fuel in com-
pany owned vehicles. Scope 3 emissions contain in-
direct emissions, which do not originate from the en-
terprise itself, like the provision of fuel, but which are
needed to execute their business processes. The tool
is translating those scopes into Well-to-Tank (WTT)
and Tank-to-Wheel (TTW) processes, which stand for
scope 3 and scope 1 respectively. In order to en-
sure that results are comparable over various means
of transportation, two different units are calculated.
Energy consumption (e.g. consumption of gaso-
line, diesel, kerosene, electricity) will be measured
in megajoule (MJ) while GHG emissions will be de-
noted in carbon-dioxide equivalents (CO
2
e).
Calculation methods will vary depending on the
desired output format and the data source. Four dif-
ferent sources are possible: 1. specific measurements
for each vehicle used during the transport, 2. typi-
cal mean measurements based on vehicle type and/or
route, 3. measurement of the annual mean fleet con-
sumption, 4. default values found in scientific or gov-
ernmental publications. The first option is only vi-
able for enterprises, which have direct control over
the vehicles and can track their distances, load and
fuel consumption. The other three options can also be
ANINTEGRATIONPLATFORMFORIT-FOR-GREEN-IntegratingEnergyAwarenessinDailyBusinessDecisionsand
BusinessSystems
229
used by enterprises, which assign forwarding agen-
cies with the transportation of their goods and will
depend on the level of cooperation, because option
two and three may require access to external data.
After it is clear, which data is available, the cal-
culation itself is pretty straightforward. The trans-
port route needs to be divided into single parts which
are determined by the vehicles that were used. If a
good-specific assessment is desired and a vehicle did
carry other goods next to the one under investigation,
an allocation is required. Such an allocation can be
done in three different ways: 1. weight-dependent, 2.
volume-dependent or 3. a mixture of both. In that
fashion, TTW and Well-to-Wheel (WTW), which is
WTT plus TTW, can be calculated for each single part
of the route and then be aggregated into a total value
for the investigated good.
At the end, the results of both parts are submitted
to module 3, which may then lead to a publication in
a sustainability report.
5 INTEGRATION
We will now discuss the advantages of the integrat-
ing character of our planned platform approach in the
context of a possible use case. Every task, an end user
will be able to fulfill with the help of our new CEMIS,
is organized as a workflow and controlled by a new
workflow system. Let’s assume, we want to develop
a new product: A small portable device in need of
frequently downloading information from an online
store (like an e-book reader, portable media player).
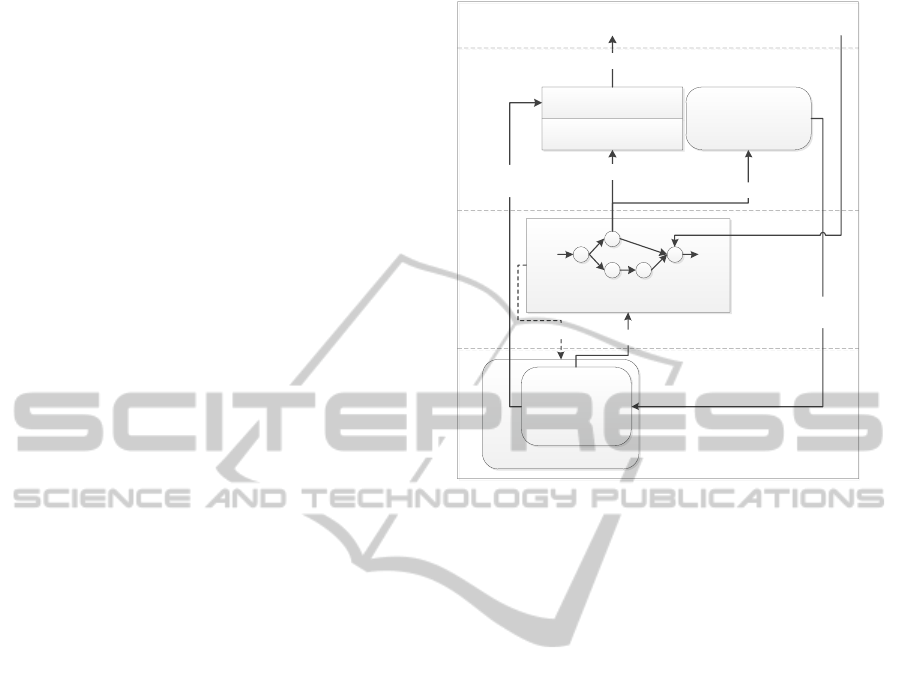
Figure 3 shows the information and control flow
during the execution of a single activity within a
CEMIS workflow. There are several perspectives on
such activities. We will start with a more generic look
on the whole system and then discuss it in the light of
raising energy awareness and efficiency.
From the user perspective there will be a client
application (planned as browser application) that vi-
sualizes the processing of a workflow, allows user in-
put and control flow interaction, presents intermediate
results, etc.
The technical perspective reflects the realization
of the services needed for fulfilling an activity. This
is so to speak the business logic of the whole system.
For the sake of an individually composed software
system that serves exactly the individual needs of dif-
ferent business and companies, we will have a set of
interoperable services for individual tasks. With this
modular design principle each company may compass
its own tailor made CEMIS. A high priority will be
given to the supply of energy related services.
CEMIS workflow context
CEMIS workflow context
activity business logic
activity interface
activity view
(5) store result in context
workflow engine
(1) get view
(3) signal: start activity
workflow view
activity view
with embedded
controls
controls
(6) signal: done
(2) embed
view
(4) make business
logic calls
(7) fetch
previous result
shared
universe
technical perspective task perspective user perspective
Figure 3: Integration scheme for energy aware product de-
velopment.
In the task perspective, a workflow represents
an executable arrangement of different activities that
guides an user during his work with the system. It will
be possible to define (or rather program) complex re-
lations and control flows within a workflow.
A workflow may comprise activities from sev-
eral (maybe external) sources and also from different
users. On a time scale, a workflow might be executed
in several phases (during product life-cycle) and be
saved to disc in the mean time. In order to share in-
formation among all these services and phases, a spe-
cialized context for information exchange is shared.
In the context of the mentioned new product, one
necessary activity might be to estimate later energy
consumption of the servers that host the web store.
In this case, the workflow engine will fetch all nec-
essary view information from the service and put it
into the user perspective for choosing an appropriate
server model and for parameterizing it.
Due to the design of our workflows, the engine
will continue with the appropriate activity based on
the model choice of the user and carry on with a view
that lets him use the model. All calculated results on
estimated energy consumption are stored to the con-
text for usage by further activities.
Necessary information about all entailed server
loads, when using the product, might be taken from
previously executed design activities and thus from
the CEMIS context. In this way, results from mar-
ket research on estimated product using profiles may
SMARTGREENS2012-1stInternationalConferenceonSmartGridsandGreenITSystems
230

be fed directly into the server model for transferring
product usage into an estimate of the energy load it
will entail on the server. In a similar way, energy
consumption for logistics related to the product can
be utilized. This might comprise upstream chains for
procurement of product parts as well as distribution
logistics.
Integrated in a workflow all these energy con-
sumption and estimation related activities may be ex-
ecuted multiple times with different parameters and
product configurations in order to take into account
production and product life-cycle energy costs for the
product design. The energy estimation data from the
design phase is stored in the CEMIS context, so it
will be still readily available when the workflow is
suspended and resumed later for a product redesign
phase. The context is part of the workflow and will
be stored to disk together with the workflow and its
execution state, if necessary.
Nevertheless, the energy data (as any other envi-
ronmental data in the platform) may also be saved
to an environmental data store and be used in any
other workflow that might accompany the product
life-cycle. All data will be transfered into an stan-
dardized CEMIS data format (development will start
soon) in order to ensure interoperability.
A frequent use case will be communication and
reporting. Communicating energy information in this
context refers to activities like including achieved
savings in product advertisements, fair and source-
related cost allocation or raising awareness for the
impacts of one’s own daily business decisions. Re-
porting on the other hand refers to an integration of
energy data into annual, official sustainability reports
that may be generated and published with our system
as well. New and interactive graph and gauge ele-
ments in this report will enable stakeholders to expe-
rience a versatile offer of energy information that is
exactly tailored to their specific needs.
6 CONCLUSIONS AND NEXT
STEPS
The development of the core integration platform has
just started out. The business concepts are developed
in close collaboration with our scientific and industry
partners, especially to confirm that they can benefit
from these concepts in daily business. Currently, we
are also facing the specification of a common, XML-
based data exchange format. The definition of ser-
vices, that implement different workflow activities is
yet another next step.
ACKNOWLEDGEMENTS
This work is part of the project IT-for-Green (Next
Generation CEMIS for Environmental, Energy and
Resource Management). The IT-for-Green project is
funded by the European regional development fund
(grant number W/A III 80119242).
REFERENCES
Barroso, L. A. (2005). The price of performance. ACM
Queue, 3:48–53.
BITKOM (2008). Energy Efficiency in the Data Center:
A Guide to the Planning, Modernization and Opera-
tion of Data Centers. Retrieved February 16, 2012,
from http://www.bitkom.org/files/documents/energy
efficiency in the data center volume 2.pdf.
Deutsches Institut f
¨
ur Normung (2011). Methode zur
Berechnung und Deklaration des Energieverbrauchs
und der Treibhausgasemissionen bei Transportdien-
stleistungen (G
¨
uter- und Personenverkehr). DIN EN
16258, Deutsches Institut f
¨
ur Normung e. V.
European Parliament and Council (2009). Regulation (EC)
No 1221/2009 of the European Parliament and of
the Council of 25 november 2009 on the voluntary
participation by organisations in a Community eco-
management and audit scheme (EMAS), repealing
Regulation (EC) No 761/2001 and Commission De-
cisions 2001/681/EC and 2006/193/EC. Technical re-
port, European Community.
Guine, J., Gorre, M., Heijungs, R., Huppes, G., Kleijn, R.,
Koning, A. d., Oers, L. v., Wegener Sleeswijk, A.,
Suh, S., Udo de Haes, H., Bruijn, H. d., Duin, R. v.,
and Huijbregts, M., editors (2002). Handbook on life
cycle assessment. Operational guide to the ISO stan-
dards. Part IIa: Guide. Kluwer Academic Publishers,
Dordrecht.
Jolliet, O., Margni, M., Charles, R., Humbert, S., Payet,
J., Rebitzer, G., and Rosenbaum, R. (2003). Impact
2002+: A new life cycle impact assessment method-
ology. International Journal of Life Cycle Assessment,
8(6):324–330.
Koomey, J. (2007). Estimating total power consump-
tion by servers in the U.S. and the world. Re-
trieved February 16, 2012, from http://sites.amd.com/
de/Documents/svrpwrusecompletefinal.pdf.
Rivoire, S., Ranganathan, P., and Kozyrakis, C. (2008).
A comparison of high-level full-system power mod-
els. In Proceedings of the 2008 conference on Power
aware computing and systems, HotPower’08, pages
3–3, Berkeley, CA, USA. USENIX Association.
WRI and WBCSD (2004). The greenhouse gas proto-
col. Technical report, World Resources Institute
and World Business Council for Sustainable Devel-
opment.
ANINTEGRATIONPLATFORMFORIT-FOR-GREEN-IntegratingEnergyAwarenessinDailyBusinessDecisionsand
BusinessSystems
231
