
Exploring Structural Properties of Web Graphs through 3D
Visualization
Zhiming Chen, András Faragó and Kang Zhang
Department of Computer Science, The University of Texas at Dallas, 800 West Campbell Road,
Richardson, TX 75080, U.S.A.
Keywords: Web Graph, Web Mining, Hierarchy Visualization, Stochastic Model, 3D Visualization.
Abstract: The link structure of the World Wide Web is generally reckoned as a Web graph. Understanding the
structure of the Web graph is crucial to effective modeling of the Web. One approach that facilitates this
understanding is to provide sophisticated visualization tools for users to intuitively view the Web structure.
Many structural properties of a graph can be revealed by visualization so that direct comparison between
different Web graph models and real Web graph samples become possible. Our approach visualizes Web
graphs in microscopic and macroscopic levels in a three dimensional space and also uses a structural mining
method to specify isolated cliques or other meaningful structures in Web graphs which provides an
innovative perspective in visualization of large graphs.
1 INTRODUCTION
The Web graph is a real-world network with vertices
representing World Wide Web pages and edges
corresponding to the hyperlinks between pages
(Munzner and Burchard, 1995). It is growing
exponentially with time and has become a
fascinating object of study. Using visualization
techniques to present the network to analysts and
allowing them to interactively explore and
understand structures are a novel approach to study
the Web graph. In this paper, we devise a three
dimensional visualization tool to present Web
graphs in both microscopic and macroscopic levels.
Compared to mathematical modeling methods
(Barabási and Albert, 1999), our visualization tool
identifies and highlights interesting sub-graph
structures such as Web cliques which may otherwise
be ignored. By using force-directed layout to plot
Web graphs in a 3D space, graphs can be resized and
perceived from different perspectives, thus users can
explore Web graph more flexibly. Besides, based on
the structural properties of Web graph samples
demonstrated by our tool, we observe the differences
between different Web graph models which are
meant to match structural properties of real Web
graphs and evaluate them accordingly.
Most traditional visualization techniques on Web
graphs suffer from visual clutter and only scale up to
a small portion of Web vertices. The challenge is to
handle a large volume of data to make it
representative. In our visualization tool we adopt a
clique collapse strategy to simplify complex graphs.
By mining and collapsing cliques inside a graph, a
hierarchical visualization framework is achieved.
The 3D visualization tool can be used for the
following purposes:
Visually exploring large-scale Web graphs: the
visualization establishes a hierarchical framework of
the Web graph and allows users to interactively
explore it at different levels. It visually reveals both
local clustering and global link structures.
Guiding Web model analysis: the visualization
can assist users in assessing and understanding some
Web graph models by clique highlighting.
The paper first reviews several key Web
visualizations in section 2. Section 3 describes the
design details and features of our three dimensional
visualization tool. In section 4, a real Web graph is
presented. Our work is completed by comparing
graphs generated by 3 important Web graph models
using the tool. Finally, section 5 concludes the paper
and points out future research directions.
2 RELATED WORK
There has been a lot of work related to Web
233
Chen Z., Faragó A. and Zhang K..
Exploring Structural Properties of Web Graphs through 3D Visualization.
DOI: 10.5220/0003979502330238
In Proceedings of the 14th International Conference on Enterprise Information Systems (ICEIS-2012), pages 233-238
ISBN: 978-989-8565-11-2
Copyright
c
2012 SCITEPRESS (Science and Technology Publications, Lda.)

visualization. Narcissus (Hendley et al., 1995)
produces a graph-like representation of Web pages.
It focuses chiefly on the layout algorithm and one
problem is that a small change can cause the system
to re-organize. Natto (Shiozawa and Matsushita,
1997) demonstrates a method of de-occlusion by
manual control; however, selection becomes
difficult when the number of nodes increases.
WebPath (FrÈcon and Smith, 1998) generates a
three dimensional representation of a Web browsing
history within the DIVE (distributed virtual reality
environment). The layout is orthogonal so that the
maximum degree of node is limited. WWW3D
(Snowdon et al., 1997) incrementally constructs a
3D map of the user's current browsing session.
WWW3D suffers from limited scalability.
Munzner and Burchard (1995) visualize the
structure of sections of the Web by constructing
graphical representations in 3D hyperbolic space.
Lai and Huang (2010) combine Web data extraction
and graph layout techniques for WWW navigation.
However, they both lack the interactive interfaces
for users to manipulate the visualization.
There are also visualizations about social
recommendation (Gretarsson et al., 2010), Web
caching hierarchy (Huffaker et al, 1998) and Web
cluster engine (Giacomo et al., 2007). They take
advantage of a variety of computer graphics
techniques and emphasize on graphic design.
To differentiate from the above listed Web
models, we combine Web structure mining with
information visualization techniques. Interesting
substructures such as cliques of Web graph are
located by a fast algorithm. And using clique
collapsing method a hierarchical framework of the
Web is built accordingly and displayed in 3
dimensional spaces.
3 DESIGN AND FEATURES
The following phases are necessary for generating
our 3D visualization tool to explore the Web graphs.
Phase one: use Web structure mining methods to
extract and highlight meaningful cliques in the Web
graph.
Phase two: apply modified force directed
algorithm to plot Web graph in 3 dimensional
spaces. In this phase, in order to run force directed
algorithm effectively, the Web graph containing
Web cliques need to be pre-processed.
3.1 Web Clique Identification
3.1.1 Characteristics of Web Cliques
In graph theory, a clique in an undirected graph is a
subset of its vertices such that every two vertices in
the subset are connected by an edge. A clique in a
Web graph (without considering the direction of the
edges) generally represents strongly related Web
pages which share the same topic, views or interest
and the size of cliques may reflect the popularity of
common topics. Most isolated cliques on the Web
correspond to menu structures and usually exist in
single domains, and can be quite useful for detecting
harmful link farms (Uno, Ota and Uemichi, 2007).
Mining Web cliques is very useful, e.g. it can help
users better understand the evolution of Web content
and structure. Related research field such as Web
community identification has become quite popular.
Cliques are isomorphic such that all cliques of
the same size are equivalent. When comparing
objects, it is desirable to evaluate their properties
which seldom change. Cliques of a graph can serve
as invariants since the clique structure always
remains the same no matter how graph is
represented. The clique distribution may vary
significantly among Web graphs even if they may
look similar. By highlighting cliques inside graphs,
we may distinguish different graphs with better
precision.
3.1.2 Finding Web Cliques Recursively
Web graph is power-law degree distributed and
sparse. Therefore the size of most cliques is limited.
Even though max-clique algorithm is NP-complete,
we may still find a reasonable number of cliques in a
Web graph sample which can truthfully represent the
clique distribution. We modified the algorithm of
Carraghan and Pardalos (1990), one of the best
clique mining algorithms in sparse graphs. The
algorithm goes through each node to discover the
largest clique containing it and thus obtains a
distribution of cliques which defines a structural
property of the graph. The pseudo code of our
modified algorithm for finding Web cliques is
described below.
Find Web Cliques:
function clique(U, size, Set)
if |U|:=0 then
if size > max then
max := size;
maxClique := Set;
save Set;
end if
remove last one of Set;
ICEIS2012-14thInternationalConferenceonEnterpriseInformationSystems
234

return;
end if
while U ≠ ∅ do
if size + |U|<max then
return;
end if
i:=min{j |vj
U};
U:=U\{vi};
add i to Set ;
clique(U ∩ N(vi),
size +1,
Set);
end while
remove last one of Set;
return;
function FindClique(targetSize)
for each vi in V
max:=0;
maxClique:= ∅ ;
clique(V, 0, {vi});
If |maxClique|≥ targetSize
save maxClique;
end for
return;
Running this algorithm on the original graph
generates a set of cliques which forms the first-level
clique set. To compute higher level clique sets, each
clique in the lower-level is collapsed as a hyper-
node. A residual graph is the new graph containing
hyper-nodes. Higher-level cliques are obtained by
recursively running this algorithm on residual
graphs. The iteration terminates when there is no
clique left (as Figure 3(d) shows). Because this
procedure reduces the complexity of a graph in each
round of clique collapsing, the residual graphs will
be much easier to understand; thus more information
of the graph can be unveiled.
3.2 Force Directed Web Graph Layout
After discovering cliques in the Web graph, the next
step is to plot the Web graph in 3D spaces. The
reason to choose three dimensional spaces rather
than two dimensions is that with proper layout and
semiotic (Parker, Frank and Ware, 1998), 3D allows
large network to be visualized more effectively. In
3D visualization, links are less likely to cross than in
2D diagrams. Equipped with spatial navigation and
interaction, 3D interfaces are capable of displaying
much larger volume of information in a single
display, and users may more easily learn the
structure of the Web. In this section, we are going to
introduce modified force directed algorithm which is
adopted to arrange the Web graph layout.
3.2.1 Force Directed Algorithm
Force directed algorithms bring in attraction forces
between linked nodes and repulsion forces between
unlinked nodes. Fruchterman and Reingold (1991)
introduce a temperature system in which the
temperature is reduced during each iteration. When
the minimum temperature is reached, the algorithm
stops. Force directed algorithm makes dense sub-
graphs more likely to stay together because of higher
attraction force between them, as shown in the
examples in Figure 1. We modify the algorithm to
first generate layout on x and y coordinates and then
fix them to generate z coordinate. This approach
effectively avoids node overlap on x and y
coordinates.
Figure 1: The above two graphs are identical. Notice that
plotting using force-directed algorithm shows clusters
better than random plotting.
3.2.2 Pre-processing
A forced directed algorithm can typically produce a
reasonable layout for most general graphs. However,
the technique does not scale well. To improve the
performance when dealing with large graphs, we use
a preprocessor for graph drawing. The preprocessor
attempts to obtain a reasonably good initial drawing
to be then used by force directed algorithm. The
preprocessor works in 4 steps:
Step1: Divide the two dimensional grid into unit
size squares based on the number of nodes
Step 2: Find the node with the highest degree and
put it in centre position.
Step 3: Starting from the centre node, enumerate
all its neighbours and assigning each neighbour to its
nearest free location on the grid.
Step 4: Continue step3 as BFS. If a conflict
occurs, due to the desired location being occupied by
another node, pick the next nearest location.
After allocating every node, we obtain a graph
layout where most edge lengths remain close to the
distance of unit square, and related nodes are
clustered together. This initial drawing produces a
layout that is closer to the final drawing than a
random scattering of nodes and so allows fewer
invocations of the force directed algorithm to
produce an equally stable drawing.
ExploringStructuralPropertiesofWebGraphsthrough3DVisualization
235
4 IMPLEMENTATION AND
EXPERIMENT RESULTS
In summary, our 3D visualization tool consists of the
following functions: firstly it provides a good first
look with pre-processing and force directed layout.
Secondly, it reveals structural properties of the Web
graph such as cliques and illustrates technique to
simplify large and complex graphs. As discussed in
former section, Web cliques are to be collapsed into
hyper-nodes. Last but not the least, users can view
from multiple perspectives and manipulate the
visualization by various navigation functions such as
scaling, rotating and moving with a mouse. Our tool
uses Java3D (<https://java3d.dev.java.net/>) to
implement.
4.1 Data Sets
The source of Web graph samples in the experiment
originates from WebGraph (WebGraph, <http://web
graph.dsi.unimi.it/>). WebGraph is a framework for
graph compression aimed at studying Web graphs. It
provides easy access to datasets for very large graph
gathered from the Web. For such large data sets,
efficiency is always a concern. Our clique finding
algorithm runs very well on real Web graph samples.
In most case, it will find the clique distribution in
less than one second when samples are less than
1000 nodes. It can run up to 500,000 nodes within
one hour on an average PC.
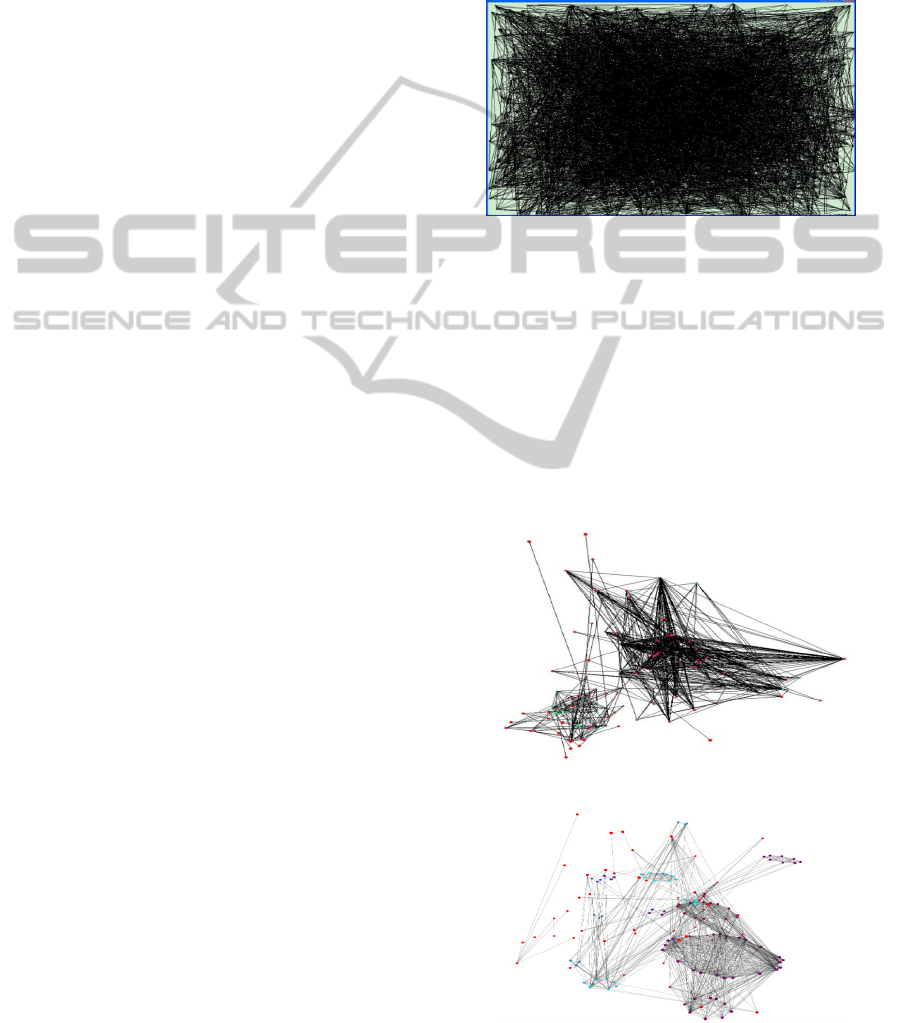
Our tool can visualize Web graph samples with a
couple of thousands nodes. Figure 2 shows one of
them. With just about 1000 nodes, the canvas has
already been fully filled. Since our visualization tool
is able to rescale on 3D screen, users could zoom in
to part of the large graph which detailed structure of
smaller sub-graphs would be displayed.
4.2 Navigation Functions
A rich set of navigation and selection functions has
been developed for the 3D visualization.
Zooming and panning: This is the basic function.
Users can zoom in, zoom out and panning to gain
better view.
Showing names: By putting the cursor on the
display area, the topic or interest names of all
cliques covering the cursor position are show in a
message bar.
Rotating: By dragging the view, user can observe
the graph from different aspects. It’s also an efficient
way to eliminate clique overlapping.
Layer reordering: When double-clicking on a
clique, a user can push the view to lower level which
shows the containing nodes of that clique. On the
other hand, by selecting a large area of the display
and click, the display will jump to high-level view
with all possible cliques in the selected area
collapsing to a hyper-node.
Navigation functions operate in a very timely
manner which delays between operations are mostly
negligible.
Figure 2: The overview of a large Web graph with more
than 1000 nodes.
4.3 Clique Drawing
In our plotting of Web graphs, each page is
represented by a transparent sphere. Each node
within a clique is placed around a cycle. Overlap
between cliques is avoided. We use different color
for each clique to make them evident and easy to
observe. Figure 3 shows screenshots of a real Web
graph with 150 nodes. The process of clique
collapsing is also explained.
3(a): The initial drawing using force directed algorithm.
3(b): After highlighting the cliques, we can see there are several
large cliques.
ICEIS2012-14thInternationalConferenceonEnterpriseInformationSystems
236
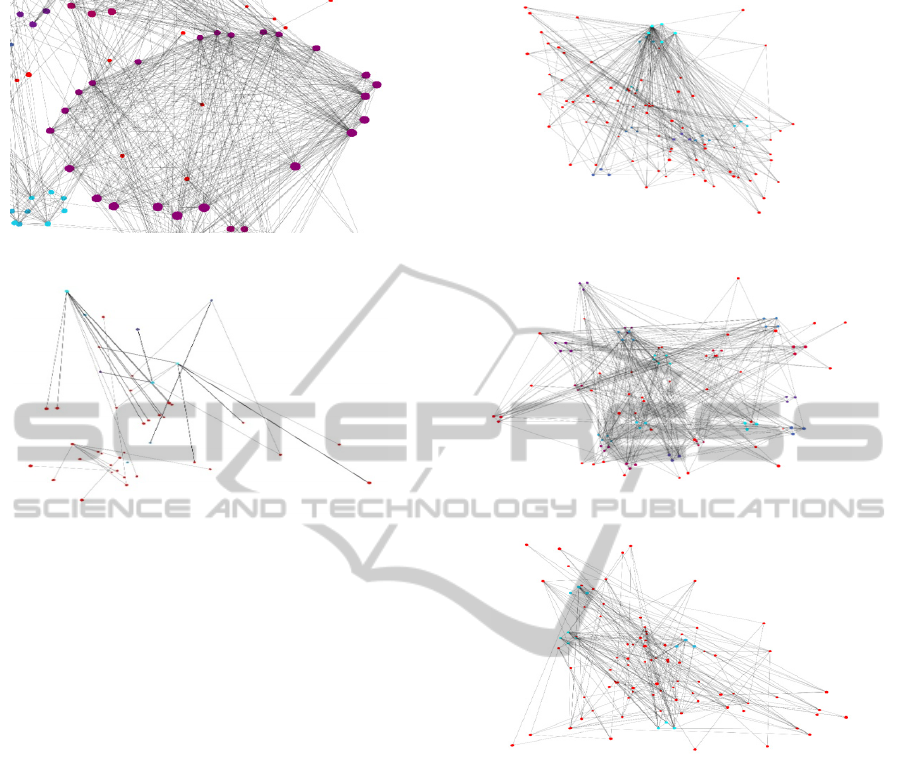
3(c): A close-up view of the largest clique.
3(d): The graph after collapsing all cliques. Each node in the
graph represents a Web page or a hyper-node consisting of
cliques.
Figure 3: The drawings of a real Web graph.
4.4 Comparison of Three Web Graph
Models
Many models have been proposed to simulate the
Web graph. Most work on Web graph models has
been concentrated on theoretical proof. Visualizing
graphs generated by those models provides an
intuitive method to compare similarities and
differences. We visualize three of the key stochastic
models and reveal several interesting results.
In preferential attachment model (Barabási and
Albert, 1999), each step a new vertex is inserted in
the graph and it connects to a constant number of
existing vertices chosen proportional to their degree.
The Copying model (Kleinberg et al., 1999) selects
an existing vertex for every new vertex uniformly
at random. The new vertex connects to other
existing vertices ( ∈
). For each of the
vertices, it is either a neighbour of vertex with
probability (∈
0,1
), or it is selected at random
with probability 1−. In geometric Web graph
model (Flaxman et al., 2004), new vertices only join
to existing vertices within a certain distance apart.
Edges are then chosen by preferential attachment
within that range.
4(a): Preferential attachment model.
4(b): Geometric Web graph model.
4(c): Copying model.
Figure 4: Graphs generated by three Web graph models.
We generate simplified version of the above
Web graph model with undirected edges. All three
graphs have 100 nodes and 450 edges. The results
are shown in Figure 4. Though theoretical proof can
make sure Web graph models do not violate well-
founded properties of Web graph, it does not specify
the detailed structures generated by different models.
Since graphs generated by the same model follow
same set of rules, we can reasonably assume that a
smaller graph would have the same structural
properties of a larger graph. That means, we can
compare differences of graphs generated by different
models on a fairly small scale. And visualization can
facilitate this process by exposing an intuitive view.
Even in a smaller scale, the differences of three
Web graph models are visible. Geometric Web
graph model is more scattered but most of the nodes
ExploringStructuralPropertiesofWebGraphsthrough3DVisualization
237

belongs to a clique of small size. While there are not
many nodes of high degree, most nodes in copying
model are also not within a clique. LCD PA model is
more centralized and prone to form less but larger
cliques, and several nodes have a very high degree.
If we visualize other important structures such as
bipartite clique, the difference might be more
noticeable. Further research on Web graph
properties will provide more criteria to decide which
models are more accurate. Visualization approach
can serve as an assisting technique during the
exploration of better models of Web graph.
5 CONCLUSIONS
It is a challenging and meaningful work to visualize
the Web graph due to its size and complexity. Our
approach provides the user with a structured view of
the Web graph by identifying and visualizing Web
cliques. Users can explore Web graphs from
different perspectives and manipulate the
visualization using navigation functions such as
scaling, rotating and clicking. We highlight and
collapse Web cliques inside a Web graph to obtain a
hierarchical visualization framework. The idea
behind it is to use efficient algorithms that leverage
the graph structure to recursively analyze a less
complex graph. Further extension by mining other
interesting structures such as bipartite graphs, stars,
quasi-cliques could be considered according to
needs.
The Web clique based 3D visualization also
suggests a new angle to compare and analyze
different existing Web graph models. The
comparison between Web graph models to very
large real Web graphs and discussion of other
possible Web graph models would be our future
work. What’s more, the 3D visualization techniques
in this paper can also be applied to other types of
graphs such as file systems with symbolic links, or
biomedical graph research.
REFERENCES
Barabási, A., Albert, R., 1999. Emergence of Scaling in
Random Networks. Science, 286, 509-512.
Carraghan, R., Pardalos, P. M., 1990. An Exact Algorithm
for The Maximum Clique Problem. Operations
Research Letters, 9, 375-382.
Flaxman, A. D., Frieze, A. M., Vera, J., 2004. A
Geometric Preferential Attachment Model of
Networks. In WAW’04, Algorithms and Models for the
Web-Graph: Third International Workshop. Springer.
FrÈcon, E., Smith, G., 1998. WebPath - A Three
Dimensional Web History. Proceedings of IEEE
Symposium on Information Visualization, 9, 3-10.
Fruchterman, T. M. J., Reingold, E. M., 1991. Graph
Drawing by Force-Directed Placement. Software
Practice & Experience, 21(11), 1129-1164.
Giacomo, E. D., Didimo, W., Grilli, L., Liotta, G., 2007.
Graph Visualization Techniques for Web Clustering
Engines. IEEE Transactions on Visualization and
Computer Graphics, 13(2), 294-304.
Gretarsson, B. O., Donovan, J., Bostandjiev, S., Hall, C.,
Höllerer, T., 2010. SmallWorlds: Visualizing Social
Recommendations. Computer Graphics Forum, 29,
833-842.
Hendley, R. J., Drew, N. S., Wood, A., Beale, R., 1995.
Narcissus: Visualizing Information. Proceedings of
the 1995 Information Visualization Symposium, 90-96.
Huffaker, B., Jung, J., Wessels, D., Claffy, K., 1998.
Visualization of the Growth and Topology of the
NLANR Caching Hierarchy. Computer Networks and
ISDN Systems, 30, 2131-2139.
Kleinberg, J. M., Kumar, R., Raghavan, P., Rajagopalan,
S., Tomkins, A. S., 1999. The Web as a Graph:
Measurements, Models, and Methods. In
COCOON'99, 5th Annual International Conference on
Computing and Combinatorics. Springer-Verlag.
Lai, W., Huang. X., 2010. From Graph Data Extraction to
Graph Layout: Web Information Visualization. In
ICIS’10, 3rd International Conference on Information
Sciences and Interaction Sciences. IEEE Press.
Munzner, T., Burchard, P., 1995. Visualizing the Structure
of the World Wide Web in 3D Hyperbolic Space. In
VRML'95, 1st Symposium on Virtual Reality Modeling
Language. ACM.
Parker, G., Frank, G., Ware, C., 1998. Visualization of
Large Nested Graphs in 3D: Navigation and
Interaction. Journal of Visual Languages &
Computing, 9(3), 299-317.
Shiozawa, H., Matsushita, Y., 1997. WWW Visualization
Giving Meanings to Interactive Manipulations.
Advances in Human Factors/Ergonomics, 21B, 791-
794.
Snowdon, D., Benford, S. D., Greenhalgh, C. M., Ingram,
R., Brown, C. C., FahlÈn, L., Stenius, M., 1997. A 3D
Collaborative Virtual Environment for Web Browsing.
Proceedings of the Virtual Reality WorldWide'97.
Uno, Y., Ota, Y., Uemichi, A., 2007. Web Structure
Mining by Isolated Cliques. IEICE Transactions on
Information and Systems, E90-D, 1998-2006.
ICEIS2012-14thInternationalConferenceonEnterpriseInformationSystems
238
