
Changing Concepts in Human-Computer-Interaction
in Real-time Enterprise Systems
Introducing a Concept for Intuitive Decision Support in SCM Scenarios
Christian Lambeck
1
, Dirk Schmalzried
2
, Rainer Alt
3
and Rainer Groh
4
1
Technical University Dresden, 01062, Dresden, Germany
2
OR Soft Jänicke GmbH, Geusaer Str., FH, 104, 06217, Merseburg, Germany
3
University Leipzig, 04109, Leipzig, Germany
2
Technical University Dresden, 01062, Dresden, Germany
Keywords: Visual Business Intelligence, Business Analytics, Real-time Supply Chain Management, Decision Support,
Radial Basis Functions, Scheduling.
Abstract: In current research, Enterprise Information Systems (EIS) are increasingly based on In-Memory-
Technologies, resulting in extremely fast response times for a multitude of typical system requests. In addi-
tion, up-to-date hardware configurations apply multi-core processing units, which lead to an availability of
immense computing power. Instead of a single result value, a whole result set is calculated within the same
period of time. Because of these dramatic changes in technology, many business processes, currently still
characterized by mask and dialog oriented user interfaces, will change to interactive and simulation based
approaches. This allows for the introduction of innovative, interactive and simulation based business pro-
cesses instead of conventional batch oriented ones. In the combination of the described interaction concept
in this contribution and the handing of result sets as described above, the authors expect a fusion of opera-
tional (e.g. supply chain management) and analytical (e.g. business intelligence) application systems. To
achieve this goal, the usage of assessment functions for weighting results, multi-dimensional result space
folding based on similarity measures and visualizations using 3D-landscapes based on radial basis functions
is suggested.
1 INTRODUCTION
Latest research on Enterprise Information Systems
(EIS) and their underlying production methods has
been manifold and primarily focused on perfor-
mance and real time issues (Plattner and Zeier,
2011), Service-Oriented Architectures (SOA)
(Ollinger et al., 2011) as well as sensor technologies.
Especially the consistent vertical interoperability of
these services and standards across the levels of
automation (ISA, 2012) and the application of the
Internet of Things to the production domain are
current challenges (Kortuem et al., 2010). New pro-
duction methods like modular 3F factories (Buch-
holz, 2010) as well as increasing complexity and
dynamic of supply chain processes themselves rein-
force the desire for extensive simulation enabled
supply chain planning with a focus on varying input
parameters and resulting outcome.
As a consequence of these changed conditions in
production logistics and new objectives in the field
of SCM a fundamental redesign of upcoming SCM
systems is required. Especially rapidly alternating
influential factors such as volatile raw material and
transportation costs, volatile exchange rates and
other volatile cost-influencing parameters have to be
taken into account. In order to derive a reliable and
suitable business conclusion, simulative “What-if”-
scenarios are more important than ever and have to
comprise these volatile parameters comprehensively.
By these risen claims, users demand for exten-
sive simulation based planning tools. Their ability to
vary input parameters and examine their effects on
the resulting outcome reveals a powerful potential.
Although simulative approaches in EIS exist, current
state of the art systems fail to fulfill those require-
ments sufficiently. Since they were designed in the
middle of the 90’s, stringent hardware limitations
had to be considered. In contrast, future RAM-based
139
Lambeck C., Schmalzried D., Alt R. and Groh R..
Changing Concepts in Human-Computer-Interaction in Real-time Enterprise Systems - Introducing a Concept for Intuitive Decision Support in SCM
Scenarios.
DOI: 10.5220/0003984201390144
In Proceedings of the 14th International Conference on Enterprise Information Systems (ICEIS-2012), pages 139-144
ISBN: 978-989-8565-10-5
Copyright
c
2012 SCITEPRESS (Science and Technology Publications, Lda.)

computers with Multi-core support enable the user to
generate whole result sets instead of a single value in
a fractional amount of contemporary time consump-
tion. This trend allows the combination of opera-
tional and analytical processes. As a result, sophisti-
cated answers for a variety of complex SCM prob-
lems can be given in almost real time.
Attendant to the increased possibilities in han-
dling complex information sets, related user inter-
face principles have to change accordingly. Never-
theless, user interface design principles in the field
of EIS have been rarely subjected to research within
the last years. While multi-touch devices and corre-
sponding interface concepts are widespread in other
domains as illustrated in (Lima, 2012), enterprise
applications – especially in the upper levels of au-
tomation – are still dealing with transactional inter-
faces that consist of forms, tables and dashboards
and are meant to be controlled by mouse and key-
board (e.g. SAP R/3 UI- History in (SAP AG,
2012)).
Due to the novelty of visual and explorative sim-
ulation and interaction techniques in EIS, related
research on human-computer-interaction can be
rarely found. This contribution proposes a user inter-
face concept for the exploration of a three dimen-
sional landscape consisting of sampling points. The-
se “Data Landscapes” indicate a production plan’s
objective fulfillment through Key Performance Indi-
cators (KPI). Relevant challenges such as aggregat-
ed information presentation, real time interaction
and their preliminary considerations on performance
and algorithms are also addressed.
2 RELATED WORK
Nowadays, production and simulation related Enter-
prise Resource Planning Systems (ERP) – particular-
ly in Small and Medium Enterprises (SME) – are
customarily supported by Excel-sheets and are lim-
ited to textual or diagram output (Elizandro, 2008;
Gissrau and Rose, 2011). The majority of these tools
visualize the production plan as a Gantt-Chart, but
direct interaction is rarely supported at all. In addi-
tion, adequate presentations which give an insight to
complex correlations - like the simultaneous plan-
ning of material flows and the related resource con-
sumption - are often missing. In general, offered
visualizations are subjected to reporting in most
cases, whereas wide parts of the business process
remain textual. This might be one of the reasons for
current usability problems as described in (Topi et
al., 2005).
The research project Mind Map APS (DLR, 2010)
assumed an upcoming fundamental change in the
handling of enterprise applications within the next
years. Therefore, the three aspects Search Engine
based System Access, Interactive Business Process
Modeling and Zoomable User Interface Design were
taken into account to investigate their potentials. As
a primary goal, users should be able to interact with
the system more intuitively through map-based,
interactive and scalable process visualizations. Alt-
hough the estimated breakthrough could not be fully
achieved, several prototypes were conceived which
deal with 3D visualizations in oil industry, mobile
process assistance for healthcare scenarios or seman-
tic search paradigms to ease the user’s system ac-
cess.
Real-time EIS based on In-Memory technologies
allow response generation, which is faster by speed
decades. Therefore, many business processes, cur-
rently characterized by sequential and iterative dia-
logs, are changing to simulated ones with parallel
computations (Karnouskos et al., 2010). While ERP
systems facilitate the concept of simulation insuffi-
ciently, additional Advanced Planning and Schedul-
ing (APS) applications have been introduced (Stad-
tler and Kilger, 2008, p.109). The involved deficien-
cies that result from the split system landscape are
different data models and potential import/export
problems, time delays or problems while merging
simulation alternatives with real plans.
3 BUSINESS PROCESS
The proposed design causes some challenges in the
practical implementation. This primarily derives
from the vast amount of data to be processed (stor-
age issues), requirements on short response times
(performance issues) and finally the novel interac-
tion and its resulting user acceptance (interface is-
sues). In the following, challenges regarding con-
densed data as well as real-time interaction on these
consolidated information are discussed.
3.1 Benefits of Planning Processes
based on Simulative Result Sets
To bridge the before mentioned gap in current sys-
tems, standard and sequential ERP processes could
be redefined in a real-time EIS as follows:
After the adjustment of initial parameters for an
overall optimization objective in a first step, the
system generates a whole set of results at once. For
the step of computation, optimization methods as
ICEIS2012-14thInternationalConferenceonEnterpriseInformationSystems
140

well as heuristics are applicable. The emerging
planning alternatives are presented in a summarized
visualization instead of a series of individual results
in a sequential user dialog. The major benefit is an
explicit and direct comparability of the suggested
planning solutions.
The parameter variations in a production sched-
uling task might reach from different objective func-
tions (e.g. maximized profit margin; minimal profit
margin with restocking, meeting delivery dates) to
additional restrictions (stock clearance, enforcing
batch clearance). Thereby a combination of these
restrictions is also possible, so that a composite and
complex schedule optimization task is formed. Fi-
nally, specific production schedules arise which
would be typically presented as Gantt-Charts. How-
ever, comparing those Gantt-Charts – or even a
subset – is a challenging task for users and consti-
tutes the sequential and iterative dialog structure
mentioned before.
3.2 From Gantt-Charts to Key
Performance Indicators
A more convenient way than traditional Gantt-
Charts is the comparison of summarizing Key Per-
formance Indicators (KPI) for each generated plan-
ning alternative, which again can be used to evaluate
SCM objective satisfaction (e.g. quality, due dates,
margins, flexibility and demand fulfillment). In most
cases it is sufficient to choose the best fitting sched-
ule out of the sample space and proceed with the
business process. In other cases of composite result
evaluation functions it might be helpful to investi-
gate each component’s impact on the composite KPI
separately.
If none of the resulting production schedules sat-
isfies the business needs or if all resulting objective
functions are not satisfying, it could help to start a
new simulation run with better parameterization.
Therefore users have to slightly vary the parameters
specifically in those regions where already promis-
ing schedules have been found. In consequence, the
level of detail for this region would be increased by
any of these iterations until the identified result is
satisfying. To receive further reference points for
regions of favorable schedules and to fully use the
interactive and simulative potential of real-time EIS,
a suitable visualization technique is required. In the
following section, the established concept of Data
Landscapes is presented and gets adapted to the field
of EIS and SCM in particular.
3.3 From Key Performance Indicators
to Data Landscapes
The authors suggest a projection of the generated
schedules into a plane using folding algorithms
based on similarity criteria. This plane uses Time as
one dimension and Resource Utilization as the other.
Contrary to Gantt-Charts that use time and resource
allocation as well, this plane cannot provide a specif-
ic time or resource predication. Instead it is able to
illustrate the neighborhood and therefore the similar-
ity of production schedules. Hence, similar sched-
ules are projected closely to each other onto that
plane which is caused by the multidimensional fold-
ing algorithm.
One appropriate method for neighborhood pre-
serving multidimensional folding of production
schedules are Self-Organizing Maps - so called Ko-
honen Maps (Kohonen, 2001) - known from neural
networks. Each production schedule is uniquely
defined by the set of contained production orders,
which again define an unambiguous temporal alloca-
tion of resources and material flows. Thus, the pro-
posed folding delivers reproducible nodes in the
map.
This plane layer can be extended into a third di-
mension by applying an evaluation function on top
of these nodes. The evaluation function typically
results in KPIs to be used for measuring the fulfill-
ment of the SCM targets. The resulting sampling
points can be joined using radial basis functions, for
example, to form three dimensional Data Land-
scapes (see (Carr et al., 2001)). Despite the suggest-
ed radial basis functions, equivalent construction
techniques for Data Landscapes are also applicable,
of course.
Besides a uniform evaluation function, the use of
“mountain stacks” might be suitable, in which differ-
ent parts of the evaluation function (e.g. separated by
margin, demand fulfillment, deadlines) are added
consecutively. This allows for weighting certain input
parameters and also considering particular thresholds
(e.g. all schedules reaching a certain margin).
3.4 Exploring Regions of Interest
In regions around a local maximum, probably more
interesting production schedules can be found. By
recalculating with slightly modified parameteriza-
tion, the resolution of this designated area can be
increased and the user might detect more interesting
production schedules that are even closer to the
current objective. Due to the suggested method,
additional nodes will be located closely to the exist-
ChangingConceptsinHuman-Computer-InteractioninReal-timeEnterpriseSystems-IntroducingaConceptforIntuitive
DecisionSupportinSCMScenarios
141

ing one with a high probability. However, the fold-
ing of those multidimensional schedules into a two
dimensional plane cannot avoid the partial place-
ment of sampling points outside the current region
of interest. The following example illustrates the
effect that might occur:
The proposed method as described above would
create a landscape with 16 different sampling points
(16 CPUs could deliver those simultaneously),
which are distributed non-equidistantly across this
map. We assume that there are two sampling points
in region A and that their evaluation function (KPI)
has a significant maximum here. Hence they repre-
sent promising schedules and deserve closer atten-
tion. A next recalculation run on the same region
with slightly changed parameterization generates 16
additional sampling points. Due to the marginal
modification of the input parameters, the majority of
them would reside in this region, but some of them,
as a result of the folding, might reside in a totally
different region of the map. The resulting resolution
has increased again and would allow for a third
iteration. After three runs, 48 sampling points are
distributed across the Data Landscape where most of
them reside in the region of interest.
4 USER INTERFACE CONCEPT
Figure 1: Business Process Dialog Model.
The preceding sections focused on the suggested
business process with its benefits compared to the
conventional approach. In this section, a concrete
user interface concept is described, which is meant
to be used on a touch-sensitive tabletop system. The
described process is split into four steps as illustrat-
ed in Figure 1.
In contrast to most existing applications, the whole
business process is controlled by a single view to
avoid usability problems as described in (Topi et al.,
2005) (identification of and access to the correct
functionality, transaction execution support, overall
system complexity etc.).
4.1 Selection of Calculation Parameters
As a first step, the user has to set the initial parame-
ters (see section 3.1) which affect the selection of
the simulation algorithm and adjust it according to
the optimization objective. Therefore, parameters are
selected in the lower left area of the screen (see
Figure 2). On the right of the selection buttons, users
are able to adjust the influence of a selected item by
sliding the value between a minimum and maxi-
mum. Because the parameters partially affect each
other, their final composition is depicted below the
current slider. This way, users are always aware of
the consequences during their direct manipulation.
Once the parameters are selected and set as desired,
the system generates the result set as described in
section 3.1. Finally, a Data Landscape consisting of
several sampling points gives a first overall impres-
sion of the result set’s potential to satisfy the objec-
tive.
4.2 Result Presentation
Whereas conventional systems usually illustrate the
simulation results in a textual manner, the Data
Landscape approach has the ability to give an im-
pression of the result set’s quality at once. Each peak
represents a concrete production plan which is posi-
tioned according to the axis Resource Utilization and
Time. Therefore, plans with similar properties in
utilization and time can be found within the same
region. The height of the peak as an indicator for the
achievement of objectives is build upon the sum of
its Key Performance Indicators (KPI, see section
3.2). This means, that each KPI corresponds to a
particular SCM objective and represents its partial
fulfilment. Hence, the parts for quality, due dates,
flexibility et cetera add up to final height and form
the overall KPI for that designated production plan.
4.3 Region Selection and Drill-Down
In a next step, users might want to explore a promis-
ing area in more detail – a so called Drill-Down.
Therefore, a top view of the Data Landscape is illus-
trated in the middle part of the lower control view.
To select a region, users simply create a rectangle
Selecon of
Calculaon
Parameters
Visualisaon of
KPIs as Data
Landscape
Exploraon of
KPI Composion
and Prod. Plans
Detailed
Region
Selecon
Drill-
Down
Parallel Calculaon of
N Producon Plans
Explore Data
Mountain
Transformaon of Region to
a fine-grained Parameter Set
1
2a
3
2b
ICEIS2012-14thInternationalConferenceonEnterpriseInformationSystems
142
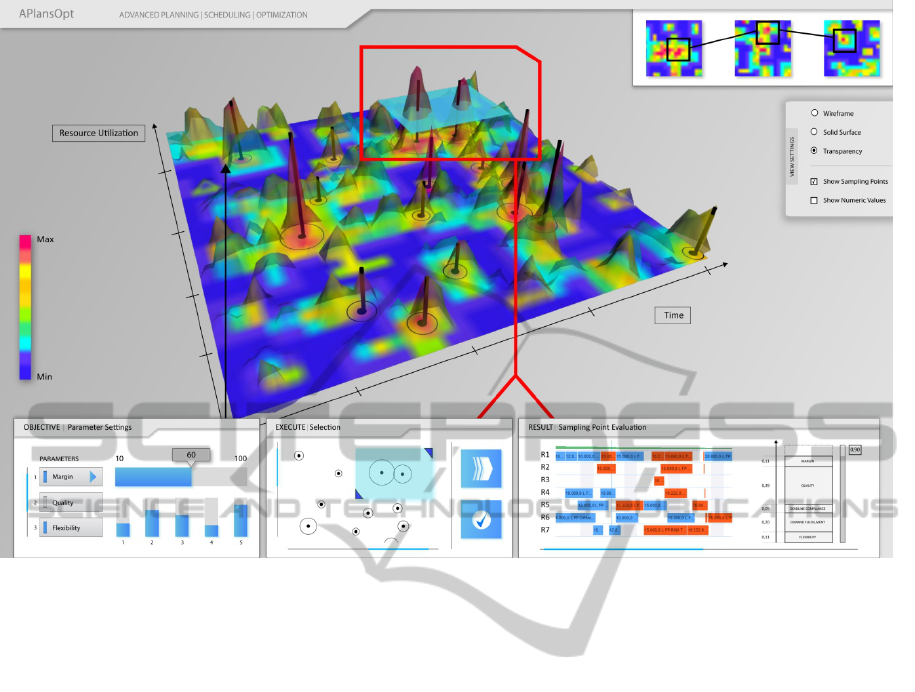
Figure 2: Suggested user interface concept with control views for parameter settings (bottom left: Objective), region selec-
tion with next iteration calculation (bottom centre: Execute) and Drill-Down with Gantt-Chart and KPI composition (bot-
tom right: Result). The overlay indicates the Drill-Down from a selected peak to its KPI composition and the related pro-
duction plan. The upper right series of snapshots illustrates the iteratively zoomed in regions in the manner of a detail-and-
context. View settings (e.g. wire-frame, solid, transparent) can be adjusted in the options menu at right of the screen.
and size it to the desired dimensions. Simultaneous-
ly, a plane with same dimensions is placed in the 3D
model to highlight the current area and its included
peaks. However, the selection of several independ-
ent regions is not possible at present. The details of
the current selection are illustrated in the lower right
part of the screen, where the KPI composition and
the corresponding plan’s Gantt-Chart are visualized.
After having examined the area peak by peak, the
former selection plane might be adjusted again to
restrict or enlarge the amount of included sampling
points accordingly. Once the identification of valua-
ble production plans is accomplished, a further itera-
tion can be started which is primarily focused on the
selected area. As described in section 3.2, the initial
parameters are getting slightly adjusted for the next
run and influence the upcoming iteration. Although
not all of the computed results might be located in
the area due to the parameter adjustment, its resolu-
tion is permanently increased by each iteration. In
the end, the selected region gets more and more fine-
grained in detail whereas the surrounding region
remains widely coarse-grained. If a satisfying pro-
duction plan is found, the recursive workflow ends
up by applying the final production plan.
5 CONCLUSIONS
The suggested user interface concept with its related
adapted business process allows for the intuitive
presentation of different production schedules and
their corresponding KPIs. In addition, the compari-
son of these schedules as well as the iterative ap-
proximation to more promising production plans is
supported in a visual way.
Changing the conventional usage concept of En-
terprise Applications as described in this contribu-
tion could exploit the potential of novel real-time
EIS. Business analytics, business intelligence and
operational design would fusion and could form a
comprehensive insight into simulative information
spaces. The concept of planning is transferable to
other domains of operational systems, such as blend
optimization, make-or-buy decisions, variations on
raw material costs as well as the strategic simulation
of material portfolios, geographical locations or
capacity extensions. For those domains, different
ChangingConceptsinHuman-Computer-InteractioninReal-timeEnterpriseSystems-IntroducingaConceptforIntuitive
DecisionSupportinSCMScenarios
143

simulative derived variations can be compared very
rapidly and with ease. The approach of increasing a
result area in resolution and its further exploration is
therefore widely applicable.
6 FUTURE WORK
Although the described concept is still in a prototyp-
ical status, its potential benefits are already obvious.
In further research and development, considerations
on appropriate touch-sensitive hardware as well as
user studies are planned. Especially the paradigm of
Drill-Down with the help of multi-touch gestures on
a tabletop system will be subjected to research in the
future. Concerning the projection type for the 3D
Data Landscape, a comparison of the current per-
spective projection and an isometric perspective
seems to be reasonable. To support the comparabil-
ity of peaks even more, the isometric projection
might be more suitable. The upcoming user studies
will evaluate the introduced concept by a survey
with experienced users to state the major deficien-
cies. Due to the great demand for mobile solutions in
EIS in general, further research will also have an eye
on possible scenarios on mobile devices. With their
numerous built-in sensors, new interaction meta-
phors are imaginable. One example might be the use
of G-sensor abilities for suitable Drill-Down or re-
finement interactions.
ACKNOWLEDGEMENTS
Christian Lambeck would like to
thank the European Union and the
Free State of Saxony, Germany for
supporting this work. Special thanks
are due to Thomas Lambeck and
Frank Förster for their enthusiastic
participation.
REFERENCES
Buchholz, S., 2010. Future manufacturing approaches
in the chemical and pharmaceutical industry. Chemical
Engineering and Processing: Process Intensification,
49(10), pp.993–995.
Carr, J. C. et al., 2001. Reconstruction and representation
of 3D objects with radial basis functions. In Proceed-
ings of the 28th annual conference on Computer
graphics and interactive techniques. SIGGRAPH ’01.
New York, NY, USA: ACM, pp. 67–76. Available at:
http://doi.acm.org/10.1145/383259.383266.
DLR, 2010. Mind Map APS - Project Fact Sheet.
Available at: http://www.pt-it.pt-dlr.de/_media/ Infob-
latt_MindMap_APS.pdf [Accessed December 12,
2011].
Elizandro, D., 2008. Simulation of industrial systems :
discrete event simulation using Excel VBA, New York:
Auerbach Publications.
Gissrau, M. & Rose, O., 2011. A DETAILED MODEL
FOR A HIGH-MIX LOW-VOLUME ASIC FAB. In
Proceedings of the 2011 Winter Simulation Confer-
ence. Winter Simulation Conference 2011. Arizona,
pp. 1953–1963.
ISA, 2012. ISA | The International Society of Automa-
tion. Available at: http://www.isa.org/ [Accessed Feb-
ruary 14, 2012].
Karnouskos, S. et al., 2010. Real-world Service Interac-
tion with Enterprise Systems in Dynamic Manufactur-
ing Environments. In Artificial intelligence techniques
for networked manufacturing enterprises management.
London; Heidelberg: Springer.
Kohonen, T., 2001. Self-organizing maps, Berlin; New
York: Springer.
Kortuem, G. et al., 2010. Smart objects as building
blocks for the Internet of things. IEEE Internet Com-
puting, 14, pp.44–51.
Lima, M., 2012. visualcomplexity.com | A visual explo-
ration on mapping complex networks. Available at:
http://www.visualcomplexity.com/vc/ [Accessed Feb-
ruary 10, 2012].
Ollinger, L., Schlick, J. & Hodek, S., 2011. Leveraging
the Agility of Manufacturing Chains by Combining
Process-Oriented Production Planning and Service-
Oriented Manufacturing. In Proceedings of the 18th
IFAC World Congress. World Congress of the Inter-
national Federation of Automatic Control (IFAC-
2011), August 28 - September 2, Milan, Italy. Elsevier
Science Ltd.
Plattner, H. & Zeier, A., 2011. Desirability , Feasibility,
Viability – The Impact of In-Memory, Berlin ; Heidel-
berg ; New York : Springer.
SAP AG, 2012. SAP Design Guild - R/3 History in
Screen Shots. Available at: http://www.
sapdesignguild.org/resources/r3_history.asp [Accessed
December 2, 2011].
Stadtler, H. & Kilger, C., 2008. Supply chain manage-
ment and advanced planning concepts, models, soft-
ware, and case studies, Berlin : Springer,.
Topi, H., Lucas, W. T. & Babaian, T., 2005. Identifying
Usability Issues with an ERP Implementation. In
Pro-
ceedings of the International Conference on Enter-
prise Information Systems (ICEIS). ICEIS’05. pp.
128–133.
ICEIS2012-14thInternationalConferenceonEnterpriseInformationSystems
144
