
Fluidity Measuring Device for the Concrete using Laser Diode
Controller via WSN
Bo Hee Lee
Department of Electrical Engineering, Semyung University, Jecheon, South Korea
Keywords: Measurement of Concrete Fluidity, Wireless Sensor Network (WSN), Laser Sensors, Driving Mechanism.
Abstract: Presented is a high performance device for the measurement of concrete fluidity using Wireless Sensor
Network (WSN). This device is an improvement over the existing method of manual measurement which is
subject to significant human-induced error. Using this device we can make measurements automatically and
analyze the information simultaneously for the concrete fluidity. In this paper we present a novel device
utilizing laser sensors and wireless data acquisition including driving mechanism. The effectiveness of the
device is verified through experiment.
1 INTRODUCTION
Fluidity Concrete, a special category of concrete, is
becoming increasingly common in the construction
of high-rise buildings and bridges (Choi, 2008).
Quality control of Fluidity Concrete requires the
reliable measurement of the dynamic characteristics
of the concrete. Because measurement of concrete
fluidity is an important aspect in ensuring concrete
quality control, standard measurement techniques
have been proposed, such as 2004 KS F 2594 (a
slump flow of fresh concrete test method) in South
Korea. However, the conventional method of
measurement using a slump cone, stopwatch and
tape measure is subjective to the experimenter's
judgment and may suffer unnecessary variation.
Therefore, a more precise and repeatable method of
measurement is required. Recent research in the
field includes the use of a camera and computer
measurement system. This process has proven to be
accurate. However it suffers from considerable
equipment cost, difficulty in field implementation,
and susceptibility to environmental conditions.
Furthermore, the testing apparatus must be hard-
wired to a computer, limiting the portability of the
device. Therefore, to effectively operate in the field,
a device must be tolerant to dust, humidity and
variable light conditions. Additionally, remote
sensing will allow the device to be implemented
wherever it is most convenient in the construction
site. To surmount these challenges, we have applied
a wireless sensor network to gather information from
a laser based sensor network. The remote device
includes an embedded controller, allowing the
collection of data without a PC. Wireless sensor
networks are best implemented in environments in
which communication infrastructure has not been
well-developed and the amount of data to transmit is
small. In the field, each node of the network
transmits data through the network to a PC where it
may be utilized. Therefore, the state of the
environment can be measured remotely without
established telecommunication infrastructure.
Application of wireless sensor networks include
global environment monitoring (Mosalam, 2002),
habitat monitoring (Mainwa., 2002), traffic planning
Shekhar, 2002), medical surveillance (Virone, 2006),
intelligent clothing (Lee, 2006), etc.
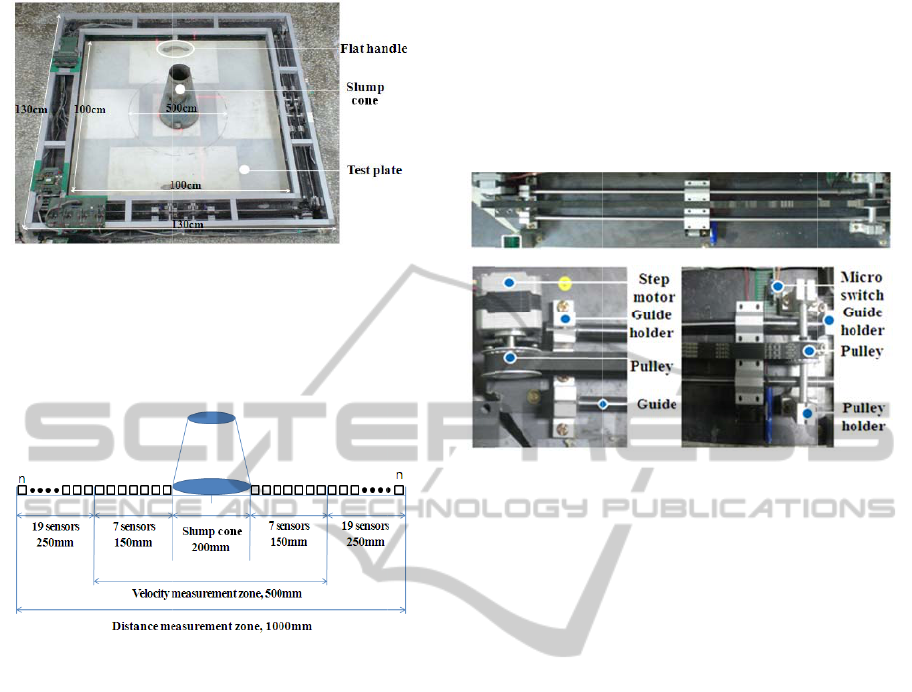
2 MECHANICAL STRUCTURE
The proposed device is used to measure the concrete
flow and thereby calculate the fluidity. It is designed
for mobility in the field and repeatability of results.
The total structure is divided into two functional
blocks; a test plate for containing the actual concrete
and the supporting measurement electronics. A
diagram of the basic mechanical layout is presented
in Fig. 1. The total device has a length and width
130 of cm and a height of 10 cm. The test plate is a
100 cm square plate of acrylic.
570
Hee Lee B..
Fluidity Measuring Device for the Concrete using Laser Diode Controller via WSN.
DOI: 10.5220/0003986105700573
In Proceedings of the 9th International Conference on Informatics in Control, Automation and Robotics (ICINCO-2012), pages 570-573
ISBN: 978-989-8565-21-1
Copyright
c
2012 SCITEPRESS (Science and Technology Publications, Lda.)
F
A slum
p
placed i
n
evenly i
n
symmet
r
F
After
slump,
i
concrete
concrete
and D)
u
diodes.
T
specific
a
measure
500 m
m
mm apa
r
to 1000
diamete
r
fluidity
o
total co
n
and (2).
A
=
T
The lase
laser di
o
bed. T
h
allowin
g
ensures
detector
F
igure 1: Prop
o
p
cone used
n
the middle
o
n
four directi
r
ical.
F
igure 2: Conc
e
the slump
c
it
is lifted o
f
to spread
a
is measured
i
u
tilizing a tot
a
T
o remain c
o
a
tion, 7 sens
o
the time re
q
m
. An additio
n
r
t, measure t
h
0
mm. From
r
, the embe
d
o
f the concre
t
n
crete spread
=
interval * p
T
otal = A side
r diode mod
u
o
de used to s
w
h
e laser diod
e
g
the pitch of
the diode re
m
on the opp
o
o
sed measurem
e
to deliver th
e
o
f plate. To s
p
ons, each sid
e
e
ptual figure of
c
one is filled
f
f the test pl
a
cross the pl
a
i
n four direct
i
a
l 26 laser sen
s
o
mpliant wit
h
o
rs, each spa
c
q
uired for th
e
n
al 19 sensor
s
h
e final sprea
d
the spread
d
ded comput
e
t
e. Using the
is obtained u
s
osition + vel
o
width + B si
d
u
le consists o
f
w
eep half the
e
is attached
t
the diode to
b
m
ains oriente
d
o
site side of
t
e
nt system.
e
test materi
a
p
read the con
c
e
of the devi
c
measuring.
with a con
c
a
te, allowing
a
te. Flow o
f
i
ons (side A,
B
s
ors and two
l
h
the KS F
2
c
ed 21 mm a
p
e
spread to r
e
s
, each space
d
d
of the slum
p
rate and sp
e
r calculates
laser sensors
,
s
ing equation
s
o
city zone
d
e width
f
a single mo
v
length of the
t
o a servo m
o
b
e adjusted.
T
d
correctly t
o
t
he test bed.
a
l is
c
rete
c
e is
c
rete
g
the
f
the
B
, C
l
aser
2
594
p
ar
t
,
e
ach
d
13
p
, up
p
read
the
, the
s
(1)
(1)
(2)
v
able
e
test
o
tor,
This
o
the
The
ser
v
an
d
len
g
tw
o
sid
e
the
the
At
mi
c
Th
e
las
e
li
m
the
3
An
the
div
i
p
ro
mo
t
32-
p
ro
inc
l
(A
D
co
m
of
c
so
use
spr
e
wh
i
mo
t
dat
a
spr
e
re
m
wi
r
ne
e
lik
e
v
o motor is
t
d
guide mech
a
g
th of the tes
t
o
laser asse
m
e
of the test
b
embedded p
r
laser diode a
s
Fig
u
both sides
o
c
ro-switch us
e
switch also
e
r diode fro
m
its. Feedbac
k
positioning o
CONTR
electrical co
laser meas
u
i
ded into th
r
cessing unit
t
or drive uni
t
b
it Jennic
cessor is lo
a
l
udes four 1
2
D
Cs), 21 g
e
m
parators and
c
ontrol softw
a
t
here is no
n
r program. I
n
e
ad, we bre
a
i
ch are instal
l
t
or respectiv
e
a
, calculates
t
e
ad extent a
n
m
ote coordin
a
e. It means t
h
e
d to measur
e
e
constructio
n
t
hen connect
e
a
nism allowin
g
t
be
d
, as sho
w
b
lies are use
b
ed. A stepp
e
r
ocessor, act
u
s
sembly.
u
re 3: Laser poi
n
o
f the transl
a
e
d for realig
n
s
erves as an
i
m
exceeding
k
from the di
o
f
the laser.
O
LLER
D
n
troller was
d
u
rement syst
e
r
ee function
(CPU), sens
t
. The central
JN5139
m
a
ded with t
h
2
-Bit analog
e
neral purpo
s
additional e
m
a
re is integrat
e
n
eed to instal
l
n
order to m
e
k
the contro
l
l
ed with a la
s
ly. The CP
U
h
e velocity o
f
n
d transmits
a
to
r
to the h
is method is
v
e
something
a
n
field beca
u
e
d to a linea
r
g
it to transla
t
w
n in Fig. 3.
T
e
d to monito
r
e
r motor, con
t
u
ates the mo
v
n
ter drive
r
.
a
tion mecha
n
g
nment of th
e
i
nhibitor to p
r
maximum t
r
o
de is used
t
D
ESIGN
designed for
em
. The co
n
modules; t
h
s
or interface
processing
u
m
icro
p
rocess
o
h
e Zigbee s
t
to digital
c
s
e I/O port
s
m
bedded circ
u
ed on CPU
w
l
another int
e
easure the v
e
l
unit into f
o
s
er diode an
d
U
aggregates t
f
the concret
e
the data
t
h
r
h
ost compute
r
v
ery effective
at messy en
v
u
se of using
r
bushing
t
e half the
T
herefore,
r
a single
t
rolled by
v
ement of
n
ism is a
e
syste
m
.
r
event the
r
anslation
t
o control
use with
n
troller is
e central
uni
t
and
u
nit has a
or
. This
t
ac
k
, and
c
onverters
s
, timers,
u
itry. All
w
ith stack,
e
rface for
e
locity of
o
ur parts,
d
stepping
h
e sensor
e
from the
r
ough the
r
without
when we
v
ironment
wireless
FluidityMeasuringDevicefortheConcreteusingLaserDiodeControllerviaWSN
571
communication. The laser detector arrays are
connected to a single decoder (HEF4514) for
velocity measurement and two decoders for distance
measurement. The output of the decoder is then
connected to the CPU where it is aggregated using
the internal ADC. Each of the four stepper motors is
independently controlled, thereby allowing
independent measurement of the four sides of the
slump spread. The wireless network responsible for
connecting the client PC to the testing device is
implemented using the ZigBee protocol that is
embedded on the Jennic JN5139 processor. If
distances between the testing device and host
become too great to directly communicated, a router
may be used to extend the range. The client
software is responsible for providing a user interface.
Software on the test device is responsible for
network construction, command execution and
control of the measurement process.
The test device software first initializes the ZigBee
network. It then waits for a command from the client
PC. Once received, the software will move the laser
diodes to the starting point and begin checking for
concrete. If concrete is detected (i.e., the laser beam is
broken), a timer is started and the laser diode
assembly is moved to the next sensing location. Once
the flow reaches 500 mm, the timer is recorded.
Measurement of the flow continues until the flow has
stopped, at which point the total spread distance is
measured. This process is implemented in parallel for
all four laser diode assemblies. From the velocity and
distance measurements, the fluidity of the concrete is
calculated and transmitted to the client PC.
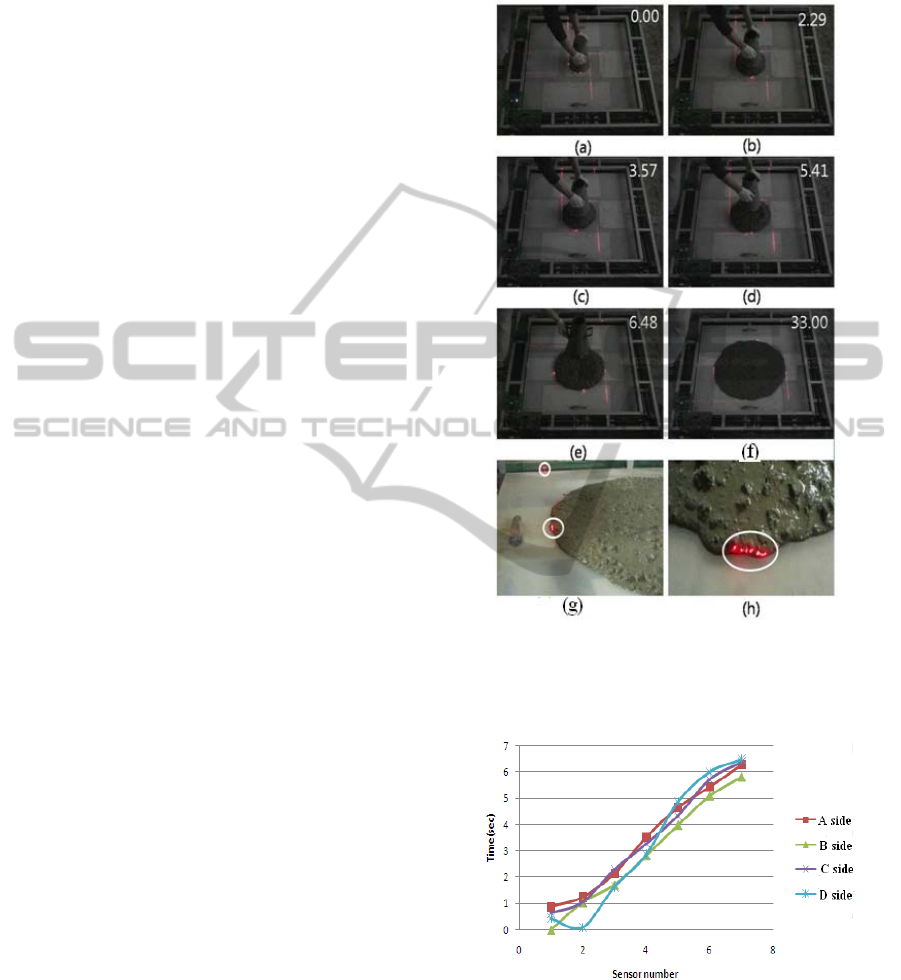
4 RESULT
An experiment was performed to determine the
fluidity of concrete using the new method, as
depicted in Fig. 4.
As Fig. 4 illustrates, the lasers are able to measure
the movement of the slump in four directions. Once
the flow has stopped, which means viscosity of
concrete is lost, the user can command all data to be
transferred to the client PC to examine the
characteristic of concrete. In the Fig. 5 shows the
500mm spreading times for concrete with respect to
4 directions. Seen on the graph, the spread of 4
directions are not completely radial because of
difference of uniformity for a concrete. We have
also designed graphic user interface to show the
measured data using Labview 8.6 in Fig. 6. All of
measured data is displayed on user console to check
the properties like transit time, velocity, and distance.
From the sample data, the spread distance for each
side can be calculated using equation (1) to
330,306,306 and 322mm.
Figure 4: (a) shows the initial placement of the slump cone.
(b)-(d) shows the spread of the concrete with detection
occurring on four sides. (e)-(h) demonstrates the lasers
ability to track the edge of the concrete spread.
Figure 5: 500mm spreading times for concrete.
The equations assume a spread of at least 500 mm,
and utilize the spacing in between the 19 distance
sensors. Experimental results indicate the spread is
asymmetric each of the four directions and the
spread length and width can be calculated using
equations (3-4), respectively.
ICINCO2012-9thInternationalConferenceonInformaticsinControl,AutomationandRobotics
572
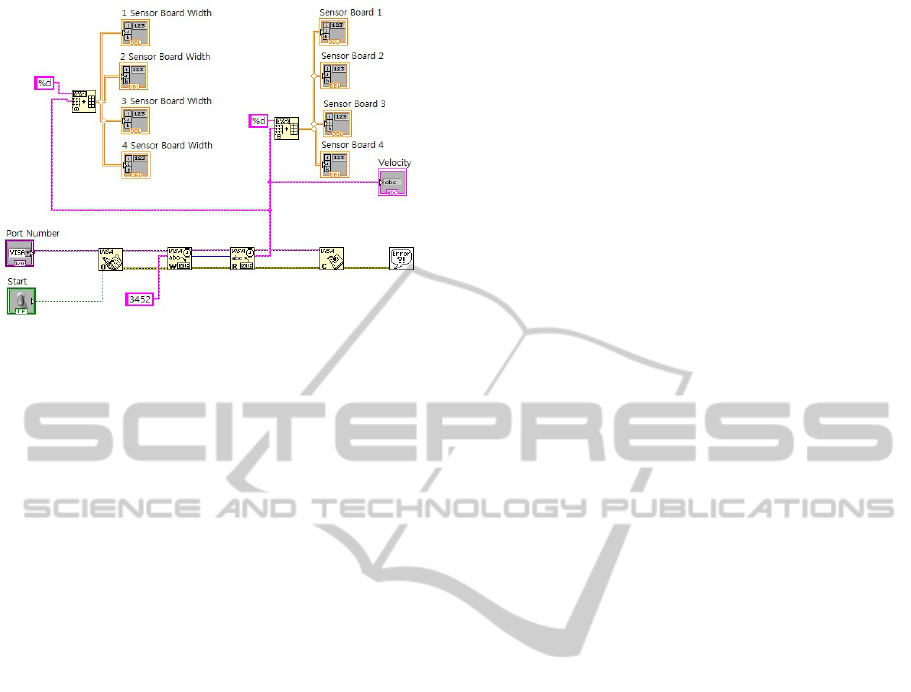
Figure 6: Client-side user interface.
Additionally, the time to reach 500mm was
identified as 6.480 seconds. This conforms to
regulation KS F 2594, as suggested.
Length = (330mm)+(306mm)=636mm (3)
Width = (306mm)+(322mm)=628mm (4)
The setup for the experiment was in an indoor
environment, with the client PC within 10 meters of
the test device. Therefore, the ZigBee wireless
network was able to deliver the requirement
bandwidth without problem. In the event of
increased client to test device distances, routers can
be inserted into the network to relay the data. So we
can transmit the measured data to office in long
distance away. Therefore we can apply this device
even if it is needed long distance measure.
5 CONCLUSIONS
In this paper, an automatic concrete fluidity
measurement system using a wireless sensor
network is presented. The performance of the
proposed device was compared with the
conventional fluidity measurement technique, as
described in the KS F 2594 specification. To reduce
measurement variability, the proposed device
utilizes an automatic laser scanning mechanism with
a computer controlled timer. From the resultant data,
concrete fluidity can be more reliably calculated.
Furthermore, the measurement data can be logged,
for future statistical analysis. While vision systems
possess the fidelity required for concrete fluidity
measurement, they lack the robustness required for
field use. The proposed system takes advantage of a
wireless sensor network coupled with a robust laser
sensing system for use in a potentially dusty and
humid environment. Future research on the proposed
device includes the implementation of smaller laser
detectors to improve detection accuracy, and the
development of a graphical user interface for
improved user ergonomics. Additionally, a
consistent method for slump cone removal will
allow for uniform initial conditions.
REFERENCES
Y. Choi, Y. Kim, H. Kang, 2008, The Study of Fludity
Property of Ultra Fludity Concrete for Precast Bridge
Material, Journal of Korea Concrete Institute, No 28,
pp 155~163.
Mosalam, K. M., Machado, C., Gliniorz, K. U., Naito, C.,
Kunkel, E., and Mahin, S, 2002, Seismic evaluation of
asymmetric three-story wood-frame building, CUREE
Publication No.W-19.
Shekhar, S., Lu.C. T, Liu.R, Zhou.C, 2002, A system for
traffic data visualization, intelligent transportation
systems, Proceeding.
G. Virone, A. Wood, L. Selavo, Q. Cao, L. Fang, T. Doan,
Z. He, R. Stoleru, S. Lin, and J. A. Stankovic, 2006, an
Advanced Wireless Sensor Network for Health
Monitoring, Transdisciplinary Conference on
Distributed Diagnosis and Home Healthcare (D2H2),
Arlington, VA.
B. H. Lee, K. T. Seo, J. S. Kong, and J. G. Kim, 2006,
Design of the configurable clothes using mobile
actuator-sensor network, Springer-Verlag. LNCS 3983,
288-295.
FluidityMeasuringDevicefortheConcreteusingLaserDiodeControllerviaWSN
573
