Use of Flow Control on Car Dumpers
A Case of Success at Vale
Bruno Eduardo Lopes and Luis Freitas Coutinho
Vale, Departamento de Inovação e Desenvolvimento, Av. Dos Portugueses, S/N, Itaqui, 65085-580, MA, Brazil
Keywords: Car Dumper, Flow Control.
Abstract: The flow control of the car dumper (VV, in Portuguese) used to be done in open loop, i.e., operators used to
manually adjust the speed of the feeders (AL, in Portuguese) to make the actual flow equal to the desired
flow. The problem was that these manual adjustments were not always performed properly and the result
was a loss in productivity and the occurrence of overflow on the feeders. This work demonstrates the
techniques of control, modelling and identification used for the implementation of flow control in closed
loop in the car dumpers at the Ponta da Madeira Maritime Terminal, Vale.
1 INTRODUCTION
The car dumper (VV) is a structure that turns the
wagon at around 160
o
(max 180
o
) on its horizontal
axis. While turning the wagon is locked in its
position by an anchoring system. During the turn,
the iron ore falls into a system called feeder and is
directed to a conveyor belt leading to the material
storage yard or directly to the ship. The use of car
dumpers brings great agility to the process of
unloading wagons in comparison to other methods
used today.
Vale’s unload area at the TMPM (Maritime
Terminal of Ponta da Madeira) is currently
composed of four car dumpers, with a nominal
production capacity of 8,000 ton/h, being able to
unload two wagons simultaneously.
The car dumper installed at the TMPM has the
following systems which operate in an integrated
manner:
Turner
Car Pusher
Winch of the Car Pusher
2 Hoppers
2 Feeders
Reversible Movable Conveyor Belt
Subsystems (hydraulic units, lubrication units,
hydraulic locks, etc.).
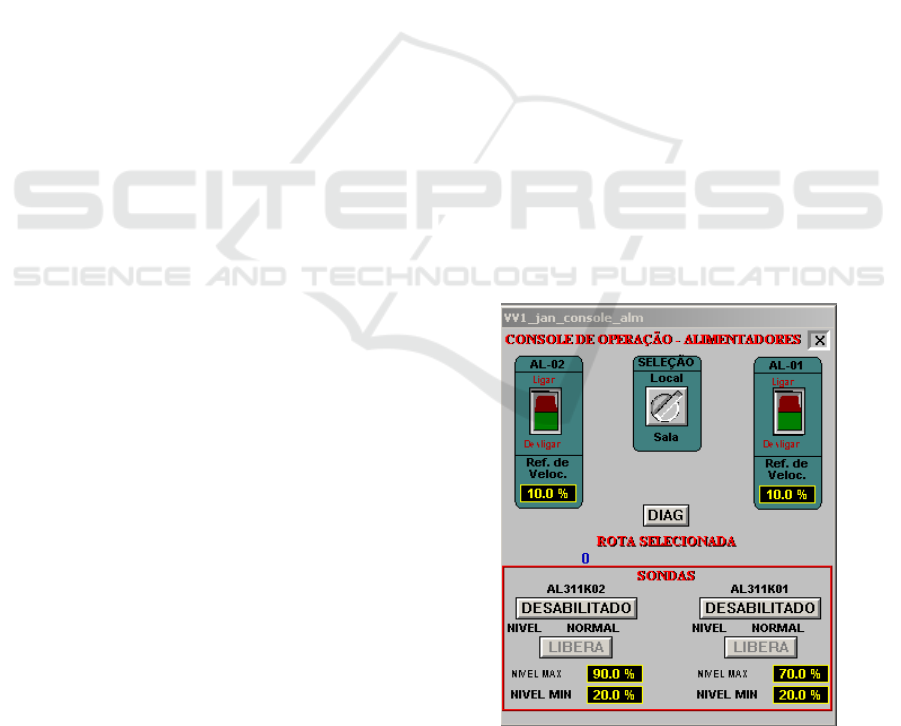
Previously, the flow control of the car dumpers at
TMPM was done in open loop, i.e., to control the
flow the operators had to manually adjust the speed
of the feeder, as shown in Figure 1, until the actual
flow reached the desired value.
Figure 1: Manual adjustment of the feeders speed at
VV01.
However, in order to maintain the levels of the
hoppers under each car dumper close to each other,
the operator had to increase or decrease the
difference in speed between the feeders, and then try
to find a new speed relationship to make the actual
flow equal to the desired setting. The problem was
that these manual adjustments were not always
performed properly, and the end result was a loss in
productivity or the occurrence of overflow at the
580
Eduardo Lopes B. and Freitas Coutinho L..
Use of Flow Control on Car Dumpers - A Case of Success at Vale.
DOI: 10.5220/0003990505800584
In Proceedings of the 9th International Conference on Informatics in Control, Automation and Robotics (ICINCO-2012), pages 580-584
ISBN: 978-989-8565-21-1
Copyright
c
2012 SCITEPRESS (Science and Technology Publications, Lda.)
feeders.
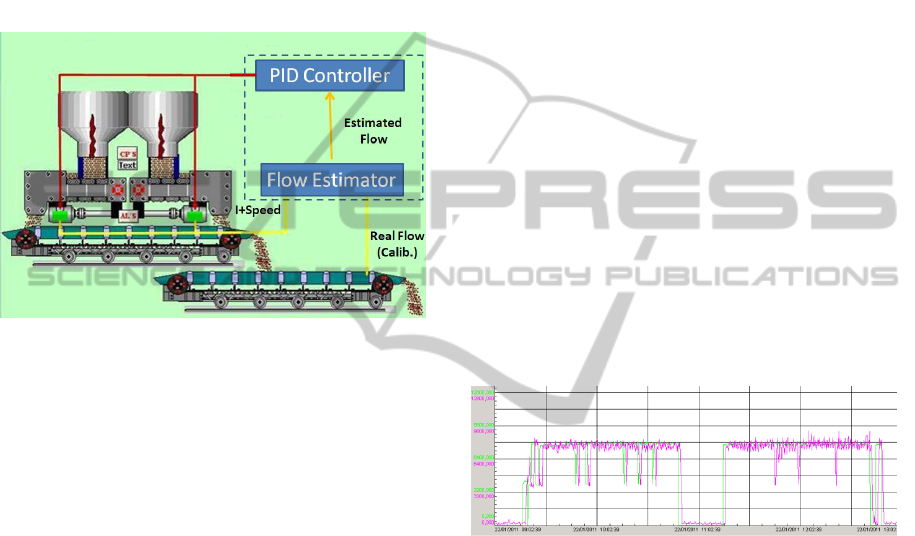
Basically, the flow control implemented in the
car dumpers is a closed loop control, where the
process variable is the estimated flow of the material
at the output of the feeders and the control variables
are the rotational speeds of these feeders. The
estimated flow of material is calculated from the
velocities and currents of the feeders and corrected
with the readings of the existing physical flow scale
at another point in the discharge line. The logic
diagram of the flow control is shown in Figure 2.
Figure 2: Logical diagram of the flow control.
This article demonstrates the theories used to carry
out the implementation of this flow controller and
the results obtained with this implementation.
2 FLOW ESTIMATOR
2.1 Mathematical Modelling
Due to the distance between the car dumper and the
flow scale located at the discharge line, and its
consequent time delay, which would hinder the
implementation of a flow control, it was necessary to
develop a mathematical model that would represent
the flow at the discharge line (estimated flow).
Using the estimated flow as the process variable
(PV) eliminates the effects of the time delay, also
known as dead time (Smith, 1957; Astrom et. Al,
1994; Hagglund, 1992; Astrom et. Al, 1995),
allowing the implementation of the flow control
logic.
For the development of the estimated flow it was
first necessary to perform the data acquisition of the
actual flow (through the flow scale in the discharge
line), current and speed of the feeders. After the
acquisition of the data, a mathematical model
relating the data acquired was created in order to
obtain the estimated flow. In order to
mathematically represent the estimated flow, the
ARX linear model (Aguirre, 2007), was used
together with the Extended Least Squares Method
(Aguirre, 2000) to estimate the parameters. To
determine the order of the model we used the
Method of Analysis of Eigenvalues for linear models
(Lopes et al., 2010).
The mathematical model for the car dumper 01
(VV01), obtained using the least squares estimator is
shown below.
y (t) = (-3.445 * u1 (t)) + (80.31 * v1 (t)) -
(0.5513 * u2 (t)) + (89.11 * v2 (t))
(1)
Where: y= Estimated flow, u1= Current of the
motor powering feeder 01, v1 = speed of the feeder
01, u2 = Current of the motor powering feeder 02
and v2= Speed of the feeder 02.
The model was implemented in a PLC
(Programmable logic controller) controlling the car
dumper VV01 and Figure 3 shows, through actual
data extracted from the PIMS (Process Information
Management System), a comparison between the
estimated flow (Green) and the real flow (Pink). The
analysis of the graphic shows that the estimated flow
is a good representation of the actual flow.
Figure 3: Comparison between estimated and actual flow.
2.2 Reinforcement Learning
To ensure that the estimated flow is corrected over
time, a new technique of reinforcement learning was
implemented. This technique consists of comparing
the results of the estimated flow with the actual flow
to create a correction factor. This correction factor is
then applied to the estimated flow. The
reinforcement learning logic was implemented in the
car dumpers supervisory system.
As shown in Figure 4, each car dumper may
operate on four of the discharge lines and a
discharge line may be used by more than one car
dumper.
The reinforcement learning technique was based
on the following information:
Knowledge of the discharge line being used by
the car dumper;
Use of Flow Control on Car Dumpers - A Case of Success at Vale
581
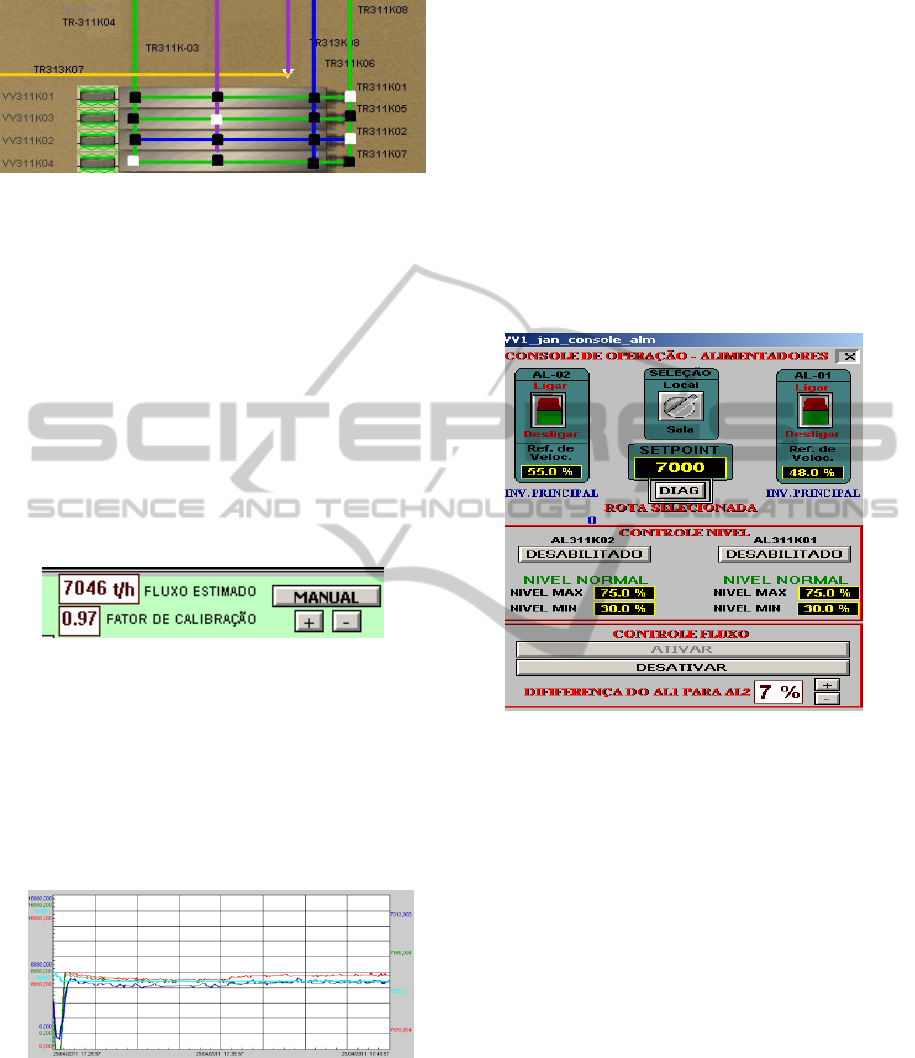
Figure 4: Car dumpers (VV) and their discharge lines.
Whether there is another car dumper using the
same discharge line. If so, the flow control
should be disabled;
Knowledge of the time delay between the car
dumper and the flow scale at the selected
discharge line.
In order to allow the operator to verify the
estimated flow, the information shown in Figure 5
was made available. The operator may, through the
supervisory system, check the value of the estimated
flow, the value of the calibration factor obtained by
the technique of reinforcement learning and may
also enable/disable the calibration of the estimated
flow.
Figure 5: Information for monitoring the estimated flow.
Figure 6 shows the performance of reinforcement
learning technique. It is possible to verify that there
is an error between the estimated flow (red) and
actual flow (blue) shown by the flow scale. The
moment was activated estimated flow calibration
(using reinforcement learning technique) estimated
corrected flow (Green) is now correctly represent the
actual flow.
Figure 6: Comparison of the actual flow in ton/h (Blue) X
Estimated Flow (Red) X estimated corrected flow (Green).
3 FLOW CONTROL
The flow control needs the operator to inform the
desired flow (SP – Set Point) and a PID controller
adjusts the speed of the feeders (CV - Controlled
Variable) to make the estimated flow equal to the
corrected desired flow.
In addition to informing the desired flow the
operator can adjust through the supervisory system
the speed difference between the feeders. The goal is
to make the level of the hoppers always close to
each other. If the operator activates the level control,
this difference in speed is calculated automatically
by the control system.
Figure 7 shows the screen that was developed in
the supervisory system for adjusting the set point,
the speed difference between the feeders and to
enable or disable the flow control.
Figure 7: Screen to adjust the set point and speed
difference between feeders.
Both the mathematical model used to estimate the
flow and the PID controller used to control the flow
were implemented on the PLC responsible for
controlling the car dumpers.
3.1 Flow Control Integrated with Level
Control
The car dumper has a hopper that collects the load of
the cars being turned. The hoppers on each side must
have a level transmitter that checks the material that
is unloaded from each wagon.
This system monitors the level of ore in the
hoppers, as shown in Figure 8. The level is measured
during the intervals when the wagons are not being
turned. In order for the level measurement to work,
the following logic must be implemented in the
PLC:
Low level in the hopper: Disable flow control
and reduced speed of feeders;
ICINCO 2012 - 9th International Conference on Informatics in Control, Automation and Robotics
582
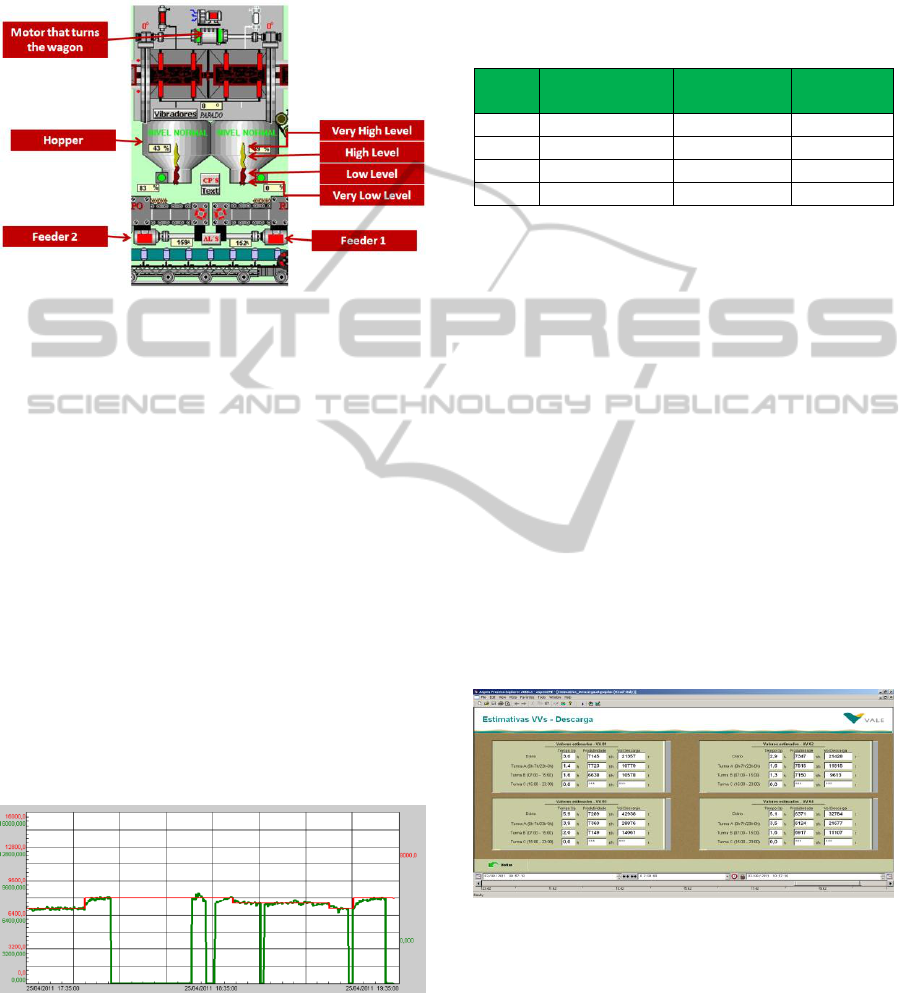
Very low level of hopper: Disable flow control
and shutdown of feeders shoe;
Very high level in the hopper: Keep active flow
control and turners blocked for discharge.
Figure 8: Monitors the level of ore in the hoppers.
Using a level transmitter it was possible to
implement a cascade control between the levels of
the hoppers and the discharge flow. The goal is to
control the speed difference between the feeders in
order to maintain the level between the hoppers
always close to each another, keeping the output
flow at the desired value.
4 RESULTS
4.1 Flow Control
The performance achieved with the implementation
of the flow control can be seen in Figure 10, where
the operator provides different values of set point
(Red) and the controller automatically adjusts the
speed of the feeders to make the estimated corrected
flow (Green) equal to the established set point.
Figure 9: Flow Control Performance.
As can be seen in Figure 9 the flow control
performed well, because every change made to the
set point was rapidly followed by a correct change to
the speed making the flow equal to the estimated set
point.
The main gain with the implementation of flow
control was to reduce the standard deviation and
variability of the average rate (in ton/h) of the
discharge flow. This result is shown in Table 1.
Table 1: Gains obtained with the Flow Control.
Month
Average Rate
(ton/h)
DP Within
(ton/h)
Cpk
April
7698
312
0.21
May
7866
192
0.64
June
7859
170
0.70
July
7894
154
0.85
Using the table we can see that after the
implementation of the Flow Control a 51% reduction
in standard deviation (DP Within) rate and a 303%
reduction in variability (Cpk). With this solution we
have a controller that automatically adjusts the speed
of the feeders to follow the desired flow, thus
eliminating the need for operator intervention. As a
result, a 2.5% increase in the average rate of sinter
feed, which is equivalent to over 8 hours of
operation per month.
Using the estimated flow variable, it was
possible to develop a solution for tracking the
productivity of the car dumpers online. With the
development of this solution was possible to
increase the level of information in the discharge
process, because only then it was possible to obtain
some information online, such as productivity,
volume turned and run time for each day of
operation of the car dumpers. Figure 10 shows this
information being monitored through PIMS.
Figure 10: Screen created for monitoring the estimated
variables.
We conducted a comparison between the estimated
values and data extracted from SGOP (System
developed by Vale to Management of Port
Operations) for car dumper 1 (VV01) during the
month of May 2011 and the result can be seen in
Figure 11. This figure shows that the percentage of
accuracy of the estimated data is close to 100%.
Use of Flow Control on Car Dumpers - A Case of Success at Vale
583

Horas Operadas PIMS vs OEE
0,0
4,0
8,0
12,0
16,0
01/05/2011
08/05/2011
15/05/2011
22/05/2011
29/05/2011
HOP - OEE HOP - PIMS
Toneladas PIMS vs OEE
0
40.000
80.000
120.000
01/05/2011
08/05/2011
15/05/2011
22/05/2011
29/05/2011
VOL - OEE VOL - PIMS
Produtividade PIMS vs OEE
5.000
6.000
7.000
8.000
9.000
01/05/2011
08/05/2011
15/05/2011
22/05/2011
29/05/2011
PRO - OEE PRO - PIMS
94,0%
97,2%
96,7%
Run Time
vs
Horas Operadas Estimadas PIMS
Volume Turned
Productivity
Produtividade Estimadas PIMS
Figure 11: Comparison between data extracted from
SGOP and the estimated values.
It is worth emphasizing that the biggest
difference in the comparisons between the PIMS and
SGOP is in the amount of hours of operation. The
amount of hours informed by operator is always
lower than that calculated by the PIMS. This shows
a possible problem with the appropriation of hours
informed by the operator.
5 CONCLUSIONS
The results presented in this paper showed that the
new standard adopted by Vale to control the
discharge flow of iron ore at the TMPM car dumpers
brought a significant reduction in variability and
standard deviation with a significant increase in
productivity. The reductions were the main gain of
the project, because the constancy of the flow is
healthy for the equipment, as well as for the entire
process route.
Because of the gains obtained with this new flow
control standard developed at the TMPM terminal it
was established as the standard to be used by other
ports of Vale.
REFERENCES
Aguirre, L. A., 2000. A nonlinear dynamical approach to
system identification, IEEE Circuits & Systems
Society Newsletter 11(2): 10-23, 47.
Aguirre, L. A., 2007. Introdução a Identificação de
Sistemas. Técnicas Lineares e Não Lineares Aplicadas
a Sistemas Reais. Editora UFMG, Belo Horizonte -
MG. Brasil, 3a edição.
Lopes, B. E, Corrêa, M. V., Teixeira, R. A. and Moura, J.
P., 2010. Método de Análise dos Autovalores para
seleção de ordem de modelos lineares. Anais do 18º
Congresso Brasileiro de Automática, Bonito MS, pp.
498 — 504
Astrom, K., Hang C., Lim, B., 1994. A New Smith
Predictor for Controlling a Process with a Integrator
and Long Dead Time. IEEE Transaction on Automatic
Control 39(2): 343-345
Hagglund, T., 1992. A Predictive PI Controller for
Processis with Long Dead Time. IEEE, Control
Systems, pp57-60.
Smith, O. J. M., 1957. Closed Control of Loops With
Dead-Time, Chem. Eng. Progress; 53:217-219.
Astrom, K. J., Hagglund T., PID Controllers: Theory,
Design, and Tunning. 2ª Edition, Instrument Society of
America, 1995.
ICINCO 2012 - 9th International Conference on Informatics in Control, Automation and Robotics
584
