
Application of an Artificial Immune System to Predict Electrical Energy
Fraud and Theft
Mauricio Volkweis Astiazara and Dante Augusto Couto Barone
Programa de P´os-Graduac¸˜ao em Computac¸˜ao, Universidade Federal do Rio Grande do Sul, Porto Alegre, Brazil
Keywords:
Artificial Immune Systems, Classifier, Pattern Recognition, Fraud Detection.
Abstract:
This paper describes the application of an Artificial Immune System (AIS) to a real world problem: how to
predict electricity fraud and theft. The field of Artificial Immune Systems is a recent branch of Computa-
tional Intelligence and has several possible applications, like pattern recognition, fault and anomaly detection,
data analysis, agent-based systems and others. Although its potential, AIS still is not applied as much other
techniques such as Artificial Neural Nets are. Various works compare AIS with other techniques using toy
problems. But how much efficient is AIS when applied to a real world problem? How to model and adapt
AIS to a specific domain problem? And how would be its efficiency compared to traditional algorithms? On
the other hand, many companies perform activities that can be improved by Computational Intelligence, like
predicting fraud. Electrical energy fraud and theft cause large financial loss to energy companies and indirectly
to the whole society. This work applies AIS to predict electrical energy fraud and theft, analyzes efficiency
and compares against other classifier methods. Data sample used to training and validation was provided by
an electrical energy company. The results obtained showed that AIS has the best performance.
1 INTRODUCTION
The electrical energy distribution business faces a se-
rious problem: some consumers try illegally to de-
crease their bills. This goal is achieved through fraud
and theft. Fraud consists in handling energy company
equipments aiming to decrease consumption registra-
tion. Theft is to make an unauthorized connection to
the electrical energy system. In some countries, elec-
trical energy fraud and theft cause annual losses of
billions of U.S. dollars (Smith, 2004; ANEEL, 2008).
Theft and fraud directly affect energy companies, but
indirectly affect also honest consumers. The tamper-
ing of energy company equipments can result in poor
quality energy supply to the neighbors of dishonest
consumers. Also, energy taxes are increased having
theft and fraud as the explanation.
To stop a fraud or theft from a dishonest consumer,
energy company must perform an in locus inspection.
As generally energy companies have few inspection
teams, in locus inspection should be conducted in
consumers more likely to be dishonest. Trying to hit
dishonest consumers, energy companies use different
strategies: receive anonymous tip offs about fraud and
theft, make studies about consumers data and, just a
few companies, apply datamining and pattern recog-
nition techniques (Dick, 1995; Queiroga and Varej˜ao,
2005; Monedero et al., 2006). In Brazil, CEEE-D is
an energy company that still does not apply datamin-
ing and pattern recognition techniques to classify con-
sumers as likely dishonest.
Artificial Immune System (AIS) is a relatively
new branch of Computational Intelligence (CI) and
is still in its infancy (Aisweb, 2009). Even though it
has a wide potential application area, the algorithms
and techniques of this field are not as widespread
as those of Artificial Neural Nets and Genetic Algo-
rithms. AIS can be used for pattern recognition. This
work models and applies an AIS to classify CEEE-
D consumers as likely dishonest aiming to analyze its
efficiency. The results from AIS are compared against
other well-known classification techniques.
The following sections introduce Artificial Im-
mune Systems and discuss its application to a prob-
lem of an electricity company, including goals, data
set, algorithm, experimental results, conclusions, and
bibliographic references.
265
Volkweis Astiazara M. and Augusto Couto Barone D..
Application of an Artificial Immune System to Predict Electrical Energy Fraud and Theft.
DOI: 10.5220/0003993902650271
In Proceedings of the 14th International Conference on Enterprise Information Systems (ICEIS-2012), pages 265-271
ISBN: 978-989-8565-10-5
Copyright
c
2012 SCITEPRESS (Science and Technology Publications, Lda.)
2 ARTIFICIAL IMMUNE
SYSTEMS
The natural immune system has several properties
that are interesting from a computational point of
view (De Castro and Timmis, 2002), including pat-
tern recognition, diversity, autonomy, anomaly detec-
tion, noise tolerance, resilience, learning, and mem-
ory, amongst others. Such features have inspired the
development of new computational models and algo-
rithms. AIS emerged in the 1990s as a new branch
of CI (Dasgupta, 2006; Dasgupta and NI
˜
NO, 2008).
AIS are adaptive systems, inspired by theoretical im-
munology and observed immune functions, princi-
ples, and models, that can be applied to problem solv-
ing (De Castro and Timmis, 2002).
The scope of applications of AIS include, but are
not restricted to: pattern recognition (Alexandrino
et al., 2009), fault and anomaly detection (Kessentini
et al., 2010), data analysis (data mining, classification
etc.) (Nasir et al., 2009; Kodaz et al., 2009), agent-
based systems (Hilaire et al., 2008), scheduling (Yu,
2008), machine learning, autonomous navigation and
control (Zhang et al., 2009), search and optimization
methods (Rodionov et al., 2011), artificial life, and
security of information systems (Yu, 2011).
3 ELECTRICAL ENERGY FRAUD
AND THEFT
Fraud and theft cause financial loss to energy compa-
nies in the whole World. Energy companies legally
increase energy rates to compensate this kind of loss,
referred to by the companies as Non-Technical Losses
(NTL). In USA, estimated theft costs are between
0.5% and 3.5% of annual gross revenues (Smith,
2004). In developing countries, NTL are serious con-
cerns for utility companies as they are about 10 to
40% of their total generation capacity (Depuru et al.,
2011). In Brazil, annual NTL losses are over US$ 2
billion (ANEEL, 2008).
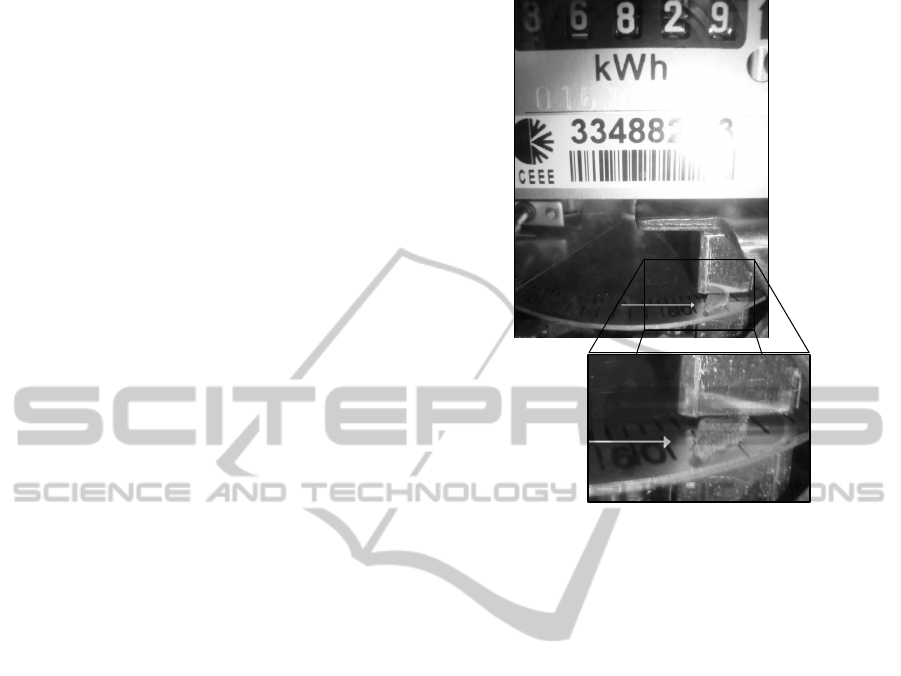
Basically, there are 3 situations that result in
losses (Dick, 1995; Smith, 2004; Depuru et al., 2010):
1. A consumer who tampers with the meter so that
it under-registers consumption; this is fraud. Fig-
ure 1 shows a tampered meter which is a kind of
fraud.
2. A consumer who does not tamper with the meter,
but instead creates another connection bypassing
the meter. The consumer uses this illegal con-
nection for some devices (usually devices that are
large power consumers); this is theft.
Figure 1: Picture of a tampered meter. There is a stone in
the disc.
3. A non-registered consumer who makes an illegal
connection. This is also theft, but this case is be-
yond the scope of this study, because the energy
company does not have any information about
these transgressors in its database.
To detect dishonest consumers, energy companies
analyze consumer data and receive anonymous tip
offs about dishonest consumers. Based on this in-
formation, they can determine whether a consumer is
suspect. To confirm fraud or theft, an in locus inspec-
tion must be conducted. It is not, however, feasible
for an energy company to inspect every consumer as
the few inspection teams. Ideally in locus inspections
should be conducted in consumers more likely to be
dishonest, which can be ascertained through discov-
ery of patterns in consumer data.
CEEE-D (Companhia Estadual de Distribuic¸˜ao de
Energia El´etrica) is an energy company in southern
Brazil. CEEE-D provides electricity to 72 cities and
has 1,470,000 consumers (CEEE, 2011). CEEE-D is
a partner in this study and provided a data set of in-
spected consumers to be used in the training and tests.
ICEIS2012-14thInternationalConferenceonEnterpriseInformationSystems
266

Table 1: Confusion matrix.
Predicted
Positive
Predicted
Negative
Actual Posi-
tive
True Positive
(TP)
False Nega-
tive (FN)
Actual Nega-
tive
False Positive
(FP)
True Negative
(TN)
4 GOALS AND METRICS
As described previously, the goal of this work is to an-
alyze the effectiveness of the AIS paradigm applied to
a real world problem. From this goal, three questions
can be derived:
• Question 1: Can an AIS application learn to pre-
dict dishonest electricity consumers?
• Question 2: How efficient is AIS applied to this
problem?
• Question 3: How efficient is AIS when compared
to other methods?
To answer these questions, it is necessary to define
metrics and how to interpret them. Thus, some con-
cepts and metrics used in classification tasks are in-
troduced. True Positive (TP) is the number of cor-
rectly labeled cases that belong to the positive class.
In this work the positive class consists of dishonest
consumers. True Negative (TN) is the number of cor-
rectly labeled cases that belong to the negative class
(honest consumers). False Positive (FP) is the number
of items incorrectly labeled as belonging to the posi-
tive class. Finally, False Negative (FN) is the number
of items incorrectly labeled as belonging to the nega-
tive class. The four values (TP, TN, FP, and FN) con-
stitute cells of the so-called Confusion Matrix. This
matrix is created by crossing predicted values with
real values. The confusion matrix is the basic output
of any classifier validation as shown in Table 1.
The sum of TP and FN is the actual number of
items in the positive class, whereas the sum of TN
and FP is the actual number of items in the negative
class. The sum of TP, TN, FP, and FN is the total num-
ber of items. From these basic values it is possible to
calculate certain metrics, which are described below.
Precision is defined as
Precision =
TP
TP+ FP
, (1)
which means the probability of an item classified
as belonging to the positive class actually to belong to
the positive class.
Returning to the questions, Question 1 talks about
learning. A classifier that does not learn is a random
classifier. The precision of a random classifier is equal
to the probability of the positive class, defined as
Random Precision =
number of positive class
total number of items
. (2)
Thus, a classifier can learn if it has precision
greater than that of a random classifier. Formally, this
advantage of a classifier over a random classifier is
called the Gain in Precision and is defined as
Gain in Precision =
Classifier Precision
Random Precision
. (3)
A classifier with a Gain in Precision of 1 is no bet-
ter than a random classifier. The larger the gain, the
better is the classifier under consideration. Thus, the
answer to Question 1 is “yes” if the Gain in Precision
of the AIS is greater than 1, else it is “no”.
In Question 2, it is necessary to interpret “effi-
cient” in a business context. For the energy company,
discovering dishonest consumers and stopping their
fraud or theft is important because these consumers
are sources of financial loss. At the same time, it is
necessary an in locus inspection to confirm the fraud
or theft and normally the company’s inspection teams
are very small. Inspecting an honest consumer is a
waste of time and money. Ideally, in locus inspections
should only be conducted in consumers more likely to
be dishonest. Thus, Precision, which is defined in (1),
is an important metric.
Another important metric is Recall (or Sensitiv-
ity), which is defined as
Recall =
TP
TP + FN
, (4)
and can be interpreted as the probability that an
item of the positive class is correctly classified. Recall
is an important metric too, because in a hypothetical
scenario where all consumers classified as dishonest
are inspected, 100% minus Recall of actual dishonest
consumers remains with no inspection. This opinion
that Precision and Recall are the most important met-
rics for this type of business is shared in (Queiroga
and Varej˜ao, 2005).
Since both metrics are important, it is necessary
to use a metric that represents a balance of precision
and recall. This metric is called the F-measure, and
is the harmonic mean of precision and recall. The F-
measure is defined as
F-measure = 2·
Precision· Recall
Precision+ Recall
. (5)
ApplicationofanArtificialImmuneSystemtoPredictElectricalEnergyFraudandTheft
267
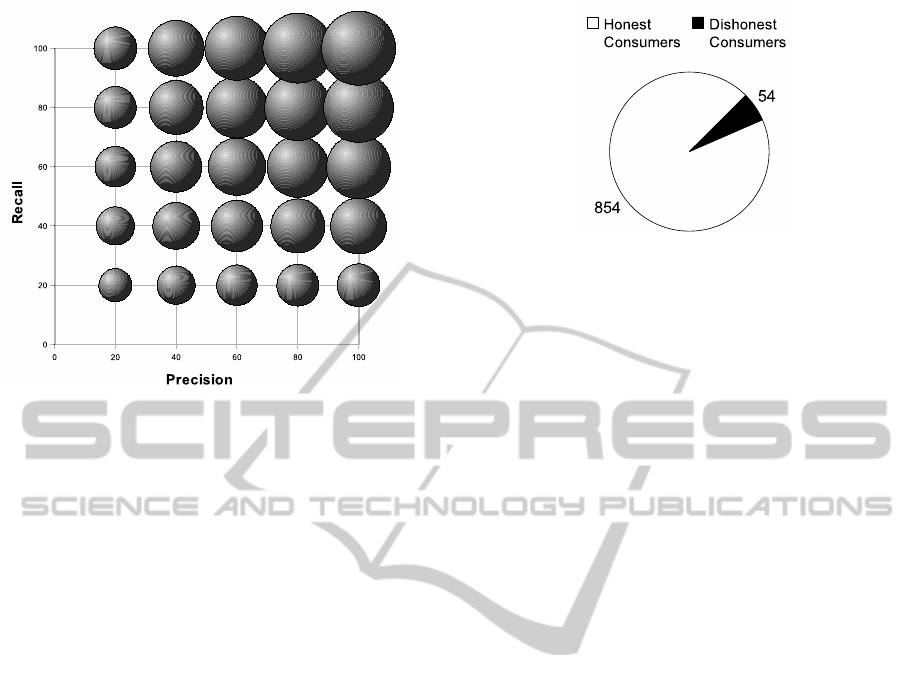
Figure 2: Representation of F-measure in bubbles.
Figure 2 illustrates F-measure as bubbles, preci-
sion as X axis and precision as Y axis. Bubbles
grow as precision and recall grow. In this way, the
F-measure helps to answer Question 2.
To answer Question 3, comparison of Precision,
Recall, and the F-measure of an AIS with other clas-
sifier algorithms applied to the same data samples is
made.
To calculate the defined metrics Leave One Out
Cross Validation (Kohavi, 1995) was used. This kind
of validation consists of removing one instance from
the data sample to form part of the test data. The re-
maining instances are used as training data. The clas-
sifier is trained and tested. Then, the instances used
to test are returned to the data sample and the next in-
stance is used as test data, and so on until all instances
have been used as test data. Leave One Out allows
maximum utilization of all data, making the valida-
tion process less sensitive to data variations. How-
ever, this kind of validation has a high computational
cost.
5 DATA SET
CEEE-D provided a data set with inspected con-
sumers from a specific city that CEEE-D believes has
a high rate of dishonest consumers. The original data
set contains 4141 instances, but this includes redun-
dant instances. After removal of redundant instances,
1249 remain. Of these instances, 440 belong to the
positive class (dishonest consumers) and 854 belong
to the negative class (honest consumers). In this sce-
nario, 34% of consumers are dishonest. According to
the energy company, real proportion of dishonest con-
Figure 3: Proportion of dishonest consumers.
sumers ranges between 4 and 8%. Aiming to create a
data set close to reality, the number of instances be-
longing to positive class was reduced to 54. It results
in 5.95% proportion of dishonest consumers, a value
close to the average of 4 and 8%. This proportion is
shown in Figure 3.
Each instance has 19 attributes involving categor-
ical and numeric data types. These attributes were
selected by an expert from the energy company based
on his empirical knowledge. Attributes about energy
consumption were normalized.
6 ALGORITHM
From all the algorithms based in Clonal Selection
Theory (Burnet, 1959), for this analysis the Clonalg
algorithm (De Castro and Timmis, 2002) was cho-
sen because of its available documentation (Aisweb,
2009) and ease of implementation. Clonalg includes
the following steps:
1. Initialization: create an initial random popula-
tion of individuals (P).
2. Antigenic Presentation: for each antigen, do:
(a) Affinity Evaluation: present it to the popula-
tion P and determine its affinity with each ele-
ment of the population P.
(b) Clonal Selection and Expansion: select n1
highest affinity elements of P and generate
clones of these individuals proportionally to
their affinity with the antigen: the higher the
affinity, the higher the number of copies.
(c) Affinity Maturation: mutate all these copies
with a rate inversely proportional to their affin-
ity: the higher the affinity, the smaller the mu-
tation rate. Add these mutated individuals to
the population P and reselect the best individ-
ual to be kept as the memory m of the antigen
presented.
ICEIS2012-14thInternationalConferenceonEnterpriseInformationSystems
268

(d) Metadynamics: replace a number n2 of indi-
viduals with low affinity by the randomly gen-
erated new ones.
3. Cycle: repeat Step 2 until a certain termination
criterion is met.
In this work, antigens are data consumers and an-
tibodies are data structures similar to data consumers.
The antibody structure has 19 attributes, one for each
consumer attribute. A hybrid representation of data
was adopted keeping the original data types (categor-
ical and real values) of each attribute.
To measure the affinity between antibodies and
antigens a similarity measure based on distance is
used. The smaller the distance, the higher is the simi-
larity, and thus, the higher is the affinity. The distance
between each antigen attribute and antibody attribute
is calculated. The sum of all the distances is normal-
ized by the total number of attributes, generating a
value between 0 and 1. So, the value is inverted to
become an affinity value. The affinity measure is de-
fined as
Affinity = 1−
∑
L
i=1
D(Ag
i
, Ab
i
)
L
, (6)
where
• Ag is the array of attributes of the antigen;
• Ab is the array of attributes of the antibody;
• L is the length of the array of attributes, in this
case, 19;
• D is a function to measure distance between at-
tributes, which depends on the data type of the
attribute. The resulting value is in the range 0 and
1.
Function D depends on the data type of the at-
tribute. For categorical attributes the Hamming dis-
tance is applied, where the result is 0 if the two values
are equal, else 1. For real value attributes the follow-
ing formula was applied:
D =
|Ag
i
− Ab
i
|
Max− Min
, (7)
where
• Ag is the array of attributes of the antigen;
• Ab is the array of attributes of the antibody;
• Max is the maximum that attribute i can assume;
and
• Min is the minimum that attribute i can assume.
The size of the initial population P was set as 4%
of the sample size. For parameters n1 and n2 a value
of 20% of the population P was used. The termination
Table 2: Summarized data.
Metric Mean Standard
Deviation
Confidence
Interval
(level
95%)
Precision 13.97% 0.0066 [13.84%,
14.10%]
Recall 71.93% 0.0340 [71.26%,
72.59%]
F-measure 23.39% 0.0109 [23.18%,
23.61%]
criterion is that the individuals retained as memory
cells reach an affinity of 0.8 or more.
This algorithm is used to generate two classifiers:
one for honest consumers and the other for dishonest
consumers. The classification of a new consumer is
made by submitting it to both classifiers, and consid-
ering the one with the higher affinity as the label. A
prototype for this AIS model was implemented in the
Java programming language.
It was used the Waikato Environment for Knowl-
edge Analysis (WEKA) software (Hall et al., 2009) to
provide the other algorithms for comparison. WEKA
is a workbench of machine learning that includes sev-
eral algorithms. The version used was 3.6.3. All algo-
rithms were used with default parameter values pro-
vided by WEKA except for KNN that was tested us-
ing three values for K (1, 3, and 10).
7 EXPERIMENTAL RESULTS
Precision, recall, and F-measure of 100 Leave One
Out Cross Validation was calculated. Measured val-
ues have a normal distribution, so arithmetic mean
was used as average. Standard deviation and confi-
dence intervals were calculated too as shown in Ta-
ble 2.
To answer the questions listed earlier, the mean
of the Precision, Recall and F-measure was used. In
Question 1, “Can an AIS learn to predict dishonest
electricity consumers?”, it is necessary to calculate
the random precision and gain in precision defined in
(2) and (3), respectively:
Random Precision =
54
908
= 0.0595 = 5.95%,
Gain in Precision =
0.1397
0.0595
= 2.3478.
The Gain in Precision of the AIS, 2.3478, is
greater than 1, so the answer to Question 1 is yes,
ApplicationofanArtificialImmuneSystemtoPredictElectricalEnergyFraudandTheft
269
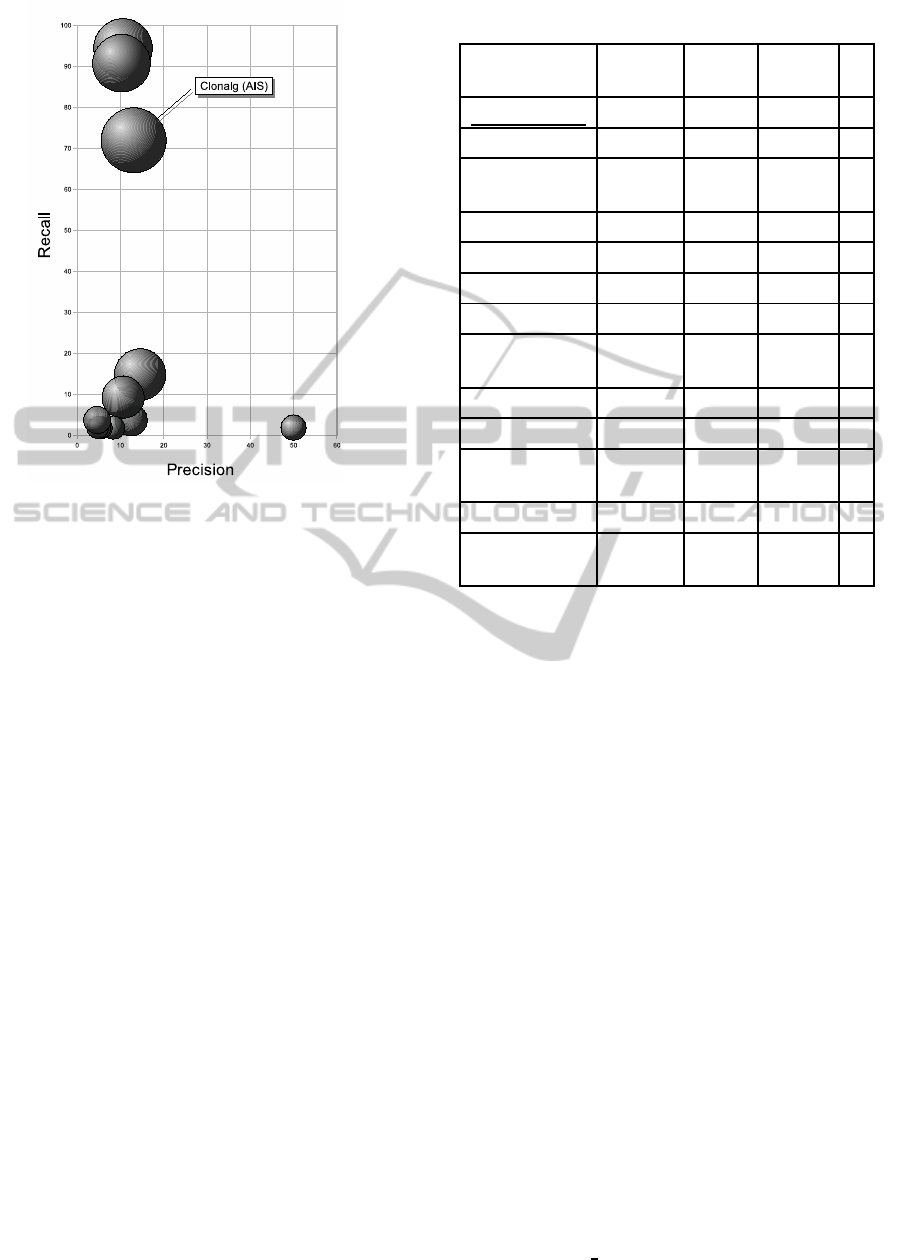
Figure 4: Comparison of results. F-measure in bubbles.
the AIS can learn to predict dishonest electricity con-
sumers.
Question 2 is “How efficient is AIS applied to this
problem?” and the answer is a consequence of the
Precision, Recall and F-measure metrics; in this case,
Precision = 13.07%, Recall = 71.93%, and F-measure
= 23.39%.
To answer Question 3, “How efficient is AIS when
compared to other methods?”, Leave One Out Cross
Validation was performed running several algorithms
from WEKA. Table 3 shows the results ordered by
F-measure. Only the top 13 algorithms are shown.
Figure 4 visually summarizes the resulting data.
In terms of precision, the AIS, represented by the
Clonalg algorithm, is 3rd. From obtained data can be
observed that, in general, algorithms with a high pre-
cision have a low recall. In results ordered by recall,
Clonalg is in third place too. Considering the balance
of precision and recall through the F-measure, Clon-
alg is in first place. It can be concluded that, from an
F-measure perspective,Clonalg achievesgood perfor-
mance.
8 CONCLUSIONS
This work described how an AIS algorithm called
Clonalg was applied to a real world problem: pre-
dicting electricity consumers who are sources of non-
technical losses (fraud or theft) based on patterns in
the data available in the energy company database. A
Table 3: Comparison of results ordered by F-measure.
Algorithm Precision Recall F-
measure
#
Clonalg (AIS) 13.07% 71.93% 23.39% 1
Naive Bayes 10.60% 94.44% 19.07% 2
Voting feature
intervals
10.25% 90.74% 18.42% 3
KNN (K=1) 14.55% 14.81% 14.68% 4
RandomTree 10.64% 9.26% 9.90% 5
RandomForest 12.50% 3.70% 5.71% 6
NNGE 4.65% 3.70% 4.12% 7
Fast decision
tree learner
50.00% 1.85% 3.57% 8
K* 8.33% 1.85% 3.03% 9
FT Tree 5.56% 1.85% 2.78% 10
Artificial
Neural Net
5.56% 1.85% 2.78% 10
KNN (K=3) 5.26% 1.85% 2.74% 11
PART deci-
sion list
4.76% 1.85% 2.67% 12
model of antibody and antigen was shown. A distance
measure was used as affinity measure. In this work
was used metrics to analyze the algorithms that make
sense in the electrical energy business context, differ-
ent from other works that use accuracy as single met-
ric in a simplistic way as (Brun et al., 2009; Depuru
et al., 2011). Results show that the modeled AIS
can learn the concept of dishonest consumers and has
the best efficiency in terms of the F-measure. Thus,
the AIS should be considered a potential candidate to
solve pattern recognition tasks. Furthermore, it seems
that there is a relation between precision and recall,
where high precision is associated with low recall.
REFERENCES
Aisweb (2009). Basic immune inspired algo-
rithms. <http://www.artificial-immune-
systems.org/algorithms.shtml>. The Online Home of
Artificial Immune Systems.
Alexandrino, J., Cavalcanti, G., and Filho, E. (2009). Hy-
brid intelligent system clonart applied to face recogni-
tion. In Neural Networks, 2009. IJCNN 2009. Inter-
national Joint Conference on, pages 102 –107.
ANEEL (2008). Nota t´ecnica 342/2008-
sre/aneel. <http://www.aneel.gov.br/cedoc/
nren2008338
342.pdf>. Agˆencia Nacional de
ICEIS2012-14thInternationalConferenceonEnterpriseInformationSystems
270

Energia El´etrica, Superintendˆencia de Regulac¸˜ao
Econˆomica.
Brun, A., Pinto, J., Pinto, A., Sauer, L., and Colman, E.
(2009). Fraud Detection in Electric Energy Using Dif-
ferential Evolution. In Intelligent System Applications
to Power Systems, 2009. ISAP ’09. 15th International
Conference on, pages 1 –5.
Burnet, M. (1959). The clonal selection theory of acquired
immunity. The Abraham Flexner Lectures. Cambridge
University Press.
CEEE (2011). A ceee distribuic¸˜ao.
<http://www.ceee.com.br/pportal/ceee/ Compo-
nent/Controller.aspx?CC=1755>. Companhia
Estadual de Distribuic¸˜ao de Energia El´etrica.
Dasgupta, D. (2006). Advances in artificial immune sys-
tems. Computational Intelligence Magazine, IEEE,
1(4):40 –49.
Dasgupta, D. and NI
˜
NO, L. F. (2008). Immunological
Computation: Theory and Applications. CRC Press,
Florida, US.
De Castro, L. N. and Timmis, J. (2002). Artificial Im-
mune Systems: A New Computational Intelligence Ap-
proach. Springer, London, UK.
Depuru, S., Wang, L., and Devabhaktuni, V. (2011). Sup-
port vector machine based data classification for de-
tection of electricity theft. In Power Systems Confer-
ence and Exposition (PSCE), 2011 IEEE/PES, pages
1 –8.
Depuru, S., Wang, L., Devabhaktuni, V., and Gudi, N.
(2010). Measures and setbacks for controlling elec-
tricity theft. In North American Power Symposium
(NAPS), 2010, pages 1 –8.
Dick, A. (1995). Theft of electricity-how uk electricity
companies detect and deter. In Security and Detec-
tion, 1995., European Convention on, pages 90 –95.
Hall, M., Frank, E., Holmes, G., Pfahringer, B., Reutemann,
P., and Witten, I. H. (2009). The WEKA data mining
software: an update. SIGKDD Explor. Newsl., 11:10–
18.
Hilaire, V., Koukam, A., and Rodriguez, S. (2008). An
adaptative agent architecture for holonic multi-agent
systems. ACM Trans. Auton. Adapt. Syst., 3:2:1–2:24.
Kessentini, M., Vaucher, S., and Sahraoui, H. (2010). De-
viance from perfection is a better criterion than close-
ness to evil when identifying risky code. In Pro-
ceedings of the IEEE/ACM international conference
on Automated software engineering, ASE ’10, pages
113–122, New York, NY, USA. ACM.
Kodaz, H., Babaoglu, I., and Iscan, H. (2009). Thyroid
disease diagnosis using artificial immune recognition
system (airs). In Proceedings of the 2nd Interna-
tional Conference on Interaction Sciences: Informa-
tion Technology, Culture and Human, ICIS ’09, pages
756–761, New York, NY, USA. ACM.
Kohavi, R. (1995). A study of cross-validation and boot-
strap for accuracy estimation and model selection. In
Proceedings of the 14th international joint confer-
ence on Artificial intelligence - Volume 2, pages 1137–
1143, San Francisco, CA, USA. Morgan Kaufmann
Publishers Inc.
Monedero, i., Biscarri, F., Le´on, C., Biscarri, J., and Mill´an,
R. (2006). MIDAS: Detection of Non-technical
Losses in Electrical Consumption Using Neural Net-
works and Statistical Techniques. In Gavrilova, M.,
Gervasi, O., Kumar, V., Tan, C., Taniar, D., Lagan`a,
A., Mun, Y., and Choo, H., editors, Computational
Science and Its Applications - ICCSA 2006, volume
3984 of Lecture Notes in Computer Science, pages
725–734. Springer Berlin / Heidelberg.
Nasir, A. N. M., Selamat, A., and Selamat, H. (2009). An
artificial immune system for recommending relevant
information through political weblog. In Proceed-
ings of the 11th International Conference on Infor-
mation Integration and Web-based Applications and
Services, iiWAS ’09, pages 420–424, New York, NY,
USA. ACM.
Queiroga, R. and Varej˜ao, F. (2005). AI and GIS together
on energy fraud detection. In North American Trans-
mission and Distribution Conference and Expo.
Rodionov, A. S., Choo, H., and Nechunaeva, K. A. (2011).
Framework for biologically inspired graph optimiza-
tion. In Proceedings of the 5th International Con-
ference on Ubiquitous Information Management and
Communication, ICUIMC ’11, pages 11:1–11:4, New
York, NY, USA. ACM.
Smith, T. B. (2004). Electricity theft: a comparative analy-
sis. Energy Policy, 32(18):2067 – 2076.
Yu, H. (2008). Optimizing task schedules using an artifi-
cial immune system approach. In Proceedings of the
10th annual conference on Genetic and evolutionary
computation, GECCO ’08, pages 151–158, New York,
NY, USA. ACM.
Yu, Y. (2011). Anomaly intrusion detection based upon an
artificial immunity model. In Proceedings of the 49th
Annual Southeast Regional Conference, ACM-SE ’11,
pages 121–125, New York, NY, USA. ACM.
Zhang, X.-f., Liu, J., and Ding, Y.-s. (2009). An immune co-
evolutionary algorithm based approach for optimiza-
tion control of gas turbine. In Proceedings of the first
ACM/SIGEVO Summit on Genetic and Evolutionary
Computation, GEC ’09, pages 751–756, New York,
NY, USA. ACM.
ApplicationofanArtificialImmuneSystemtoPredictElectricalEnergyFraudandTheft
271
