
Facilitating the Handling of Documents
through Tree-Map Visualization
Elis Hernandes
1
, Erika Hohn
2
, José Carlos Maldonado
2
and Sandra Fabbri
1
1
Software Engineering Research Lab (LaPES), Universidade Federal de São Carlos, São Carlos, Brazil
2
Institute of Mathematics and Computer Science (ICMC), Universidade de São Paulo, São Carlos, Brazil
Keywords: Tree-Map, Information Visualization Tool, Hyperlink Function, Data Analysis, Structured Reading, Visual
Analysis.
Abstract: Applying visualization to manipulate a large volume of data constitutes a current demand of professionals
and researchers. Visualization stimulates human perception and increases the understanding capacity. In
literature, there are many studies on the use of visualization in different areas, as well as tools that make its
use feasible. Aiming to facilitate user’s comprehension, the objective of this paper is to explore, in the tree-
map visualization, the combined use of the following functions: search, edit, data regrouping and hyperlink.
This proposal was derived from two real problems: 1) to standardize a great volume of educational
assessment questionnaires that could not be processed automatically; and 2) to analyze the dependencies
among the TMMi (Test Maturity Model Integration) process areas, having simultaneous access to the text of
all the ones related to a specific issue. The functions were implemented in the SeEd-Visual tool (Search and
Edition based on Visualization), and organized in a process that aims to enhance user’s comprehension
through a visual metaphor. The process and the tool were applied to the real problems and allowed their
solution. The use of visualization enabled the solution of the real problems since it would be hard if done
manually.
1 INTRODUCTION
Nowadays, visualization has been used for different
proposals as scientific data analysis, knowledge
discovery, data mining, etc. (Rübel et al., 2010) (Silva
et al., 2011). According to Card, Mackinlay and
Shneiderman (1999), visualization focuses on
mapping data into a visual form, aiming at supporting
human interaction usually through a tool for visual
sense making.
Burley (2010) emphasizes that information
visualization is a valuable tool for knowledge
integration activities. This fact has been increasing the
visualization application area which is driven by a
mix of practical needs and research interest.
In this paper, we show the use of visualization to
make easier the solution of two real problems. In both
cases, to solve the problem it was needed to handle a
large document. In one case the automatic handled of
the document was not possible and, in the other one,
the manual handle of a big document was infeasible.
Once identified that visualization could simplify
the problems solution, the development of SeEd-
Visual (Search and Edition based on Visualization)
tool was started. This tool uses tree-map visualization
combined with the following functions: search,
edition, data regrouping, and hyperlink navigation.
The use of these functions allows finding a specific
data highlighting it in the metaphor; modifying data
generating real-time regrouping in the metaphor; and
opening external documents associated with a specific
data found through the search function. The
intervention in the visualization associated to the
regroup and hyperlink functions facilitates the
comprehension and the analysis of large documents.
The rest of this paper is organized as follows: in
Section 2, some researches related to the work
presented here; in Section 3, it is explained how the
functions search, edit, regroup and hyperlink impact
the visualization process and also how the SeEd-
Visual tool works. Section 4 presents the two practical
needs that motivated the development of the SeEd-
Visual tool and how these problems were solved by
using this tool; and finally, Section 5 presents the
conclusions and further work.
98
Hernandes E., Hohn E., Maldonado J. and Fabbri S..
Facilitating the Handling of Documents through Tree-Map Visualization.
DOI: 10.5220/0004003300980104
In Proceedings of the 14th International Conference on Enterprise Information Systems (ICEIS-2012), pages 98-104
ISBN: 978-989-8565-11-2
Copyright
c
2012 SCITEPRESS (Science and Technology Publications, Lda.)

2 RELATED WORK
In literature, there are many researches that explore
the use of visualization to support the execution of
different tasks and to facilitate the resolution of
different problems. In this section, some researches
undertaken in the context of document handling and
of characterizing functions provided by visualization
tools are commented.
Deep Diffs (Shannon et al., 2010) is a tool that
allows the analysis of document evolution through the
view of all the older versions. Parts of the text that
have been changed over multiple successive versions
are highlighted by the tool, drawing attention to
passages that are new, potentially unpolished or
contentious. This tool can be applied in a post-hoc
way to any text document stored in a version control
system integrated into a wiki, a source-code revision
system or a content-management system (CMS).
Deep Diffs helps the writing and the editing processes
by assisting memory and encouraging the analysis of
collaboratively-authored documents, through a text
editor and viewed by the tool with application of
different colors.
Another tool is the ResultMaps (Clarkson et al.,
2009) that helps the analysis of digital library lists
which are organized through. tree-map visualization.
Once the user has applied a query, the result is
showed as a list of items, which are highlighted in the
tree-map visualization. From this point, in case the
user navigates on the result list, data on these items
are presented in the visualization. In this case, the
interaction between the user and the visualization
happens through brushing.
OpinionSeer (Wu, 2010) is a tool developed to
facilitate the analysis of customers’ opinion on a
product or service. These opinions have been
collected online, which encourages their post and
generates a large volume of data. Aiming at
facilitating the analysis, the tool provides a visual
presentation of these data through scatterplots and
radial visualization.
The family of tools called PEx – Projection
Explorer (Paulovich et al., 2007) has been applied to
analyze and to verify the relationship among many
documents, which makes this error prone task easier.
PEx is an example of tool that provides the analysis of
different types of textual documents. PEx-Image
(Eler, 2009) allows the analysis of an image set and
PEx-Web (Paulovich, 2008) allows the analysis of
data recovered by web searches. The three tools allow
the user to open the visualized documents (image,
PDF documents, text and web pages).
The TreeMap tool (HCIL, 2003) implements the
tree-map technique (Johnson, Shneiderman, 1991). To
promote an increasing knowledge on data, the Treemap
allows hierarchies, filters construction and color
exchange. However, even though the tool makes
different ways of modifying the visualization available,
it does not provide search and edit functions.
In summary, visualization tools have given
support to different tasks. There are tools that provide
different types of visualization and one of their most
common characteristics is an appropriated interaction
type. Although some of the tools deal with documents
– text, images and metadata –, none of them provides
functions like search and edit, as proposed in the tool
presented here.
3 VISUALIZATION PROCESS
Motivated by the real problem of analyzing and
standardizing a large volume of data, a visualization-
based process and a the SeEd-Visual tool, that
supports this process, have been defined. Other
versions of the tool are been used to help the
resolution of similar problems.
The first problem that triggered the definition of
the process and the initial version of the tool is:
The context: (i) a set of questionnaires that were
applied periodically, during twenty years; (ii) each
questionnaire was composed of about seventy
questions; (iii) each year a questionnaire was
applied, the writing of a question previously used
was not necessarily the same; besides, new
questions could be inserted and old questions could
be removed;
The problem: determining which questions were
applied in each year;
Background: (i) an automatic comparison could
not be applied since the writing of many questions
were different and; in addition, a typo could also
interfere; (ii) handling the questionnaires by hand
was not feasible; (iii) making a decision in case
syntactically different questions were semantically
equal implies human analysis; (iv) visualizing
simultaneously, all questions that could be
semantically equal, seemed the best option.
Thus, considering the foregoing explanation,
visualization seems to be an alternative to aid the
problem solution. As seeing all the questions
simultaneously would facilitate the analysis, the tree-
map technique (Johnson and Shneiderman, 1991) was
defined as the starting point. This algorithm uses one
hundred percent of the screen and the color and the
size of the boxes are appropriated for large volume of
data. Based on this decision, each box would
FacilitatingtheHandlingofDocumentsthroughTree-MapVisualization
99

represent a question and the box color would
represent the year when the question was applied. In
addition, identical questions would determine the
grouping of the boxes. The advantage of using
treemap instead of list, for example, is the possibility
of attributing different representations, like color and
size, to distinguish different data.
However, these decisions were not enough.
Aiming at solving the problem, it would be necessary
to identify questions that were semantically
equivalent – then, the need of the search function; and
to edit the writing of these questions, aiming at
concluding the analysis – then, the need of the edit
function. Once any edition is made and the semantic
equal questions are changed into syntactically equal
questions, this information immediately impacts the
visualization by regrouping the questions.
Therefore, the search and the edit functions
promote a real time change in the visualization, which
facilitates the handling of these data. According to
Kan et al (2010), it is important that the user interacts
with the visualization, since it makes the information
easily understood. In Figure 1 Card’s process (Card et
al., 1999) was adapted to represent our process.
As shown in Figure 1, the search function impacts
only the visual metaphor. In the SeEd-Visual tool, the
usage of this function corresponds to the definition of
a keyword, which highlights the questions that have
that keyword. On the other hand, the edit function
impacts the tabular data, which impact the result of
the tree-map algorithm application, which, by its turn,
generates a new visualization. In the SeEd-Visual, the
use of this function corresponds to the selection of a
question and to the edition of its writing.
After the definition of this process and the
implementation of the corresponding tool version, the
following problem was raised:
The context: the need of dealing with a large
document – the TMMi reference model. This
model is a guide for test process improvement
(TMMi Foundation, 2011).
The problem: identifying dependencies among the
practices.
Background: (i) as the available document of the
TMMi reference model is a PDF file, the search
function of PDF readers locates an occurrence of a
keyword at a time; (ii) handling the TMMi
document manually was not feasible; (iii) making
the decision on practices dependencies implies
human analysis.; (iv) seeing all the practices that
cover the same issue simultaneously seemed the
best option to identify dependencies.
By analyzing both problems, it is possible to observe
similarities between them. Again, the visualization
and the search function, as described here, could aid
to solve the problem. In this case, the edit function
was not necessary since the original document would
not be modified. However, accessing the whole text
of the TMMi was essential to decide on the
dependencies. Thus, the initial version was updated to
make the hyperlink function available. The
hierarchical structure of the PAs is represented by
nested boxes and all practices are represented on the
screen. The practice name is transformed into a
hyperlink, where the text of this practice is accessed.
As shown in Figure 1, the hyperlink function does
not impact the steps of the visualization-process. In
the SeEd-Visual, the use of this function corresponds
to clicking on the practice name and, then, the whole
text of this practice is open on the screen. The user
can open as many practices as needed.
The SeEd-Visual has been implemented in Java
by using the IDE NetBeans 6.7 (NetBeans, 2001).
The visual metaphor of the tool uses the Tree-map
technique (Johnson and Shneiderman, 1991) from the
Prefuse library (Prefuse, 2012).
It is important to observe that although there are
some tools that use the tree-map technique (Clarkson
et al., 2009); (Newsmap, 2010), none of them provide
the edit and the hyperlink functions as presented here.
These functions, although simple, have been
implemented in the SeEd-Visual since they are useful
to handle large volume of data or large documents. In
the next section, two case studies that exploring the
functions will be presented.
Figure 1: The process supported by the SeEd-Visual tool
(adapted from Card, Mackinlay, Shneiderman, 1998).
4 CASE STUDIES
In this section the problems that motivated the process
definition and the current version of the SeEd-Visual
tool are presented. The first problem – the one related
to the questionnaires – is presented as Case Study 1 and
the second – related to the TMMi – is presented as
Case Study 2.
ICEIS2012-14thInternationalConferenceonEnterpriseInformationSystems
100

4.1 Case Study 1: Questionnaires
Analysis
One of the basic instruments for the evaluation,
planning and support of the decision making on
public policy establishment is the production of agile
and accurate data. Therefore, the amount of data
should be large enough to allow this kind of analysis.
The Brazilian Institute INEP has recorded data for
twenty years now, aiming to characterize the
Brazilian educational sector. These data have been
collected through the national evaluation system,
which involves different types of evaluations,
generating a rich set of data – each evaluation is
composed of approximately eleven questionnaires
with about seventy questions each. In spite of the
amount of data, they are not standardized and are
distributed in different databases.
Mainly because some questions were written in a
different way, it was not possible to use an automatic
tool to identify when they presented the same
meaning. Therefore, this identification requires a
human decision. However, as the amount of data was
large, some computational support was necessary
since the task would be time consuming and error
prone if done just manually.
Hence, the visualization-based process was
defined and used to make this task easier. Certainly,
in case of having a visual scenario of the questions
status − groups of identical questions, questions that
were used only once, etc. – this information could
facilitate the questions analysis and standardization.
Aiming at facilitating the explanation of this case
study the data of SAEB (Basic Education Evaluation
System), which is the system evaluation for school
students (from 6 to 15 ages), were used. This
evaluation has been applied every two years and its
data corresponded to 66 questionnaires and 5.711
questions. The figures of this section represent a set of
questionnaires that correspond to the discipline
“Portuguese”.
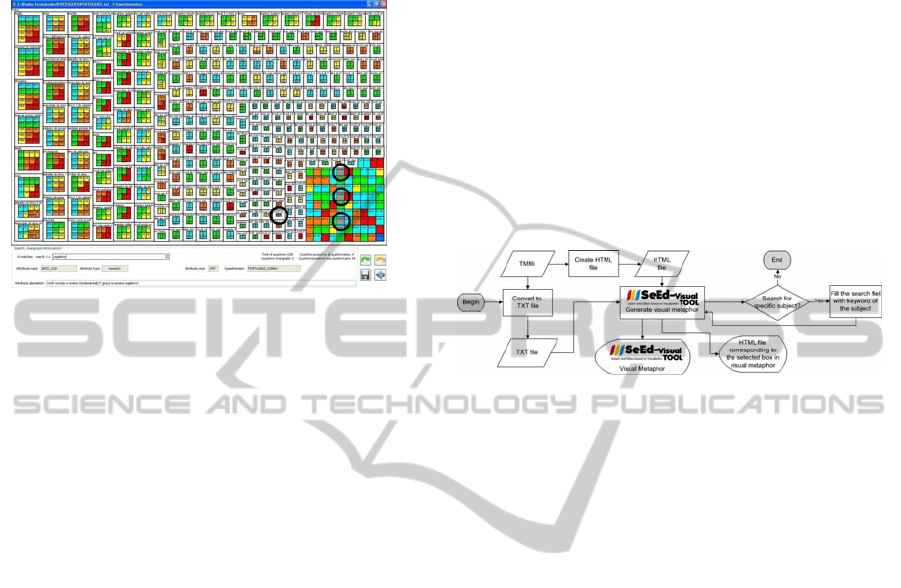
Figure 2 shows how the process of Figure 1 was
applied in this case study. In summary, the
questionnaires must be prepared generating a txt file,
which is uploaded into the SeEd-Visual tool. The tool
transforms the txt file into a visual metaphor, where
each question is represented by one box of the tree-
map visualization. After that, the questions are
processed iteratively through the search and the edit
functions. Every time a question is edited, the tool
reorganizes the questions (boxes) automatically by
providing a new visual metaphor. Below, each step of
the instantiated process of Figure 2 is detailed.
1) Prepare raw data to be uploaded into the SeEd-
Visual tool= join all questionnaires in a single txt
file.
2) Upload the .txt file into the SeEd-Visual tool=The
data are visualized as shown in Figure 3, where:
a) each box corresponds to a question;
b) each box is coloured according to the year when
the question was applied;
c) white boxes that group a set of colored boxes
correspond to a question that was applied by
using the same syntax (see the top left corner);
d) isolated boxes correspond to questions that were
not applied more than once (not with the same
syntax) (see the bottom right corner);
e) the information presented when clicking on a
box contains: the question, the database attribute
name, the attribute type, the year when the
question was applied and the questionnaire
name.
Figure 2: Flowchart of the visualization-based process of
the questionnaire analysis.
3) Standardize the data= if there is any non faded
box, the user should use the search function
aiming to analyze the highlighted questions and,
if necessary, edit them. The following actions
must be executed:
a) Click on a non faded box and identify a
keyword;
b) Type the keyword in the search field.
Immediately, all the boxes that contain such
keyword will become gray, as indicated by the
circles in Figure 3;
c) Analyze the questions of the gray boxes and
decide if they have the same meaning;
d) Standardize the text of these questions (using the
edit function), by choosing the most
appropriated syntax. The SeEd-Visual tool
regroups the questions (boxes), automatically,
and fades their colors to indicate that these
questions have been analyzed;
e) Repeat actions (c) and (d), until the syntax of all
gray boxes are analyzed;
f) Go back to action (a) until all the boxes are
faded.
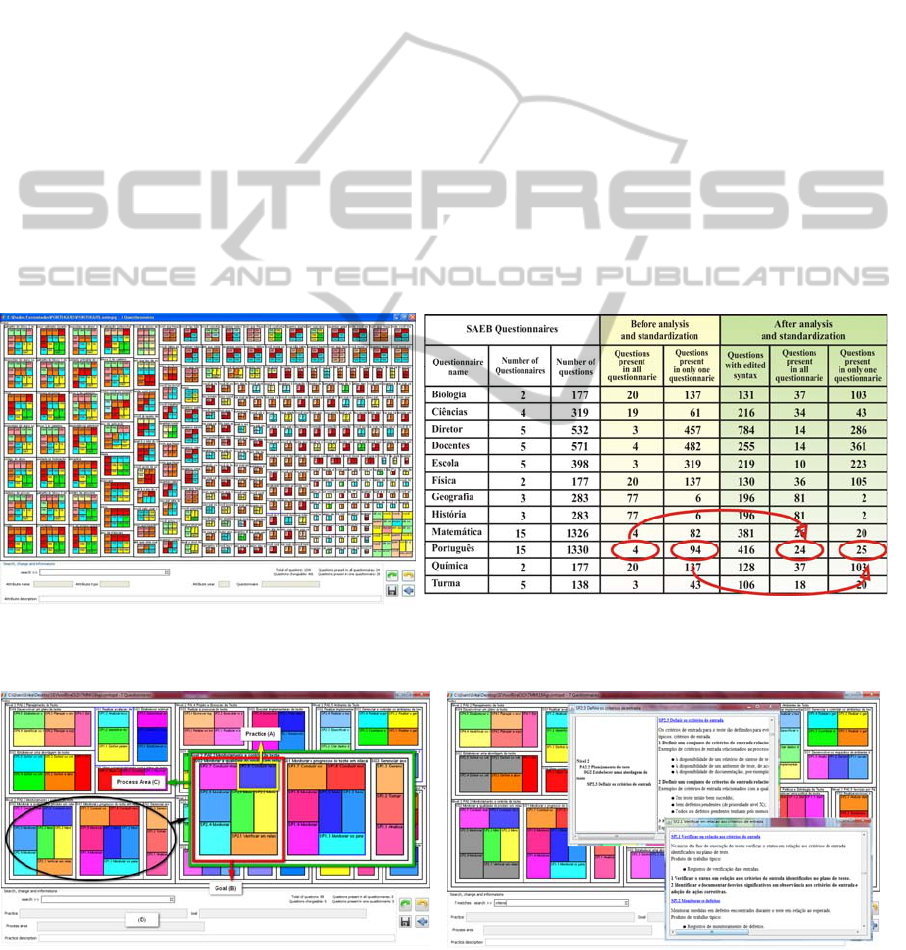
After the execution of step 3, the data represented
in Figure 3 generates the visualization of Figure 5(a).
FacilitatingtheHandlingofDocumentsthroughTree-MapVisualization
101
Observe that in Figure 5(a) there are fewer isolated
boxes and more questions that have been grouped.
The isolated boxes correspond to questions that that
have been applied only once.
Figure 3: The questions highlighted contain the same
keyword.
Figure 5(b) shows the impact of applying the
visualization-based process on the SAEB evaluation
data. For example, the numbers related to the
“Português” questionnaire, considered in this study,
are highlighted in this figure. After the usage of the
functions search and edit combined with the tree-map
visualization, the questions that were applied to all
questionnaires increased from 4 to 24 and the
questions that were applied in only one questionnaire
decreased from 94 to 25.
Observe a similar situation occurred for the
questionnaires of the other disciplines. In other words,
the application of this visualization-based process
enhanced the quality and the usefulness of the data,
since a more accurate analysis can be done and the
amount of common data increases.
4.2 Case Study 2: Structured Reading
After the development of the first version of the
SeEd-Visual tool, another problem has arisen: the
need to establish dependencies among the TMMi
practices (TMMi Foundation, 2011). This model is
reference model structured in Levels, Process Areas
(PAs), Goals and Practices. To solve the problem, it
was necessary to compare all practices, in pairs,
aiming to identify if there were dependencies between
them and, if so, determine their type.
Aiming to execute this comparison it was
necessary to identify the practices that addressed a
specific subject, ie, a keyword. Then, to analyze
possible dependencies, it was necessary to read the
practices description.
Considering the availability of the SeEd-Visual
tool, it was adapted to aid in the solution of this
problem. As the TMMi document has a hierarchically
organized text, the tree-map visualization was ideal to
present it and to highlight all the practices that
addressed a subject, through the application of the
search function. Thus, the major modification on the
tool was related to the structured reading, which was
necessary to handle the information appropriately.
This modification allowed the creation of a hyperlink
between an item of the TMMi structure and the
respective text in the TMMi document, which was
transformed into a HTML file.
In this case study the visualization-based process
presented in Figure 1 was instantiated in the flowchart
of Figure 4.
Figure 4: Flowchart of the visualization-based process of
the questionnaire analysis.
First, two files are generated from the TMMi
document. One of them is a txt file, which contains
the structure of the reference model (Process Area,
Goals, Practices and Practices Descriptions), and is
uploaded into the SeEd-Visual tool. The other one is a
HTML file that is used to access parts of the TMMi
document, depending on the item of the reference
model that was selected by the user. The tool
transforms the txt file into a visual metaphor, where
each practice is represented by a box of the tree-map
visualization. After that, the search function can be
used to identify the TMMi practices that address the
same subject, and then can be interdependent.
Below, each step of the process for structured
reading, shown in Figure 6, is detailed.
1) Prepare the TMMi information to be uploaded
into SeEd-Visual tool= create a .txt file that contains
the TMMi structure: Process area, Goal and a short
description of the Specific Practice.
2) Transform the TMMi file into a HTML= create a
HTML file correspondent to the TMMi document,
containing hyperlinks in the titles of the structures
(process areas, goals and practices). The hyperlinks
should be equal to those contained in the .txt file
uploaded into the SeEd-Visual tool.
3) Upload the .txt file into the SeEd-Visual tool=
the data are visualized as showed in Figure 6(a),
where:
a) each colored box corresponds to a practice, but
unlike case study 1, the colors do not represent
ICEIS2012-14thInternationalConferenceonEnterpriseInformationSystems
102
a special piece of information (A);
b) white boxes grouping a set of colored boxes
correspond to a goal (B);
c) the outer level of grouping, i.e., a set of goals,
correspond to a process area (C);
d) the information presented at the bottom side,
when clicking on a box contains: the practice,
its goal and process area, beyond the practice
descriptive text (D).
4) Upload the .txt file into the SeEd-Visual tool=
the data are visualized as showed in Figure 6(a),
where:
a) each colored box corresponds to a practice, but
unlike case study 1, the colors do not represent
a special piece of information (A);
b) white boxes grouping a set of colored boxes
correspond to a goal (B);
c) the outer level of grouping, i.e., a set of goals,
correspond to a process area (C);
d) the information presented at the bottom side,
when clicking on a box contains: the practice,
its goal and process area, beyond the practice
descriptive text (D).
Aiming to establish the dependencies, the user
must provide the subject for which he wants to find
the related practices. This is done through the search
function, as in case study 1. As soon as he provides a
keyword for that subject, all the boxes that contain
such keyword will immediately become gray, as
indicated in Figure 6(b). This visual result also
allows realizing the impact of that subject on the
TMMi reference model as a whole. As an example,
in Figure 6(b), the keyword “criterion” was provided
to the search function. The gray boxes indicate that
this word appears in three different PAs.
After the identification of the PAs that address the
desired subject, the user can access the text of the
TMMi practices to analyze if they present depen-
dencies, i.e, in case the application of a practice
depends on the other one. Each double-click on a gray
box opens a HTML file (that conteins the TMMi prac-
tice), which allows displaying the practices in parallel,
enabling the comparison in pairs (Figure 6 (b)).
The structured reading herein presented makes
the handling of TMMi document easier. In this case
the visualization provides a better comprehension of
the document and facilitates its analysis. In addition,
(a)
(b)
Figure 5: (a) The same data presented in Figure 3 after the analysis and standardization. (b) Numbers on the SAEB
metadata before and after the analysis supported by the visualization-based process.
(a)
(b)
Figure 6: a) TMMi visualized in SeEd-Visual tool. b) The result of the search function applied with the keyword “criterion”
(in gray) and the text of two practices selected through hyperlinks.
FacilitatingtheHandlingofDocumentsthroughTree-MapVisualization
103

this kind of reading can be applied to different
domains, for example, laws, standards and manuals.
5 CONCLUSIONS
This paper presented the use of tree-map visualization
combined with the functions search, edition, data
regrouping, and hyperlink navigation as a practical
solution for data analysis.The use of these functions in
a coordinated way facilitates the interaction of the user
with the tool, enhancing the human cognition capacity.
This proposal was derived from the need of
analyzing a large amount of data, but this analysis
would be easier in case all the data were visualized at
the same time. Thus, aiming to take advantage of the
full screen, the tree-map visualization has been chosen.
Besides, the data (a set of questions) must be corrected
(ie, edited), triggering immediate regrouping in the
visual metaphor. The aim was grouping the data as
much as possible. In addition, to identify which data
must be corrected, the search option should also be
available. Hence, this initial proposal – tree-map,
search, edition and data regrouping – was implemented
in the tool named SeEd-Visual, which has been the
basis to solve similar problems.
After this first problem, it was needed to establish a
practical way to handle the large document of the
TMMi reference model. It was necessary to read the
description of its practices with the aim of deciding if
there was any dependency among the ones that were
related to a specific issue. Again, a whole overview of
the document structure requires the tree-map
visualization. The search function solves the problem
of identifying which practices should be read. But the
reading still requires the access of the TMMi practice
full text. Then, the hyperlink function was added to the
SeEd-Visual, allowing a structured reading,
simultaneously, fragments of this large document.
In summary, the tree-map technique was a good
choice to provide a view of the whole data and the
functions search, edit, regrouping and hyperlink made
the interaction between the user and the visualization
easier. As further work, the SeEd-Visual will be used
as the basis for the development of a free tool that can
be used in the context of qualitative analysis to support
the coding technique application.
ACKNOWLEDGEMENTS
The authors wish to thank the Brazilian funding
agencies CNPq, CAPES and FAPESP, the INEP
institute, the Observatório da Educação project and
INCT-SEC (National Institute of Science and
Technology - Critical Embedded Systems - Brazil),
processes 573963/2008-9 and 08/57870-9.
REFERENCES
Burley, D. 2010. Information visualization as a knowledge
integration tool. Jounal of Knowledge Management
Practice, 11(4).
Card, S., Mackinlay, J. and Shneiderman, B., 1998.
Readings in Information Visualization: Using Vision to
Think. Morgan Kaufmann; San Francisco, 1999.
Clarkson, E, Desai, K. and Foley, J., 2009. ResultMaps:
Visualization for Search Interfaces. IEEE Trans.
Visualization and Computer Graphics, 15 (1).
Eler, D. et al., 2009. Visual analysis of image collections.
The Visual Computer, 25 (10), pp. 923-937.
Johnson, B., Shneiderman, B. 1991. Tree-maps: a space-
filling approach to the visualization of hierarchical
information structures. In. Conf. Visualization, IEEE
Press.
Kan, Z., Hu, C., Wang, Z. Wang, G. and Huang, X., 2010.
NetVis: A network security management visualization
tool based on treemap. In. Inter. Conf. Advanced
Computer Control, IEEE Press.
NetBeans, 2012 - Java IDE (Integrated Development
Environment) [online] Available at:
<www.netbeans.org> [Accessed 20 January 2012].
Paulovich, F., Oliveira, M., Minghim, R., 2007. The
Projection Explorer: a flexible tool for projection-based
multidimensional visualization. In. BR Symp. Computer
Graphics Image Processing, IEEE Computer Society.
Paulovich, F. et al., 2008. PEx-WEB: content-based
visualization of web search results. In. 12th Inter. Conf.
Information Visualisation, Elsevier.
Prefuse, 2012. Visualization toolkit [online]. Available at:
<http://prefuse.org > [Accessed 20 January 2012].
Shannon, R., Quigley, A. and Nixon, P., 2010. Deep Diffs:
visually exploring the history of a document. In Inter.
Conf. Advanced Visual Interfaces, ACM New York.
Rübel, O., et. al., 2010. Coupling visualization and data
analysis for knowledge discovery from multi-
dimensional scientific data. Procedia Computer Science,
1(1), pp. 1757-1764.
Silva, S., Santos, B. S. and Madeira, J. 2011. Using color in
visualization: A survey. Computers & Graphics, 35 (2),
pp. 320-333.
TMMi Foundation, 2009. The Test Maturity Model
Integrated - TMMi Reference Model [online] Available
at:<http://www.tmmifoundation.org/html/tmmiref.html
> [Accessed 20 January 2012].
HCIL, 2003. Human Computer Interaction Lab, University
of Maryland [online] Available at: <http://www.cs.umd.
edu/hcil/treemap> [Accessed 20 January 2012].
Wu, Y. et al., 2010. OpinionSeer: interactive visualization
of hotel customer feedback. IEEE Trans. Visualization
and Computer Graphics, 16(6), pp. 1109-1118.
Newsmap, 2010. [online] Available at:
<http://newsmap.jp> [Accessed 20 January 2012].
ICEIS2012-14thInternationalConferenceonEnterpriseInformationSystems
104
