
Benchmarking with TPC-H on Off-the-Shelf Hardware
An Experiments Report
Anna Thanopoulou
1
, Paulo Carreira
2,3
and Helena Galhardas
2,3
1
Department of Electrical and Computer Engineering, National Technical University of Athens, Athens, Greece
2
Department of Computer Science and Engineering, Technical University of Lisbon, Lisbon, Portugal
3
INESC-ID, Lisbon, Portugal
Keywords:
Database Benchmarking, Database Performance Tuning, Decision Support.
Abstract:
Most medium-sized enterprises run their databases on inexpensive off-the-shelf hardware; still, they need
quick answers to complex queries, like ad-hoc Decision Support System (DSS) ones. Thus, it is important
that the chosen database system and its tuning be optimal for the specific database size and design. Such
choice can be made in-house, based on tests with academic database benchmarks. This paper focuses on the
TPC-H database benchmark that aims at measuring the performance of ad-hoc DSS queries. Since official
TPC-H results feature large databases and run on high-end hardware, we attempt to assess whether the test
is meaningfully downscalable and can be performed on off-the-shelf hardware. We present the benchmark
and the steps that a non-expert must take to run the tests. In addition, we report our own benchmark tests,
comparing an open-source and a commercial database server running on off-the-shelf hardware when varying
parameters that affect the performance of DSS queries.
1 INTRODUCTION
In the day-to-day operations of a medium-sized en-
terprise, two types of queries are executed: Online
Transaction Processing (OLTP) and Decision Sup-
port (DSS). The former are basic information-retrieval
and -update functions. The latter are aimed at assist-
ing management decisions based on historical data. In
addition, DSS queries can be further categorized into
reporting and ad-hoc queries, depending on whether
they are executed routinely or in a spontaneous fash-
ion, respectively. As one would expect, the most chal-
lenging queries are the DSS ones as they are more
complex and deal with a larger volume of data; even
more so, ad-hoc DSS queries are challenging as they
do not allow for prior system optimization. Hence, it
is highly important to facilitate their execution.
The time needed to execute ad-hoc DSS queries
is above all related to the database design and size.
Furthermore, for a given database, time depends on
the choice of the RDBMS and its tuning. Given the
wide offer of database systems as well as their great
complexity, it is crucial yet not trivial for the enter-
prise to determine the best choice for its needs, both
in terms of price and in terms of performance. There-
fore, it would be very helpful to realize a quantitative
comparison of database systems performance under
various comparable configurations, possibly using a
benchmark.
The Transaction Processing Performance Council
(TPC) benchmark TPC-H sets out to model a busi-
ness database along with realistic ad-hoc DSS ques-
tions. It has been extensively used by database soft-
ware and hardware vendors as well as researchers
(Somogyi et al., 2009; Guehis et al., 2009). However,
TPC-H officially published results refer to very large
databases running on high-end hardware that are dif-
ficult to compare to the reality of a small enterprise.
Moreover, understanding TPC-H requires significant
technical expertise and, to the best of our knowledge,
no step-by-step guide exists in literature, apart from
generic guidelines for benchmark execution (Oracle,
2006; Scalzo, 2007).
This paper examines whether TPC-H can be used
as a tool by small enterprises as well as which would
be the best way to do so. Specifically, our contribu-
tions are: (i) a comparison of the performance of a
commercial and an open-source database system ex-
ecuting a small-scale TPC-H test under various com-
parable configurations on off-the-shelf hardware; and
(ii) insights into the tuning parameters that influence
DSS performance at this scale.
205
Thanopoulou A., Carreira P. and Galhardas H..
Benchmarking with TPC-H on Off-the-Shelf Hardware - An Experiments Report.
DOI: 10.5220/0004004402050208
In Proceedings of the 14th International Conference on Enterprise Information Systems (ICEIS-2012), pages 205-208
ISBN: 978-989-8565-10-5
Copyright
c
2012 SCITEPRESS (Science and Technology Publications, Lda.)

Figure 1: Complete process for running the TPC-H tests. The term query stream refers to a sequential execution of each of
the 22 TPC-H queries, in the order specified by TPC.
2 AN OVERVIEW OF TPC-H
The TPC-H benchmark models the activity of a prod-
uct supplying enterprise. For that purpose, it uses a
simple database schema comprised by eight base ta-
bles. Tables have different sizes that change propor-
tionally to a constant known as scale factor (SF). The
available scale factors are: 1, 10, 30, 100, 300, 1000,
3000, 10000, 30000 and 100000. The scale factor de-
termines the size of the database in GB. Tables are
populated using DBGEN, a data generator provided
in the TPC-H package to populate the database tables
with different amounts of synthetic data.
The benchmark workload consists of 22 queries,
representing frequently-asked decision-making ques-
tions, and 2 update procedures, representing periodic
data refreshments. The update procedures are called
refresh functions. From a technical standpoint, the
queries include a rich breadth of operators and se-
lectivity constraints, access a large percentage of the
populated data and tables and generate intensive disk
and CPU activity. The TPC-H workload queries are
defined only as query templates by TPC. The syntax
is completed providing random values for a series of
substitution parameters, using QGEN, an application
provided in the TPC-H package.
2.1 TPC-H Tests
TPC-H comprises two tests: the load test and the
performance test. The former involves loading the
database with data. The latter involves measuring the
system performance against a specific workload. As
soon as the load test is complete, the performance test,
which consists of two runs, can start. Each run is an
execution of the power test followed by an execution
of the throughput test. The power test aims at mea-
suring the raw query execution power of the system
with a single active session. This is achieved by se-
quentially running each one of the 22 queries. The
throughput test aims at measuring the ability of the
system to process the most queries in the least amount
of time, possibly taking advantage of I/O and CPU
parallelism. Thus, the throughput test includes at least
two query sessions that run in parallel. The minimum
number of query streams is specified by TPC and in-
creases together with the scale factor. Figure 1 illus-
trates the steps for running a complete TPC-H test.
2.2 Performance Metrics
After running the tests, we get three types of timing
measurements: the database load time, the measure-
ment interval and the timing intervals. The measure-
ment interval is the total time needed to execute the
throughput test. The timing intervals are the execu-
tion times for each query or refresh function. Next,
these timing measurement results must be combined
to produce global, comparable metrics. To avoid con-
fusion, TPC-H uses only one primary performance
metric indexed by the database size: the compos-
ite query-per-hour performance metric represented as
QphH@Size, where Size represents the size of data in
the test database as implied by the scale factor. This
metric weighs evenly the contribution of the single
user power metric (processing power metric repre-
sented as Power@Size) and the multi-user through-
put metric (throughput power metric represented as
T hroughput@Size). Finally, the price/performance
metric represented as Price − per − QphH@Size
serves to make a price/performance comparison be-
tween systems.
ICEIS2012-14thInternationalConferenceonEnterpriseInformationSystems
206
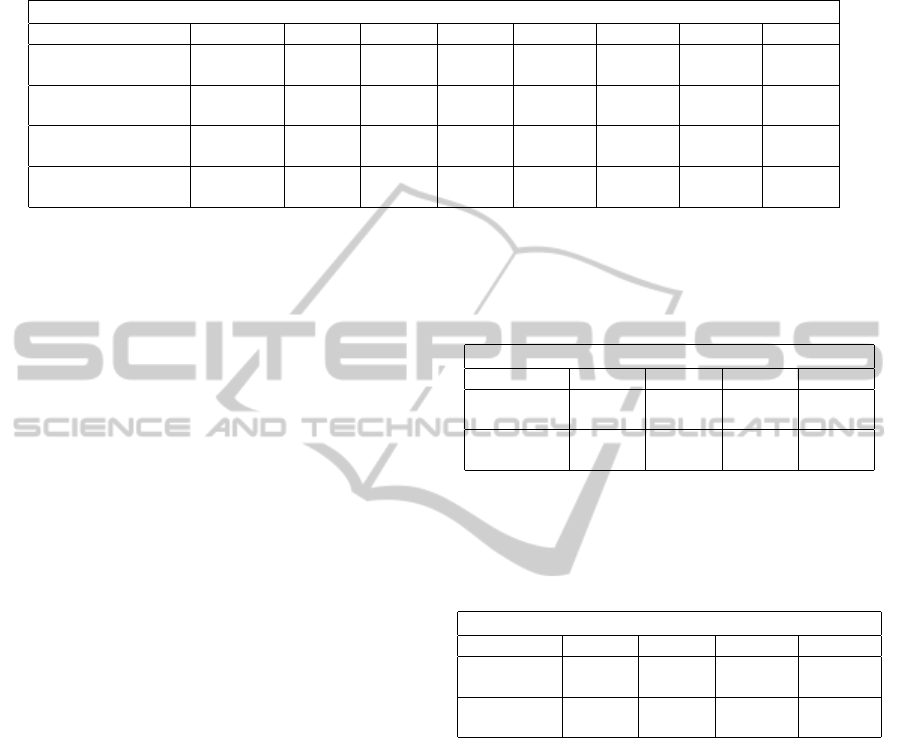
Table 1: TPC-H full test results for increasing memory size. In SQL Server, we varied the total server memory; in MySQL,
the buffer and sort memories, with a 3:1 ratio as recommended by MySQL developers. Fill factor is kept at 90% for SQL
Server and 15/16 (default) for MySQL. Page size is kept at 8KB (which is the default for SQL Server) for both systems.
Memory Size Test
total server memory 16 MB 64 MB 128 MB 256 MB 512 MB 768 MB 1024 MB
load test
SQL Server 46min 20min 19min 17min 16min 16min 36min
MySQL 48min 23min 20min 16min 16min 14min 57min
performance test
SQL Server 4h54min 1h13min 1h 52min 41min 40min 1h9min
MySQL 5h32min 1h28min 1h13min 1h2min 56min 54min 1h44min
QphH@1GB
SQL Server 19.13qph 78.55qph 90.20qph 102.30qph 130.76qph 131.80qph 86.03qph
MySQL 17.41qph 75.70qph 79.84qph 89.77qph 103.67qph 105.10qph 70.63qph
Price-per-QphH@1GB
SQL Server 73.08$ 17.80$ 15.49$ 13.67$ 10.69$ 10.61$ 16.25$
MySQL 28.72$ 6.60$ 6.26$ 5.57$ 4.82$ 4.76$ 7.80$
3 EXPERIMENTS
The goal of our experiments was to showcase a set
of useful TPC-H tests that any small enterprise could
perform in order to choose the database system and
tuning configurations that offer optimal ad-hoc DSS
performance in their system. In addition, we ran these
tests ourselves on off-the-shelf hardware, aiming at
some take-away rules-of-thumb for choosing between
a commercial (SQL Server 2008) and an open-source
(MySQL 5.1) database system and optimizing tuning
for DSS queries at this scale.
We are interested in the characteristics of ad-hoc
DSS workloads and the tuning parameters that affect
their performance, for a given database. Since DSS
queries deal with large amounts of data within scans,
sorts and joins, the size of the buffer pool and the sort
buffer play an important role. Following the same
logic, the fill factor and the page size can also in-
fluence performance, as they can contribute to more
rows per page thus keeping more sequential data in
the data cache.
However, not all these parameters can be set by the
user in each of the database systems at hand. In SQL
Server, it is not possible to set the size of the buffer
pool or the sort buffer; only the total size of mem-
ory that the system can use can be set, by determining
its minimum and maximum values. MySQL, on the
other hand, allows to set a specific size for the buffer
pool and the sort buffer. Also, while SQL Server op-
erates with a fixed page size of 8 KB, in MySQL the
user can set the page size to 8, 16, 32 or 64 KB. Fi-
nally, in SQL Server it is possible to specify the fill
factor for each page, while MySQL manages the free
space automatically, with tables populated in sequen-
tial order having a fill factor of
15
/16.
In light of these differences, we decided to run two
general types of tests: the memory size test and the
number of rows per page test. Tables 1, 2 and 3
Table 2: TPC-H full test results for increasing fill factor
in SQL Server. Page size is kept at default value of 8KB.
Memory size is set at a medium value of 128KB.
MS SQL Server- Number of Rows per Page Test
fill factor 40% 60% 80% 100%
load test 27min 22min 20min 19min
perf. test 2h2min 1h9min 1h3min 59min
QphH@1GB 34.59qph 80.10qph 89.34qph 91.58qph
PPQphH@1GB 40.42$ 17.45$ 15.65$ 15.23$
Table 3: TPC-H full test results for increasing page size
in MySQL. Fill factor is kept at default value of 15/16.
Total memory size is set at a medium value of 128KB,
with a buffer/sort memory ratio of 3:1 as recommended by
MySQL developers.
MySQL- Number of Rows per Page Test
page size 8 KB 16 KB 32 KB 64 KB
load test 20min 18min 17min 17min
perf. test 1h13min 59min 52min 50min
QphH@1GB 79.84qph 92.41qph 106.20qph 109.38qph
PPQphH@1GB 6.26$ 5.41$ 4.71$ 4.57$
show the test results. For the number of rows per page
test, note that the resulting range of number of rows
per page is different for the two database systems, but
that serves exactly the purpose of verifying whether
allowing the user to specify much larger page sizes
gives MySQL an advantage.
In the interest of simulating the environment of a
smaller enterprise, we chose inexpensive off-the-shelf
hardware (an AMD Athlon processor with 1GB of
RAM and a SATA 80 GB hard disk) and the lowest
possible scale factor (yielding a 1 GB database). We
find it interesting to provide some results with a lower
scale factor, as the only available ones to date are the
official TPC-H results starting at 100 GB. Finally, for
the price/performance metric calculations, we consid-
ered the hardware cost to be approximately 500$ and
the software cost to be the current price of 898$ for
SQL Server 2008 (circa 2010) and 0$ for MySQL 5.1.
BenchmarkingwithTPC-HonOff-the-ShelfHardware-AnExperimentsReport
207

Figure 2: Influence of memory size. Larger bubbles repre-
sent greater price per query per hour.
Figure 3: Influence of data per page (product of page size
and fill factor). Larger bubbles represent greater price per
query per hour.
3.1 Discussion
As illustrated in Figure 2, in the case of memory
size test, for both database systems performance im-
proves dramatically as we move from 16 to 768 MB
of memory. The system ends up reaching its full po-
tential around 512 MB; moving to 768 MB does not
make much difference, and reaching 1024 MB actu-
ally leads to a performance decrease. In this case,
the server allocates all physical memory to the cache
causing part of the latter to be on virtual memory thus
triggering further I/O operations.
For the same memory size, increasing either the
page size or the fill factor improves performance, as
illustrated in Figure 3. This makes sense because in
full scans relevant data are next to each other; thus,
the more data per page the less I/O operations and the
better the performance. Increasing the page size is
less effective than increasing the fill factor, as seen by
the trendlines steepness in Figure 3 for MySQL and
SQL Server respectively. In any case, increasing the
memory size has an influence that exceeds both those
of increasing the page size and the fill factor.
In addition, it is clear that, for approximately the
same configurations, the performance of MySQL is
slightly worse. This may mean that there are other
tuning parameters that cause performance deteriora-
tion when left in their default values. Most likely,
however, this performance difference indicates the su-
periority of SQL Server query optimizer when dealing
with complex queries.
Finally, even though the tests run faster in SQL
Server, the price/performance metric favors MySQL
by far. The additional 898$ for SQL Server do not
seem to be worthy for such low-scale needs.
4 CONCLUSIONS
We can conclude that the TPC-H test is meaning-
fully downscalable. Even with a low scale factor, we
could still observe differences between different sys-
tems and configurations. However, our intuition is
that its set-up time and complexity make the bench-
mark an unlikely choice for a medium-sized enter-
prise without a team of experts.
Running TPC-H motivated us to look into the fac-
tors that influence the performance of DSS queries.
We concluded that the most influential tuning option
is undoubtedly the memory size. Yet, other parame-
ters (ie. page size, fill factor) also influence perfor-
mance.
Since the systems do not have identical tuning op-
tions, it is hard to ascertain whether we tuned them
fairly. For similar tuning, MySQL is consistently
slower than SQL Server. We think this is due to differ-
ent query optimizer philosophies. Yet, MySQL may
take a little longer to execute the TPC-H tests but it
has a higher price/performance ratio. If not chasing
optimal performance, it is a viable alternative.
REFERENCES
Guehis, S., Goasdoue-Thion, V., and Rigaux, P. (2009).
Speeding-up data-driven applications with program
summaries. In IDEAS’09, 2009 Int’l Database En-
gineering and Applications Symposium. ACM Press.
Oracle (2006). Conducting a data warehouse benchmark.
Scalzo, B. (2007). Top 10 Benchmarking Misconceptions.
Quest Software, 121007 edition.
Somogyi, S., Wenisch, T., Ailamaki, A., and Falsa, B.
(2009). Spatio-temporal memory streaming. In
ISCA’09, 36th Annual Int’l Symposium on Computer
Architecture. ACM Press.
ICEIS2012-14thInternationalConferenceonEnterpriseInformationSystems
208
