
A Fault-Tolerant Controller for an SP-100 Space Nuclear Reactor
Ju Hyun Kim, Dae Seup Kim and Man Gyun Na
Department of Nuclear Engineering, Chosun University, 309 Pilmun-daero, Dong-gu, Gwangju, Korea
Keywords: Fault Detection and Diagnostics, Fault-Tolerant Control, Fuzzy Model, Model Predictive Control, Space
Reactor Power Control, Sequential Probability Ratio Test.
Abstract: The control system is a key element of space reactor design to meet the space mission requirements of
safety, reliability, survivability, economics, and autonomous action. The objectives of the proposed model
predictive control are to minimize both the difference between the predicted TE power and the desired
power, and the variation of control drum angle that adjusts the control reactivity. A genetic algorithm is
used to optimize the model predictive controller. The model predictive controller is integrated with a fault
detection and diagnostics algorithm so that the controller can work properly even under input and output
measurement faults. Simulation results of the proposed controller show that the TE generator power level
controlled by the proposed controller could track the target power level effectively even under measurement
faults, satisfying all control constraints.
1 INTRODUCTION
The SP-100 space nuclear reactor was designed to
provide a realistic and reliable source of very long-
term power for space exploration and exploitation
activities. The SP-100 system is a fast spectrum
lithium-cooled reactor system with an electric power
rating of 100 kW. The control functions needed for
SP-100 can be ensured only by an autonomous
control system, which assumes the responsibilities
for normal control, abnormal event response and
fault tolerance, and provides interface with operators
on earth for high-level decision-making.
In order to optimize the reactor power control
performance, methods for the optimal power control
of nuclear reactors have been presented extensively
in the past two decades. But it is very difficult to
design optimized controllers for nuclear systems of
the SP-100 space reactor. This work employs the
model predictive control (MPC) method, which has
received increased attention as a powerful tool for
the control of industrial process systems. The
dynamics of the SP-100 reactor system are highly
non-linear. Therefore, a nonlinear MPC
methodology has to be applied to predict the future
behavior of the plant based on a nonlinear model of
the process. In this work, the nonlinear model
development is conducted by a fuzzy model because
fuzzy models are simpler in structure and easier to
develop compared to other nonlinear models. Thus,
the on-line optimization problem is solved using a
genetic algorithm, which guarantees the feasibility
of all the generated potential solutions.
2 MODEL PREDICTIVE
CONTROL COMBINED WITH A
FUZZY MODEL
In this work, the MPC is combined with the fuzzy
model based on the subtractive clustering approach.
The model predictive controller combined with a
fuzzy model is called a fuzzy model predictive
controller. The MPC method is to solve an
optimization problem for a finite future at current
time and to implement the first optimal control input
as the current control input. The procedure is then
repeated at each subsequent instant. A performance
index for deriving an optimal control input is
represented by the following quadratic function:
[]
2
2
11
1
ˆ
(|)() ( 1)
2
LM
kk
yt k t wt k R ut k
==
+−++ Δ+−
⎡⎤
⎣⎦
∑∑
(1)
subject to constraints
min max
max
(1)0 for
()
()
ut k k M
uutu
ut u
⎧
Δ+−= >
⎪
≤≤
⎨
⎪
Δ≤Δ
⎩
452
Kim J., Kim D. and Na M..
A Fault-Tolerant Controller for an SP-100 Space Nuclear Reactor.
DOI: 10.5220/0004006704520457
In Proceedings of the 9th International Conference on Informatics in Control, Automation and Robotics (ICINCO-2012), pages 452-457
ISBN: 978-989-8565-21-1
Copyright
c
2012 SCITEPRESS (Science and Technology Publications, Lda.)

2.1 Output Prediction using a Fuzzy
Model
In this work, a fuzzy model based on subtractive
clustering (SC) is used to predict the future output of
the model predictive controller. The
i
-th fuzzy rule
for
t
-th time instant data is described as follows:
()
,1
,
,1
,
If ( 1) is ( )
( ) is ( )
(1)is ()
( ) is ( ),
ˆ
then ( ) is
( 1), , ( ), ( 1), , ( )
y
y
yu
i
yin
in
uinn
i
iyu
yt d A t AND
AND y t d n A t
AND u t A t AND
AND u t n A t
yt
f
ytd ytdn ut utn
+
+
−−
−−
Δ−
Δ−
−− −− Δ− Δ−
L
L
LL
(2)
The input vector to the fuzzy model consists of
y
and
uΔ
which are past values of output and
control input move, respectively, and can be
indicated as a vector consisting of a total of
m
elements (
y
u
mn n=+
, a total number of input
variables to the fuzzy model):
() ( 1) ( ) ( 1) ( )
yu
t yt d yt d n ut ut n
⎡⎤
=−− −−Δ−Δ−
⎣⎦
x LL
(3)
When the SC method is applied to a collection of
input/output data, each cluster center is in essence a
prototypical data point that exemplifies a
characteristic behavior of the system and each
cluster center can be used as the basis of a fuzzy rule
that describes the system behavior. The number of
n
fuzzy rules can be generated, where the premise
parts are fuzzy sets, defined by the cluster centers
that are obtained by the SC algorithm. The
membership function value
(())
i
A
tx of an input data
vector
()tx to a cluster center
()i
∗
x
can be defined
as follows:
()
2
2
4() ()
() , 1, 2, ,
tir
i
A
te i n
α
∗
−−
==
xx
x L
(4)
The fuzzy model output
ˆ
()yt
is calculated by the
weighted average of the consequent parts of the
fuzzy rules as follows:
()()
()
1
1
() ()
ˆ
()
()
n
ii
i
n
i
i
A
tf t
yt
At
=
=
=
∑
∑
xx
x
(5)
where the function
()
()
i
f
tx
which is an output of a
fuzzy rule is a polynomial in the input variables and
represented by the first-order polynomial of inputs
as follow:
()
,
1
() ()
m
iijji
j
f
tqxtr
=
=
+
∑
x
(6)
2.2 Control Input Optimization by a
Genetic Algorithm
Conventional optimization techniques for solving
the cost functions of (1) cannot be easily applied due
to the peculiarity of a fuzzy model that is basically a
nonlinear model. Therefore, the on-line nonlinear
optimization problem is solved using a genetic
algorithm, which guarantees the feasibility of all the
generated potential solutions.
A chromosome which is a candidate solution of
the optimization problem is represented by
g
s
,
whose elements consist of present and future control
inputs and has the following structure:
() ( 1) ( 1)
, 1, ,
gg g g
sutut utM
gG
⎡
⎤
=++−
⎣
⎦
=
L
L
(7)
The genetic algorithm proceeds according to the six
steps: initial population generation, fitness function
evaluation, selection operation, crossover operation,
mutation operation, and repeat or stop.
The fuzzy model is optimized by a genetic
algorithm, combined with a least-squares method.
That is, the genetic algorithm is used to optimize the
cluster radius,
r
α
, for the subtractive clustering of
numerical data, and the least squares algorithm is
used to calculate the consequent parameters,
,ij
q
and
i
r .
3 FAULT-TOLERANT CONTROL
USING FAULT DETECTION
AND DIAGNOSTICS
Since the human access for fixing the faults is
almost impossible in an outer space and also, the
maintenance to use robots is very difficult, the SP-
100 space nuclear reactor must supply the stable and
reliable power source even under the measurement
faults related to the control system to support the
space exploration and exploitation activities in the
outer space. Fault detection and diagnostics is an
important module in fault-tolerant control systems
and it is desirable to provide diagnostic information
AFault-TolerantControllerforanSP-100SpaceNuclearReactor
453

as soon as faults develop, so that the controllers are
automatically reconfigured and the further
deterioration is prevented.
In this work, a fault detection and diagnostics
algorithm is developed to estimate the input and
output measurements using a fuzzy model based on
the subtractive clustering method and to check the
operability of existing hardware sensors using a
sequential probability ratio rest (SPRT) so that the
FTC can handle the fault situations of the input and
output measurements or partial loss of actuators. In
this work, a fuzzy model is used to estimate the
input and output measurement signals. This fuzzy
model is another fuzzy model which is different
from the fuzzy model that predicts the system output,
which is needed to minimize the control objective
function.
The objective of sensor fault detection and
diagnostics is to diagnose sensor health as soon as
possible with a very small probability of making a
wrong decision. The SPRT uses the residual
(difference between the measured value and the
estimated value,
ˆ
() ()yt yt−
). Normally the residual
signals are randomly distributed, so they are nearly
uncorrelated and have a Gaussian distribution
function
(, , )
it i i
Pm
ε
σ
, where
t
ε
is the residual
signal at time instant
t
, and
i
m and
i
σ
are the mean
and the standard deviation under hypothesis
i
,
respectively. The sensor degradation or fault can be
stated in terms of a change in the mean
m
or a
change in the variance
2
σ
. Therefore, the SPRT
detects sensor health by sensing the alteration of the
probability distribution. If a set of samples,
i
x
,
1, 2, ,ik= L , is collected with a density function
describing each sample in the set, an overall
likelihood ratio is given by
11 1 12 1 13 1 1 1
01 0 02 0 03 0 0 0
(|)(|)(|) (|)
(|)(|)(|) (|)
k
k
k
PHPHPHPH
P
HP HP H P H
εεε ε
γ
εεε ε
⋅⋅⋅⋅⋅
=
⋅⋅⋅⋅⋅
(8)
where
0
H
represents a hypothesis that the sensor is
normal and
1
H
represents a hypothesis that the
sensor is degraded.
By taking the logarithm of the above equation
and replacing the probability density functions in
terms of residuals, means and variances, the log
likelihood ratio can be written as the following
recurrent form:
22
00 1
1
22
1
01
()()
ln
22
kk
kk
mm
σε ε
λλ
σ
σσ
−
⎛⎞
−−
=+ + −
⎜⎟
⎝⎠
(9)
This ratio is used for deriving the sensor drift
detection algorithm. For a normal sensor, the log
likelihood ratio would decrease and eventually reach
a specified bound
A
, a smaller value than zero.
When the ratio reaches this bound, the decision is
made that the sensor is normal, and then the ratio is
reinitialized by setting it equal to zero. For a
degraded sensor, the ratio would increase and
eventually reach a specified bound
B
, a larger value
than zero. When the ratio is equal to
B
, the decision
is made that the sensor is degraded. The specified
bounds
A
and
B
are important in determining the
sensor faults. The decision boundaries
A
and
B
are
chosen by a false alarm probability
α
and a missed
alarm probability
β
;
ln
1
A
β
α
=
−
⎛⎞
⎜⎟
⎝⎠
and
1
lnB
β
α
−
=
⎛⎞
⎜⎟
⎝⎠
.
The input signal is the control drum angle to
regulate the reactivity and the output signal to be
controlled is the TE power. Also, to handle the sensor
faults, the input and output signals of the control
system are estimated by using a fuzzy model for
signal estimation from the measurements of the SP-
100 reactor system. If the input or output sensors are
normal, the measured values are used to predict the
future control system output. But if they are
determined to be degraded or faulty, the faulty sensors
are isolated and the estimated sensor signals instead
of the measured values are used to predict the future
system output. The schematic block diagram of the
proposed FTC is illustrated in Figure 1.
Figure 1: Block diagram of the proposed FTC for an SP-
100 space reactor.
4 APPLICATION TO THE SP-100
SPACE REACTOR
The reactor system of the SP-100 space reactor is
made up of a reactor core, a primary heat transport
ICINCO2012-9thInternationalConferenceonInformaticsinControl,AutomationandRobotics
454

loop, a TE generator, and a secondary heat transport
loop to reject waste heat into space through
radiators. The reactor core is composed of small
disks of highly enriched (93%) uranium nitride fuel
contained in sealed tubes. Figure 2 shows a
schematic of one loop of the reactor system. The
heat generated in the reactor core is transported by
liquid lithium and is circulated by electromagnetic
(EM) pumps. The energy conversion system uses the
direct TE conversion mechanism.
Figure 2: Schematic of TE SP-100 space reactor system.
4.1 SP-100 System Description
The individual modules of the integrated model, as
shown in Figure 3, include a model of reactor
control mechanism, a neutron kinetics model, a
reactor core heat transfer model, and a heat
exchanger model coupled with the TE conversion
model.
Figure 3: Integrated model of the SP-100 system.
The point reactor kinetics model with six delayed
neutron groups is used to describe the dependence of
nuclear reactor power on the reactivity change. This
is given by the following equations:
6
1
() ()
() ()
()
() ()
ii
i
ii
ii
dP t t
Pt C t
dt
dC t
Pt C t
dt
ρβ
λ
β
λ
=
−
=+
Λ
=−
Λ
∑
(10)
A simplified reactor core heat transfer model is
developed to calculate the fuel temperature, the
cladding temperature, and the average core coolant
temperature. The fuel temperature
f
T
, the cladding
temperature
clad
T and the average core coolant
temperature
c
T are described by the following
ordinary differential equations:
(
)
()
()
f
clad f
f
f
PTT UA
dT t
dt C
−−
=
(11)
(
)
(
)
() ()
()
f
clad f clad c clad
clad
clad
T T UA T T UA
dT t
dt C
−−−
=
(12)
(
)()
()
()
clad c clad c P ex in
c
c
TTUA mCTT
dT t
dt C
−−−
=
&
(13)
where the parameters have their usual meanings.
Electric power is generated by 3 loops × 12
primary heat exchangers × 30 channels × 480 TE
cells. Each TE cell consists of two semiconductors,
one P-type and one N-type. Because there is a
temperature gradient between the hot shoes and the
cold shoes of TE cells, when heat is conducted from
the hot shoe of a TE cell to its cold shoe, electric
power will be generated due to the Seebeck effect.
4.2 Applications
The FTC for the TE power control is subject to
constraints as follows:
(1)0forut j j M
Δ
+− = >
0()180
oo
ut≤≤
() 1.4
o
ut TΔ≤
Figure 4 describes the performance of a
developed fault detection and diagnostics algorithm.
Figure 4(a) shows the training and test data used to
design and test the algorithm. Figure 4(b) shows the
fault detection and diagnostics performance when
the output measurement is assumed to begin to be
gradually degraded artificially from 300 sec. The
signals used to estimate the output measurement are
the reactor core thermal power, control drum angle,
core inlet and outlet temperatures, and cold shoe and
hot shoe temperatures, which is a total of 6 signals.
Since the output signal of the control system is
important above all, the output measurement fault
was simulated. The gradual degradation of the
output measurement is detected at 321 sec since the
beginning of the gradual degradation.
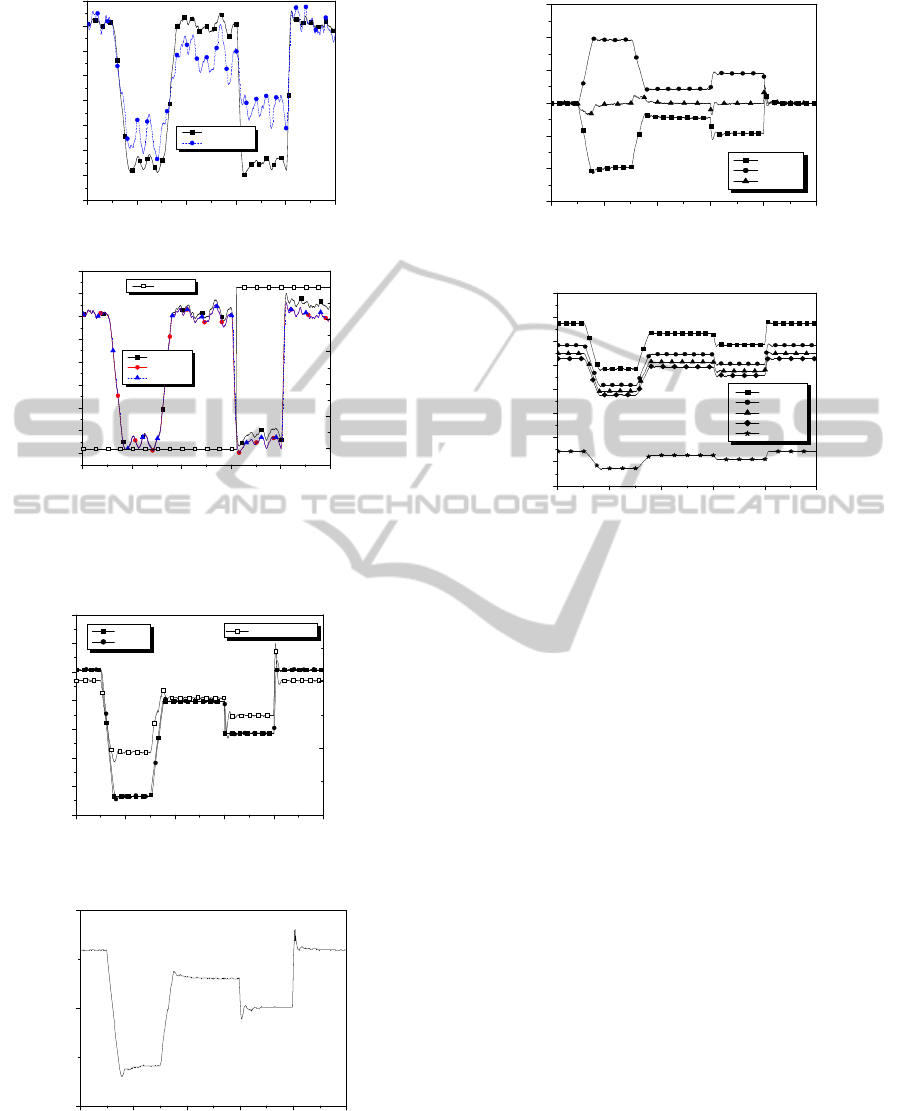
Figure 5 shows the performance of the proposed
FTC for normal transients such as the setpoint
change of TE power. The setpoint starts to change
AFault-TolerantControllerforanSP-100SpaceNuclearReactor
455
(a) training data and test data
(b) fault detection and diagnostics
Figure 4: Performance of a fault detection and diagnostics
algorithm.
(a) TE power and thermal reactor power.
(b) control drum angle
Figure 5: Performance of the proposed FTC for normal
transients.
(c) reactivity
(d) temperature
Figure 5: Performance of the proposed FTC for normal
transients (cont.).
by ramp at 100 sec and 300 sec, respectively and
also changes by step at 600 sec and 800 sec. The
performance of the proposed controller was checked
with a roughly adjusted factor of
1=
ω
. It is shown
that the TE generator power follows its desired
setpoint change very well. It was known that the
proposed controller meets several constraints very
well and accomplishes the fast and stable responses.
5 CONCLUSIONS
In this work, the fault-tolerant controller combining
a model predictive controller and the fault detection
and diagnostics algorithm was developed to control
the nuclear power in the SP-100 space reactor
system. Based on a fuzzy model consisting of the
control drum angle change and the TE power, the
future TE power is predicted by using the fuzzy
model identified by a subtractive clustering method
of a fast and robust algorithm. Another fuzzy model
combined with the sequential probability ratio test
estimates the input and output measurement signals
and diagnoses the health of input and output
measurements. The genetic algorithm was used to
optimize the model predictive controller and both
the fuzzy models. With the presence of faults, the
0 200 400 600 800 1000
40
50
60
70
80
90
100
110
120
TE power (kW)
time (sec)
training data
test data
0 200 400 600 800 1000
50
60
70
80
90
100
110
120
130
trip flag
TE power (kW)
time (sec)
measured
actual
estimated
0.0
0.2
0.4
0.6
0.8
1.0
trip flag
0 200 400 600 800 1000
60
70
80
90
100
110
120
130
TE power (kW)
time (sec)
setpoint
actual
1.0
1.5
2.0
2.5
thermal reactor power (MW)
thermal power
0 200 400 600 800 1000
110
120
130
drum angle (deg)
time
(
sec
)
0 200 400 600 800 1000
-0.6
-0.4
-0.2
0.0
0.2
0.4
0.6
reactivity (dollar)
time
(
sec
)
control
feedback
total
0 200 400 600 800 1000
700
800
900
1000
1100
1200
1300
1400
1500
temperature (
o
K)
time
(
sec
)
fuel
core outlet
core inlet
hot shoe
cold shoe
ICINCO2012-9thInternationalConferenceonInformaticsinControl,AutomationandRobotics
456

control law is reconfigured using online estimates of
the measurements. The simulation result of the fault-
tolerant controller shows that the TE generator
power follows its desired setpoint change very well.
Also, the proposed controller meets several
constraints very well and accomplishes the fast and
stable responses.
REFERENCES
S. F. Demuth, 2003, SP-100 Space Reactor Design,
Progress in Nuclear Energy, Vol. 42, No. 3, pp. 323-
359.
Y. B. Shtessel, 1998, Sliding Mode Control of the Space
Nuclear Reactor System, IEEE Trans. Aerospace and
Electronic Systems, Vol. 34, No. 2, pp. 579-589.
M. G. Na and B. R. Upadhyaya, Aug. 2006, Model
Predictive Control of an SP-100 Space Reactor Using
Support Vector Regression and Genetic Optimization,
IEEE Trans. Nucl. Sci., Vol. 53, No. 4, pp. 2318-2327.
M. G. Na and B. R. Upadhyaya, Nov./Dec., 2006,
Application of Model Predictive Control Strategy
Based on Fuzzy Identification to an SP-100 Space
Reactor, Annals of Nuclear Energy, Vol. 33, Nos. 17-
18, pp. 1467-1478.
M. G. Na, B. R. Upadhyaya, X. Xu, and I. J. Hwang, Nov.
2006, Design of a Model Predictive Power Controller
for an SP-100 Space Reactor, Nucl. Sci. Eng., Vol.
154, No. 3, pp. 353-366.
S. L. Chiu, 1994, Fuzzy Model Identification Based on
Cluster Estimation, J. Intell. Fuzzy Systems, Vol. 2,
pp. 267-278.
H. Sarimveis and G. Bafas, 2003, Fuzzy Model Predictive
Control of Non-linear Processes Using Genetic
Algorithms, Fuzzy Sets Systems, Vol. 139, pp. 59-80.
M. G. Na and I. J. Hwang, 2006, Design of a PWR Power
Controller Using Model Predictive Control Optimized
by a Genetic Algorithm, Nucl. Eng. Tech., Vol. 38,
No. 1, pp. 81-92.
W. H. Kwon and A. E. Pearson, 1977, A Modified
Quadratic Cost Problem and Feedback Stabilization
of a Linear System, IEEE Trans. Automatic Control,
Vol.22, No. 5, pp. 838-842.
J. Richalet, A. Rault, J. L. Testud, and J. Papon, 1978,
Model Predictive Heuristic Control: Applications to
Industrial Processes, Automatica, Vol.14, pp. 413-
428.
C. E. Garcia, D. M. Prett, and M. Morari, 1989, Model
Predictive Control: Theory and Practice – A Survey,
Automatica, Vol. 25, No. 3, pp. 335-348.
AFault-TolerantControllerforanSP-100SpaceNuclearReactor
457
