
Quality of Experience Evaluation for Data Services over Cellular
Networks
Gerardo Gómez
1
, Esther de Torres
1
, Javier Lorca
2
, Raquel García
2
, Quiliano Pérez
2
and Estefanía Arias
2
1
Department of Communications Engineering, University of Malaga, 29071 Malaga, Spain
2
Telefonica I+D, 28006 Madrid, Spain
Keywords: Quality of Experience, MOS, Performance Evaluation, Quality of Service.
Abstract: This paper presents an end-to-end service performance evaluation method that is able to estimate both the
Quality of Service (QoS) and Quality of Experience (QoE) associated to different data services over cellular
networks. A set of performance indicators are evaluated at each layer of the terminal’s protocol stack
following a bottom-up process from the physical layer up to the application layer. Then, specific utility
functions for each data service are used to map QoS into QoE in terms of Mean Opinion Score (MOS).
Three different data services (web browsing, video YouTube and Skype-based voice over IP) have been
evaluated in this paper under different network and terminal configurations. Performance results show that
the MOS associated to a particular data service is largely affected by the radio level performance (error rate,
throughput and delay), so proper protocols’ configuration is a key issue to maximize the QoE.
1 INTRODUCTION
Next generation mobile communication systems will
support diverse types of services across different
types of wired/wireless access technologies. The
end-to-end Quality of Service (QoS) provision in
such a heterogeneous scenario is one of the main
topics in networks research nowadays.
The estimation of the service performance and
Quality of Experience (QoE) perceived by the user
plays a very important role in wireless networks, as
it can be a very valuable input for network design,
dimensioning, planning, optimization, configuration
or upgrade. However, the assessment of the QoE
requires analyzing the performance of the whole
network (from user equipment to application server
or remote user equipment), which includes the
following aspects: individual performance figures
for each network element, interfaces and interactions
between them, protocols behavior, and how the end-
user perception is affected by network-related
degradations. In addition, the end-user reacts in a
different manner to degradations for different
services, e.g., the end-user perception is highly
affected by the end-to-end delay in conversational
services whereas it has a lower impact on
background services such as files transfer.
A common issue from network operators’
viewpoint is the process of assessing and managing
the QoS of their new services as well as evaluating
the quality experienced by the end user.
Traditionally, network metrics like accessibility,
retainability and quality were sufficient to evaluate
the user experience for voice services. However, for
data services, the correlation between network
performance indicators and application performance
indicators is not so straightforward due to the
following reasons: firstly, data systems have several
protocol layers; and secondly, radio data bearers are
typically shared among different services and
applications. In these conditions, data service
performance assessment is usually performed
through active terminal monitoring over real
networks. Obviously, if the operator wants to collect
statistics on a reasonable number of terminals,
applications and locations, this process is very
expensive and time consuming.
In some cases, the service and/or specific
network to be evaluated are not available or cannot
be tested and configured easily. In other cases, the
service or specific network is available, but it is
needed to estimate their performance under specific
configurations, scenarios or network conditions that
cannot be easily reproduced. Additionally, the
387
Gómez G., de Torres E., Lorca J., García R., Pérez Q. and Arias E..
Quality of Experience Evaluation for Data Services over Cellular Networks.
DOI: 10.5220/0004009703870396
In Proceedings of the International Conference on Signal Processing and Multimedia Applications and Wireless Information Networks and Systems
(WINSYS-2012), pages 387-396
ISBN: 978-989-8565-25-9
Copyright
c
2012 SCITEPRESS (Science and Technology Publications, Lda.)

performance subjectively perceived by the end user,
i.e. in terms of Mean Opinion Score (MOS), cannot
be directly obtained based on network performance
metrics. This is due to the behavior of different
protocols and mechanisms along the network
elements and their protocol stack, as well as the
complex translation of QoS metrics to QoE
perceived by the user, which is very service
dependent. Typically, the QoE has been measured
by performing subjective tests to a wide set of users
in order to know their satisfaction degree through a
MOS indicator, which can range from 1 (bad) to 5
(excellent); this type of methods is obviously costly
and time-consuming for both the subscribers and the
operator.
A particular application of this type of solution
(i.e. mapping network into application performance
indicators and MOS) for determining the quality of
experience for on-line gaming traffic is described by
Gustafsson et al. (2010), with the peculiarity of
using a modeling unit to map game and transport
level measurements into MOS values. However, this
work is only applicable to online-gaming services as
the model is just based on game and transport
parameters, with no possibility of using performance
indicators from lower layers (e.g. radio protocols in
a 3G cellular network like MAC, RLC or PDCP).
This means that the network element in charge of
monitoring the game and transport performance
parameters must have access to the application and
transport levels.
Other works have focused on the design and/or
configuration of lower layers to optimize upper
layers’ performance (Luo et al., 2000); (De May et
al., 2005); (Lassila and Kuusela, 2008), propose new
radio resource management techniques which are
adaptive to the QoS or QoE (Piamrat et al., 2010) or
focus on particular algorithms to enhance objective
quality evaluation of a specific service like voice
(Lee et al., 2009). However, none of the previous
works provides a method to easily evaluate the
application layer performance or the QoE for
different packet data services over any network
configuration.
In this paper we present an end-to-end evaluation
method that is able to assess the QoS and QoE for
different multimedia applications like video, voice
over IP (VoIP) and web-browsing. The proposed
framework provides a set of performance indicators
like throughput, delay, and loss rate at different
points of the whole protocol stack. This approach
may be used for different purposes like e.g.
estimation of the QoE for new data services over a
specific wireless network (this process can help on
the design and optimization of new services in order
to improve the QoE). In addition, it provides a good
understanding of how the application performance is
affected by the end-to-end network behavior and a
way to find the most critical layer in the protocol
stack without the need of real networks monitoring.
The remainder of this paper is organized as
follows. The proposed methodology to evaluate the
QoS and QoE associated to any data service is
described in section 2. Section 3 presents a set of
performance results for three different data services
(web browsing, video YouTube and Skype-based
VoIP) under different network and terminal
configurations. Finally, some concluding comments
are given in section 4.
2 QUALITY EVALUATION
METHODOLOGY
Packet data services performance and end-user’s
experience can be characterized considering the
cumulative performance degradation along the
different network elements and protocol stacks plus
the effect of the subjectivity and the perception of
the end-user. Generally, such performance is
assessed through indicators that are very service
dependant, such as response time in web browsing
or average throughput when downloading a file.
We propose a new methodology for estimating
the QoS and QoE perceived by the user for different
packet data services over wireless networks. The
proposed methodology is based on network and
protocol models, service-related parameters and
utility functions that map QoS objective metrics into
the subjective experienced quality as perceived by
the end-user. Such approach allows easily predicting
the performance of different services under specific
wireless environments (GPRS, UMTS, LTE, etc.)
without the need of running, capturing and analyzing
the traffic generated from a real scenario. However,
the models can be optionally fed from radio and
network performance indicators obtained from
different sources: a) Network Operation and Support
Subsystem (OSS), b) real measurements obtained at
the network or the terminal side (if available), or c)
simulation results.
The method herein described is based on
theoretical models, including the impact of the:
network elements along the end-to-end path (e.g.
user equipment, base station, gateways, server, etc.),
protocols and interfaces;
particular service under analysis, including
WINSYS2012-InternationalConferenceonWirelessInformationNetworksandSystems
388

aspects like content sizes (e.g. in a web browsing
service: web page text size, number of embedded
objects, object sizes), protocols and signaling, and
specific application performance indicators (APIs);
end-user perception, which includes how the
subjective experienced quality is affected by APIs
(e.g. initial delay, total response time) and
perception (e.g. resolution).
2.1 Quality of Service Evaluation
The model herein proposed offers a methodology of
analysis and evaluation of the QoS based on layers.
Each layer is modeled and evaluated based on a set
of performance indicators. The goal of the proposed
methodology is to provide a performance indicator
for different services based on the network
performance indicators as well as on their own
service parameters. The simulations focus on a
hypothetical user which experiences a given set of
MAC-level radio access performance parameters,
from which the model is able to derive application-
level QoS indicators after modeling all the
intermediate layers. For the topic at hand, a general
LTE network architecture has been considered (see
Figure 1). In the proposed methodology each layer is
modeled and evaluated based on a set of
performance indicators. Note that depending on the
particular layer, the scope of each performance
indicator may include the end-to-end network (for
application, transport and network layers) or just the
radio interface (for radio specific layers).
The modeling methodology follows a bottom-up
approach, from the physical up to the application
layer, taking into account the effects with a higher
impact on the overall QoS. Therefore, layer i (Li)
provides a set of performance indicators to the layer
above (i + 1), and successively, up to the application
layer (see Figure 1).
Without loss of generality, the following
performance indicators are considered as the most
relevant and are provided at each protocol layer:
Transmission rate (R
Li
): defines the amount of
data correctly transferred at layer i in a given time
(in bits per second). The transmission rate will vary
at each layer due to different factors, such as
protocol headers, packet loss rate, number of
retransmissions, etc.
Delay (D
Li
): represents the average time (in
seconds) that a data unit (at layer i) takes to be
transported from peer to peer. The delay is a very
important indicator for real-time services and also
for those services that use reliable and congestion-
aware protocols like Transmission Control Protocol
(TCP).
Loss rate (P
Li
): represents the loss rate of data
units at layer i. This loss rate may be due to errors at
the radio interface or data losses at network queues.
In general, the impact of data losses can be
minimized by applying correction techniques and/or
retransmissions at different levels. However, a high
loss rate will produce a large number of
retransmissions, which reduces the effective
information transmission rate.
eNodeB
UE
Server
eNodeB
L2/L1
L1
L2a
L2b
L2c
L3
L4
L5
{R,D,P}
L5
{R,D,P}
L4
{R,D,P}
L3
{R,D,P}
L2b
{R,D,P}
L2c
Application -
Transport -
Network -
Link
Physical -
MAC
RLC
PHY
S-GW
P-GW
S
-GW
L2/L1
GTP-U
GTP-U
L2/L1
GTP-U
P-GW
IP
{R,D,P}
L2a
{R,D,P}
L1
U
E
TCP / UDP
PHY
IP
RLC
MAC
PDCP
HTTP, etc.
Server
L2/L1
IP
TCP / UDP
HTTP, etc.
PDCP
Figure 1: Scenario and protocol stack under analysis.
QualityofExperienceEvaluationforDataServicesoverCellularNetworks
389

The final model is composed of a set of
deterministic equations starting from the RLC level
up to the application level, where performance
indicators at layer i are analytically derived as a
function of the performance indicators at layer i-1.
The specific equations that model each layer along
the protocol stack is out of the scope of this paper,
although further details can be found in a previous
work from one of the authors (Gómez et al., 2010b),
and a brief summary of the main aspects affecting
the QoS at each layer is described in Table 1.
Table 1: Summary of the main aspects affecting the QoS.
Layer Impact on QoS
Application The application layer mainly includes the
signaling or request/response messages
associated to each particular data service.
Transport The most problematic transport protocol over
wireless networks is TCP. Congestion and flow
control mechanisms included by TCP have a
very negative impact on the throughput and
delay, especially for high Round Trip Times
(RTTs) and loss rate.
Network The main aspects affecting the QoS are related
to the network RTT and packet loss rate along
the end-to-end path.
Link PDCP The main impact of PDCP layer on the QoS is
due to the use of robust header compression
(ROHC), whose gain will be higher as the
packet size decreases.
RLC It is responsible for the segmentation and
reassembly of upper layer data units and,
additionally, for performing optional selective
retransmissions. Thus, the error rate can be
lowered by means of retransmissions at the
expense of decreasing the throughput and
increasing the average delay and jitter.
MAC The MAC layer at the access node allocates
channels to users on a subframe basis; that is,
for each new subframe, the system assigns
available physical channels to users according
to a scheduling policy.
Physical
(PHY)
Defines the physical channels structure through
which the information will be transported.
In this paper we use PHY/MAC link level
simulations associated to a LTE network to obtain
MAC level performance results under specific
configuration (as described in section 3). Such
results at the MAC layer are then mapped into
performance results at each layer above up to the
application layer. Anyhow, MAC layer results from
simulations could be replaced by network operator
statistics generally available at their OSS database.
2.2 Quality of Experience Evaluation
The final goal of this end-to-end model is to evaluate
the application level QoS, which will be later
mapped into QoE (in terms of MOS value), as
shown in Figure 2. This last process is proposed to
be performed by means of utility functions
associated to each particular service. The goal of the
utility functions is to map objective measurements
(in terms of QoS) into subjective metrics (in terms of
QoE perceived by the user).
Figure 2: Bottom-up approach to evaluate the QoE.
This mapping process shall consider the specific
characteristics of each data service:
Web browsing: the most important objective
parameter to estimate the MOS in a web browsing
session is the service response time D
L5
. The utility
function that estimates the MOS as a function of D
L5
(in seconds) is given by (Ameigerias, 2010):
2
5
578
MOS 5
22.61
1 11.77
L
D
=−
⎛⎞
++
⎜⎟
⎝⎠
(1)
Video YouTube: among the various works
devoted to estimate the MOS for video services
(Mok et al., 2011); (Porter and Peng, 2010); (Ketykó
et al., 2010), the analysis presented by Mok et al.
(2011) provides a utility function for HTTP video
streaming as a function of three application
performance metrics: initial buffering time T
init
(time
elapsed until certain buffer occupancy threshold has
been reached so the playback can start, measured in
seconds), mean rebuffering time T
rebuf
(average
duration of a rebuffering event, measured in
seconds) and re-buffering frequency f
rebuf
(frequency
of interruption events during the playback, measured
in seconds
-1
). The final MOS expression is given by:
MOS 4.23 0.0672 0.742 0.106
init rebuf rebuf
Tf T
=
−−−
(2)
Note that these application layer metrics (T
init
, T
rebuf
,
f
rebuf
) can be estimated (at the receiver) from
WINSYS2012-InternationalConferenceonWirelessInformationNetworksandSystems
390

performance indicators at lower layers (like the TCP
throughput) provided by the end-to-end model
(described in section 2.1) as well as other
configuration parameters like video coding rate or
buffer size at the receiver.
Skype-based VoIP: in this case the MOS
formula just maps the result given by an
intermediate model into normalized MOS values.
This intermediate model, known as the E model, is
specified in ITU-T G.107 (2009) and it provides a
numerical estimation R∈[0, 100] of the voice quality
from a set of network impairment factors related
with the Signal to Noise Ratio (SNR) of the
transmission channel, delay, distortions introduced
by the coding/decoding algorithms, packet losses,
etc. Cole and Rosenbluth (2001) provides a
simplification of the E-model, particularizing it for
VoIP communications, where the voice quality R is:
(
)
94.2 0.024 0.11 177.3 ( 177.3)
eeff
R
dd Hd IA
−
=− ⋅−⋅− ⋅− −+
being
d the end-to-end delay in milliseconds, I
e-eff
the
effective equipment impairment factor, H(x) the unit
step function, and A the correcting factor, which
takes into account the environment where the
communication takes place. Besides, ITU-T G.113
(2007) provides a formula to translate the R value
into MOS:
(
)
(
)
6
MOS 1 0.035 60 100 7 10RRR R
−
=+ ⋅ + ⋅ − ⋅ − ⋅⋅
(3)
The impairment factors, in turn, depend on the
specific codec used for the VoIP communication; the
values of these factors for a number of codecs are
tabulated in ITU-T G.113 (2007) and its amendment
1 (2009).
3 PERFORMANCE RESULTS
In this section, a set of performance figures are
shown for web browsing, video YouTube and
Skype-based VoIP over a LTE cellular network.
Radio performance indicators (at PHY/MAC layers)
have been obtained from a dynamic link level LTE
simulator (Gómez et al., 2010a), whose main
configuration parameters are listed in Table 2.
Average throughput results (per user) at the
MAC layer as a function of the received average
SNR are shown in Figure 3. Assuming an average
SNR of 20 dB, a user would be able to achieve
around 4 Mbps considering that the radio resources
are shared among 10 users. Regarding the BLER and
delay at the MAC layer (not shown in the figure),
they have been also obtained from simulations,
whose values are: BLER ≈ 5%, delay
MAC
≈ 15 ms.
The following sections will use MAC layer results
as a baseline for upper layer performance estimation.
Table 2: PHY/MAC configuration parameters.
Parameter Value
Carrier frequency 2 GHz
System bandwidth 20 MHz
Duplexing scheme FDD
Resource block (RB) BW 180 KHz
Subcarriers per RB 12
Sub-frame duration 1 ms
Antenna configuration 1-layer MIMO 2x2
Precoding LTE 4-words codebook
Power delay profile Extended pedestrian A channel
UE speed 4 km/h
Channel estimation Zero-Forcing
MIMO Detection MMSE
Target BLER 10%
Control channel overhead From 1 to 3 OFDM symbols
Modulation / coding rate 16 CQI table (4bits)
Coding scheme Turbo codes + SOVA
CQI & PMI delay 1 ms
CQI reporting period 1 ms
HARQ model Incremental Redundancy + Chase
Combining
# stop and wait processes 8
Scheduling method Proportional Fair
Averaging window size 500 ms
Number of users 10
Source model Full buffer
Figure 3: Average throughput at the MAC layer vs SNR.
3.1 Web Browsing
The Web service architecture uses a client-server
approach in which the exchange of information is
done via HTTP/TCP. HTTP version 1.1 has been
assumed in the analysis. This version includes the
persistent connection feature, which makes it
possible to reuse the same TCP connection for
downloading subsequent objects. The pipelining
QualityofExperienceEvaluationforDataServicesoverCellularNetworks
391

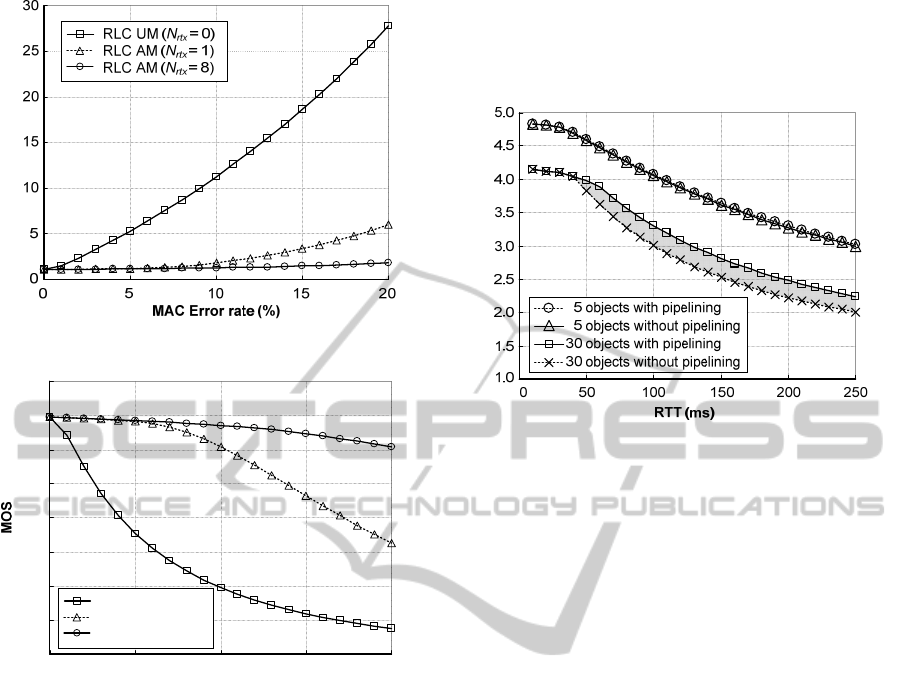
Figure 4: Performance evaluation at each protocol layer (web browsing).
feature have been also assumed, thus allowing a
number of object requests to be sent without waiting
for the reception of the previous object.
Figure 4 shows a performance analysis at each
protocol layer of the web browsing service, starting
from the MAC layer results described in previous
section. A web page consisting of 100kB text and 15
secondary objects whose individual average size is
20kB has been considered (400kB page size). It is
assumed that all the objects and text are located in
the same web server, so that all the data transfers
will run on top of the same TCP connection.
Regarding TCP configuration, the following
settings have been used: maximum segment size
MSS = 1460 bytes, initial congestion window
W
init
= 1 segment, advertised window from the
receiver AWND = 32 kbytes, number of ACKs per
transmitted segment b = 1, and SYN timeout T
s
= 3s.
Results shown in Figure 4 provide a detailed
analysis of the performance achieved at each
protocol layer (in terms of throughput, delay and
loss rate). Let us analyze the performance in a
bottom-up approach, starting from the MAC layer
(obtained from simulations) up to the application:
MAC error rate can be lowered by means of
RLC level retransmissions (ARQ protocol). The
graph shows the results for two different values of
the maximum number of RLC retransmissions (N
rtx
):
1 and 8. Results show that higher N
rtx
values make it
possible to reduce the error rate at the expense of
decreasing the effective throughput and increasing
the delay at RLC layer. However, when TCP is used
at transport layer, it is highly recommended to
decrease the error rate at lower layers so that end-to-
end retransmissions are avoided.
PDCP layer does not apply header compression
in this scenario, so its impact on the performance
indicators only comes from the PDCP header
overhead.
At the IP layer, the delay from the base station to
the web server is assumed to be 5ms whereas the
packet loss rate is negligible compared to the radio
interface (the main focus of the analysis is given to
the impact of the radio interface on upper layers).
TCP behavior is very sensitive to IP loss rate, as
its congestion control protocol tries to adapt the
instantaneous transmission rate to the network
characteristics in order to provide reliability, i.e. loss
rate zero. In that sense, if IP loss rate is minimized at
the radio interface by means of a higher number of
local retransmissions (e.g. N
rtx
= 8), TCP will be able
to achieve higher average sending rates;
additionally, in that situation, average TCP delay is
also reduced as the number of end-to-end TCP
retransmissions is decreased.
At application layer, HTTP delay results
represent the complete “click-to-download” time of
the whole web page, including: DNS query, TCP
connection establishment, text and secondary objects
request and download.
From previous analysis, it is important to highlight
the impact of the loss rate on TCP performance. For
that reason, the reliability of lower layers is an issue
when the radio conditions are poor.
The results associated to the web page
downloading time (D
L5
) and MOS, computed from
Eq. (1), for different MAC error rate values are
shown in Figures 5 and 6. Three different RLC
configurations have been evaluated:
Unacknowledged Mode (UM), which does not
perform any retransmissions, and Acknowledged
Mode (AM) with 1 and 8 as maximum number of
retransmissions (N
rtx
). As shown, the difference
between RLC transmission modes increases for
higher error rates, being AM with N
rtx
= 8 the best
performing configuration since it provides a MOS >
4 (Good) up to 20% of MAC error rate .
WINSYS2012-InternationalConferenceonWirelessInformationNetworksandSystems
392
Web page downloading time (s)
Figure 5: Web page downloading time and MOS.
1.0
1.5
2.0
2.5
3.0
3.5
4.0
4.5
5.0
0 5 10 15 20
MAC Error Rate (%)
RLC UM (N
rtx
= 0)
RLC AM (N
rtx
= 1)
RLC AM (N
rtx
= 8)
Figure 6: MOS results for web browsing service.
Figure 7 shows the MOS results for different
network RTTs and different number of secondary
objects in the web page. Firstly, long RTTs lead to a
worse TCP performance (in terms of throughput) as
a consequence of its inherent congestion control
mechanisms based on a transmission window (both
during slow start and steady state phases). Such
throughput reduction has a direct impact on the web
page downloading time and MOS. Secondly, a
higher number of objects in the web page (assuming
equal sizes) leads to longer downloading times. This
behavior may be enhanced by using pipelining
feature, which provides higher gains as the number
of objects is increased. Pipelining can be achieved to
different extents depending on how the request-
sending is scheduled on the client’s browser. In the
figure, a totally pipelined scenario is assumed, i.e.
all the object requests are sent in parallel. If a lower
number of parallel requests is configured at the
browser, the results would be located between both
curves (shadowed area in the graph). If we compare
the results between 5 and 30 secondary objects (i.e.
200kB and 700kB including the text), it can be
concluded that much shorter RTTs are required to
keep the same MOS (e.g. 110ms and 40ms,
respectively to achieve good performance: MOS=4).
MOS
Figure 7: MOS (web browsing) for different RTT.
3.2 Youtube
YouTube service is based on progressive download
technique, as explained by Gill et al. (2007), which
enables the video playback before the content
download is completely finished. As data is being
downloaded, the video content is temporarily stored
in a buffer at the client side, thus enabling the video
playback before having the complete video file. This
technique is based on HTTP/TCP, i.e. the client
sends an HTTP request and, as a consequence, the
YouTube multimedia server delivers the requested
video through an HTTP response over TCP. The
process of downloading the video content from
YouTube multimedia server consists of two phases:
initial burst (in which data are sent as fast as
possible using the whole available bandwidth) and
throttling algorithm (in which data are sent at a
constant rate related with the video coding rate).
Once the video playback has started (which implies
that the buffer has certain data to be consumed), if a
network congestion episode takes place, the data that
are not able to be delivered (from the server) at this
constant rate will be later transmitted at the
maximum available bandwidth as soon as the
congestion is alleviated. This circumstance could
trigger a rebuffering event if the client buffer runs
out of data. In this case the video playback will be
paused until the data buffer is restored. Otherwise,
the rebuffering event will be avoided and the
congestion will be seamlessly elapsed to the user.
Figure 8 depicts the results of the application
performance metrics for YouTube (defined in
QualityofExperienceEvaluationforDataServicesoverCellularNetworks
393
section 2.2) as a function of the network RTT for a
particular RLC transmission mode (AM with N
rtx
= 8
retransmissions). The following application settings
have been used: video length = 250s, client data
buffer necessary to start the playback B
full
= 32s,
buffer threshold that triggers a rebuffering event
B
empty
= 2s, and video coding rate = 512kbps.
Regarding TCP settings, the same configuration as
defined for web browsing have been considered.
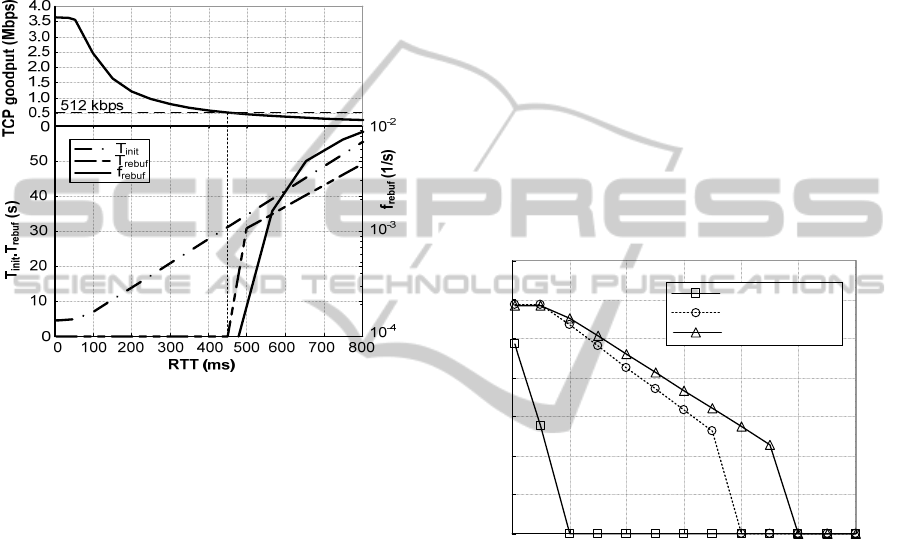
Figure 8: Application Performance Metrics for YouTube
as a function of RTT (RLC AM, N
rtx
=8).
The upper graph in Figure 8 represents the
achievable average TCP goodput (Padhye et al.,
1998) for the specified TCP configuration, network
RTT and loss rate (≈2·10
-12
as shown in Figure for
web browsing). So if the average TCP goodput is
higher than the video coding rate (512kbps), then no
rebuffering events will take place. As the RTT is
increased, the TCP goodput is decreased until it
becomes lower than the video coding rate at certain
RTT value; from this RTT value and above, the
parameters related to the rebuffering events (T
rebuf
and f
rebuf
) are higher than zero (as shown in the lower
graph). The initial buffering time (T
init
) is also
increased for higher RTTs since lower TCP goodput
values lead to longer delays to reach the minimum
buffer occupancy (B
full
). The rebuffering time (T
rebuf
)
has the same behavior, although it is null as long as
TCP goodput is above the video coding rate (i.e. no
rebufferings occur). Besides, it can be seen that
T
rebuf
< T
init
for the same RTT value due to the
following reasons: 1) the amount of data needed to
be filled (B
full
) for the computation of T
init
is greater
than the amount of data (B
full
- B
empty
) required for
the computation T
rebuf
; and 2) the computation of T
init
assumes that TCP data transfer start with a slow start
phase whereas the computation of T
rebuf
considers
the TCP steady state to be reached (being the TCP
goodput higher in this second phase).
Figure 9 shows the MOS results, from Eq. (2),
for different RTTs and RLC transmission modes. As
mentioned above, for low RTT values (which
achieve TCP goodput values higher than the video
coding rate), the initial buffering time is the only
metric affecting the MOS (the higher the T
init
, the
lower the MOS). When the rebuffering events start
to take effect over the MOS, its value is rapidly
decreased, since interruptions over the playback are
annoying for the users. As shown in Figure 8, MOS
results could be improved by selecting a proper RLC
transmission mode: MOS values are higher for RLC
AM mode than for UM mode. It can also be seen
that the minimum RTT value that triggers
rebuffering events is higher when the AM mode is
selected, and even further for a larger number of
RLC retransmissions.
1.0
1.5
2.0
2.5
3.0
3.5
4.0
4.5
0 100 200 300 400 500 600
RTT (ms)
MOS
RLC UM (N
rtx
= 0)
RLC AM (N
rtx
= 1)
RLC AM (N
rtx
= 8)
Figure 9: YouTube MOS results for different RTTs and
RLC transmission modes.
3.3 Skype
In this section, the performance of a Voice over IP
(VoIP) service using Skype is analyzed. Skype
usually relies on UDP as transport layer, unless the
UDP communication is unfeasible, in which case
Skype would fall back to TCP. We will focus on the
usual Skype behavior over UDP. This section is
focused on the E2E communication (i.e. between
two Skype clients). The codec used by the software
has a big impact on the service performance, being
SILK the codec currently supported for E2E
communications (since version 4.0). This codec has
a set of coding rates from 6kbps to 40kbps. Due to
the low data rates that a VoIP flow usually needs,
throughput requirements at the network side are not
WINSYS2012-InternationalConferenceonWirelessInformationNetworksandSystems
394
usually an issue for Skype service. Instead, the
network performance indicators mostly affecting the
service quality are: loss rate and end-to-end delay.
The following MOS results have been obtained,
from Eq (3), for medium and low voice coding rates,
considering an A factor value according to a cellular
communication inside a building (see section 2.2).
The impairment factor associated to this scenario has
been obtained from ITU-T G.113 (2007) for the
selected voice codecs. Taking into account the
characteristics of the VoIP traffic, a Robust Header
Compression (RoHC) mechanism has been applied
at the PDCP layer. In addition, the RLC UM mode
has been selected in order to minimize the end-to-
end delay, which is the application layer metric that
mostly affects the MOS.
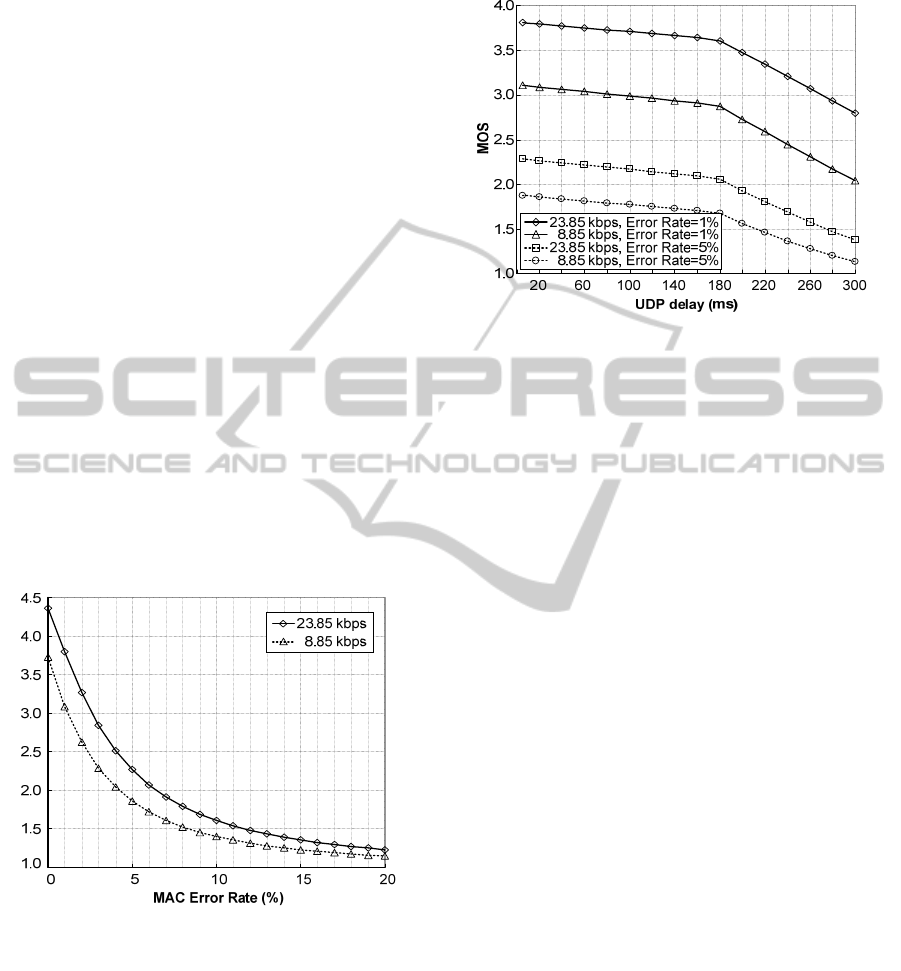
Figure 10 shows the MOS results (for different
voice coding rates) as a function of the MAC error
rate at the radio interface. As the RLC UM mode has
been assumed in this case, potential data errors have
a very negative impact on the voice quality.
Concretely, fair quality (MOS > 3) is achieved for
MAC error rate below 2.5% (for 23.85 kbps) and 1%
(for 8.85 kbps). In order to solve this problem,
stricter target BLER values are recommended to be
configured at the physical layer so that more robust
coding schemes are applied.
MOS
Figure 10: MOS for Skype for different MAC error rates.
Figure 11 shows the MOS results as a function of
the end-to-end UDP delay, which has a lower impact
on the MOS (for the range of typical delay values)
than the error rate. Furthermore, it can be observed
that when using default MAC error rate results (5%),
MOS results are always poor (i.e. below 3) even for
negligible end-to-end delays. If 1% error rate is
considered at the MAC layer, maximum end-to-end
delays that makes it possible to obtain a fair quality
are around 100 ms (for 8.85kbps) and 270 ms (for
23.85kbps).
Figure 11: MOS for Skype depending on the UDP delay.
4 CONCLUSIONS
This paper presents a QoS and QoE performance
evaluation method for data services over cellular
networks. In particular, a bottom-up performance
analysis have been proposed for evaluating the
application layer metrics whereas a set of service-
specific utility functions have been used to estimate
the MOS for web browsing, video YouTube and
VoIP-based on Skype. The methodology here
proposed makes it possible to identify the sources of
performance degradation along different elements
and protocols in addition to the end-users’
experienced quality. Additionally, this approach
provides the following advantages: 1) it makes it
possible to predict the QoE when measurements in
real network are not available; 2) it is applicable to
any service and wireless network, simply by
providing appropriate models; 3) services and
networks under analysis do not necessarily require
being up and running.
Performance results for web browsing show the
great impact of the network loss rate on TCP
performance, thus a proper configuration at the radio
protocols is a key issue to improve the QoE;
additionally, the network RTT is also a critical
performance indicator, which subtracts ≈1 point
from the MOS scale with each additional 100ms. In
the case of YouTube, results are very dependent on
the video coding rate and network metrics (RTT and
loss rate); our performance estimations show that
fair quality (MOS > 3) can be obtained for RTTs
below 200ms when an RLC AM is configured.
Finally, Skype results show the great influence of
the voice coding rate and error rate on the MOS as
QualityofExperienceEvaluationforDataServicesoverCellularNetworks
395

the RLC UM is usually configured for VoIP. End-to-
end delay also plays an important role in Skype
performance, whose maximum admissible value
depends on the coding rate and error rate in the
network (as an example, a maximum delay of 100ms
is admissible for 8.85kbps and 1% MAC error rate).
ACKNOWLEDGEMENTS
This work has been partially supported by the Junta
de Andalucía (Proyectos de Excelencia P07-TIC-
03226 and TIC-06897) and by the Spanish
Government (TEC2010-18451).
REFERENCES
Ameigeiras, P., Ramos-Munoz, J.J., Navarro-Ortiz, J.,
Mogensen, P., Lopez-Soler, J.M. (2010). QoE oriented
cross-layer design of a resource allocation algorithm in
Beyond 3G systems. Computer Communications,
33(5), 571-582. doi: 10.1016/j.comcom.2009.10.016.
Cole, R. G., Rosenbluth, J. H. (2001). Voice over IP
performance monitoring. ACM SIGCOMM Computer
Communication Review, 31(2). doi:
10.1145/505666.505669.
De May, O., Schumacher, L., Dubois, X. (2005).
Optimum Number of RLC Retransmissions for Best
TCP Performance in UTRAN. IEEE 16th
International Symposium on Personal, Indoor and
Mobile Radio Communications (PIMRC). 1545-1549.
doi: 10.1109/PIMRC.2005.1651703.
Gill, P., Arlitt, M., Li, Z., Mahanti, A. (2007). YouTube
Traffic Characterization: A View From the Edge. 7th
ACM SIGCOMM conference on Internet
measurement. doi: 10.1145/1298306.1298310.
Gómez, G., Morales-Jiménez, D., Sánchez-Sánchez, J.J.,
Entrambasaguas, J.T. (2010a). A Next Generation
Wireless Simulator Based on MIMO-OFDM: LTE
Case Study. EURASIP Journal on Wireless
Communications and Networking. doi:
10.1155/2010/161642.
Gómez, G., Poncela González, J., Aguayo-Torres, M.C.,
Entrambasaguas Muñoz, J.T. (2010b). QoS Modeling
for End-to-End Performance Evaluation over
Networks with Wireless Access. EURASIP Journal on
Wireless Communications and Networking; Article ID
831707. doi: 10.1155/2010/831707.
Gustafsson, J., Heikkila, G., Sandberg, P. (2010). Method
of determining Quality of Service for on-line gaming
in a network. Patent Application, Publication number:
US 2010/0273558 A1.
Luo, H., Ci, S., Wu, D., Wu, J., Tang, H. (2010). Quality-
driven cross-layer optimized video delivery over LTE.
IEEE Communications Magazine, 48(2), 102-109. doi:
10.1109/MCOM.2010.5402671.
ITU-T amendment 1 for recommendation G.113. (2009).
Amendment 1: revised appendix IV – provisional
planning values for the wideband equipment
impairment factor and the wideband packet loss
robustness factor.
ITU-T recommendation G.107 (2009). The E-model, a
computational model for use in transmission planning.
ITU-T recommendation G.113. (2007). General
recommendations on the transmission quality for an
entire international telephone connection.
Ketykó, I., Moor, K., Pessemier, T., Verdejo, A.,
Vanhecke, K., Joseph, W., Martens, L., Marez, L.
(2010). QoE measurements of Mobile YouTube video
streaming. 3rd Workshop on Mobile Video Delivery
(MoViD’10). doi: 10.1145/1878022.1878030.
Lassila, P., Kuusela, P. (2008). Performance of TCP on
low-bandwidth wireless links with delay spikes.
European Transactions on Telecommunications, 19,
653-667. doi: 10.1002/ett.1207.
Lee, W., Lee, M., McGowan, J. (2009). Enhancing
objective evaluation of speech quality algorithm:
current efforts, limitations and future directions.
European Transactions on Telecommunications, 20,
594-603. doi: 10.1002/ett.1334
Mok, R.K.P., Chan, E.W.W., Chang, R.K.C. (2011).
Measuring the Quality of Experience of HTTP video
streaming.
12th IFIP/IEEE International Symposium
on Integrated Network Management (IFIP/IEEE IM).
Padhye, J., Firoiu, V., Towsley, D., Kurose, J. (1998).
Modeling TCP Throughput: A Simple Model and its
Empirical Validation. ACM SIGCOMM Computer
Communication Review, 28(4), 303-314.
Piamrat, K., Singh, K.D., Ksentini, A., Viho, C., Bonnin,
J.M. (2010). QoE-Aware Scheduling for Video-
Streaming in High Speed Downlink Packet Access.
IEEE Wireless Communications and Networking
Conference (WCNC). doi:
10.1109/WCNC.2010.5506102.
Porter, T., Peng, X. (2011). An objective approach to
measuring video playback quality in lossy networks
using TCP. IEEE Communications Letters, 15(1), 76-
78. doi: 10.1109/LCOMM.2010.110310.101642.
WINSYS2012-InternationalConferenceonWirelessInformationNetworksandSystems
396
