
Optimal Control Strategy of NG Piston Engine as a DG Unit Obtained by
an Utilization of Artificial Neural Network
Jaroslaw Milewski, Lukasz Szablowski, Jerzy Kuta and Wojciech Bujalski
Institute of Heat Engineering, Warsaw University of Technology, Warsaw, Poland
Keywords:
Artificial Neural Network, Control Strategy, Distributed Generation, Internal Combustion Engine.
Abstract:
The paper presents a control strategy concept of a piston engine fueled by Natural Gas as a DG unit obtained
by using an Artificial Neural Network. The control strategy is based on several factors and directs the oper-
ation of the unit in the context of changes occurring in the market, while taking into account the operating
characteristics of the unit. The control strategy is defined by an objective function: for example, work at max-
imum profit, maximum service life, etc. The results of simulations of the piston engine as a DG unit at chosen
loads are presented. Daily changes in the prices of fuel and electricity are factored into the simulations.
1 INTRODUCTION
Rising fuel prices combined with an upward trend in
electricity consumption are providing strong incen-
tives for research into systems that boost generation
efficiency.
An electricity distribution system based on a net-
work of small, interconnected sources is character-
ized by both load variability and changing electricity
prices. This means that the sources will have to adapt
to the load not only for local changes, but also as it re-
lates to the market balance between buyers and sellers
of power to the grid and changes in fuels markets.
The DG system has many advantages, including
very high certainty of supply, high efficiency power
generation (both electricity and cogeneration) and
high adaptability to changes in demand (both daily
and annual). The DG system can be compared in its
essence and mode of operation to the Internet or to
mobile networks.
In (Wang et al., 2004) sources that can oper-
ate as a distributed source were classified: (i) Re-
ciprocating engines; (ii) Gas turbines (Jagaduri and
Radman, 2007); (iii) Stirling engines (Corria et al.,
2006); (iv) Combination systems based on gas tur-
bines (Tarroja et al., 2008) and reciprocating en-
gines; (v) Small hydro, wind power; (vi) Photovoltaic
systems (Maine and Chapman, 2007); geothermal
power plants (Al-Sulaiman et al., 2010); (vii) Fuel
cells (Hajimolana et al., 2011; Kupecki and Badyda,
2011); and (viii) Systems using: biomass (Milewski
and Lewandowski, 2009; Lanzini et al., 2010;
Budzianowski, 2011) and waste, tides, currents,
waves and warm seas.
Most available studies almost exclusively concern
the issues of electrical and electronic collaboration
between the DG source and the power system (Wang
et al., 2004). The time periods considered there are
below 1 second. The proposed variants are closely re-
lated to the network source (e.g. through an interme-
diate network of DC). Issues are also dealt with the
same power grid work (Paatero et al., 2002) includ-
ing the determinants of transmission. The behavior
of the power grid of connected sources distributed in
emergency situations (Rodriguez et al., 2007) also on
electrical issues was also analyzed.
Control of multiple DG sources via the Internet
was subject to study (Sonderegger, ), which also took
into account the economic aspects of making sources
work together. A simulator running in real mode was
created (Ocnasu et al., 2008) to analyze power source
co-operation with the network, but it only studied
electric co-operation with the network source. An an-
alyzed time frame of less than 100 micro seconds was
concerned. Analyses of the work of the same sources
from the standpoint of efficiency and power were also
carried out, as well as opportunities to work in co-
generation (Milewski et al., 2005). There were at-
tempts to use artificial intelligence to predict the safe
operation of sources involved in the distributed sys-
tem (Rezaei and Haghifam, 2008).
The Artificial Neural Network (ANN) can be ap-
plied to simulate an object’s behavior without an algo-
rithmic solution merely by utilizing available experi-
171
Milewski J., Szablowski L., Kuta J. and Bujalski W..
Optimal Control Strategy of NG Piston Engine as a DG Unit Obtained by an Utilization of Artificial Neural Network.
DOI: 10.5220/0004029401710176
In Proceedings of the 9th International Conference on Informatics in Control, Automation and Robotics (ICINCO-2012), pages 171-176
ISBN: 978-989-8565-21-1
Copyright
c
2012 SCITEPRESS (Science and Technology Publications, Lda.)

mental data . Simultaneously, the ANN can make the
model more general, which means that model gives
accurate results for data other than that used in train-
ing processes.
The “black box” model, based on ANN, generates
an answer immediately after input data are obtained.
The ANN-based model can predict the object behav-
ior based merely on the available experimental data
taken from experimental investigations. The model
can generalize the object behavior for both inter- and
extra-polations without knowladge of the physical re-
lationships (Chaichana et al., 2012).
In (Beccali et al., 2004) a model was proposed to
predict the load for 24 hours based on weather data
(temperature, relative humidity, total solar radiation).
The model was trained on historical data for parts of
the electricity grid in Palermo (Italy) during the period
2001–2003. The average prediction error for this case
was 1.97%. In turn, (Azadeh et al., 2007) shows an
integrated genetic algorithm (GA) and artificial neu-
ral network used to predict electricity consumption in
the Iranian agriculture sector. The genetic algorithm
was tested on data from 1981 to 2005, while the ar-
tificial neural network was used to predict electricity
consumption to 2008. An algorithm was presented
in (Azadeh et al., 2008) based on an artificial neu-
ral network, and was used to predict monthly electric-
ity consumption in Iran from March 1994 to February
2005.
A hybrid model was presented in (Amjady and
Keynia, 2009) to predict hourly electrical load us-
ing the wavelet transform (WT), neural network and
evolutionary algorithm (EA). The model created in
this way was tested on data for New York for 1 July
2004, yielding an average prediction error of 2.06%.
In (Kavaklioglu et al., 2009) a model was presented
that used artificial neural networks to predict electric-
ity consumption in Turkey. The inputs to the model
were economic indicators such as gross national prod-
uct, population and import and export. The second
version of the model only had to input the ratio of im-
ports to exports and time. The result of this work was
a prediction of electricity consumption in Turkey un-
til the year 2027 using data from 1975 to 2006, along
with the previously mentioned economic factors.
In contrast to previous examples in (Adam et al.,
2011) an artificial neural network was used to pre-
dict the input data (gross domestic product – GDP,
temperature, hours of sunshine and humidity) to a
model which forecasts peak electrical load in Mauri-
tius using NHGDP method (non-homogeneous Gom-
pertz diffusion process).
In (Cai et al., 2011) a neural network was pre-
sented that was based on adaptive resonance theory
Table 1: Specification of LVHUAN LHM80 engine.
Parameter Value (prime/standby)
Rated power, kW 64/80
Rated speed, RPM 1500/1800
Heat consump-
tion, MJ/kWh
≤9.8 (η=0.367)
called a distributed ART and HS-ARTMAP (Hyper-
spherical ARTMAP) network to predict electricity
load.
As we can see from literature data, the problem
with load or demand for electricity forecasting has
been pretty well researched, but the ways of using
such information for devices working in a distributed
generation system have not been analyzed.
2 THEORY
2.1 Piston Engine
Stationary piston engine LHM80 made by the Chi-
nese company LVHUAN was an analyzed source.
Specification of that unit was shown in Table 1.
Changes in the efficiency of the engine (Mephisto
engines (http://www.kwk.info, 2012)) during load
changes can be approximated by the following rela-
tionship:
η
rel
= 1.2484 · P
3
rel
− 3.0771 · P
2
rel
+ 2.8448 · P
rel
(1)
where: η
rel
– relative engine efficiency, P
rel
– rel-
ative power.
Engine efficiency at the actual load is obtained by
multiplying nominal electrical efficiency by relative
efficiency.
2.2 Artificial Neural Networks
An ANN is a black-box model which produces certain
output data as a response to a specific combination of
input data. The ANN can be trained to learn the inter-
nal relationships and predict system behavior without
any physical equations. The ANN consists of neu-
rons gathered into layers. Information is delivered to
the neurons by dendrites and the activation function is
realized (by the nucleus). Then, modified information
is transferred forward by the axon and synapses (see
Fig. 1) to other neurons.
In this study, a hyperbolic tangent sigmoid transfer
function was used as the neuron activation function in
the first layer, whereas a linear transfer function was
used in the output layer (see Fig. 2).
During the model calculations, information pro-
ceeds step by step from the first layer to the last one.
ICINCO2012-9thInternationalConferenceonInformaticsinControl,AutomationandRobotics
172
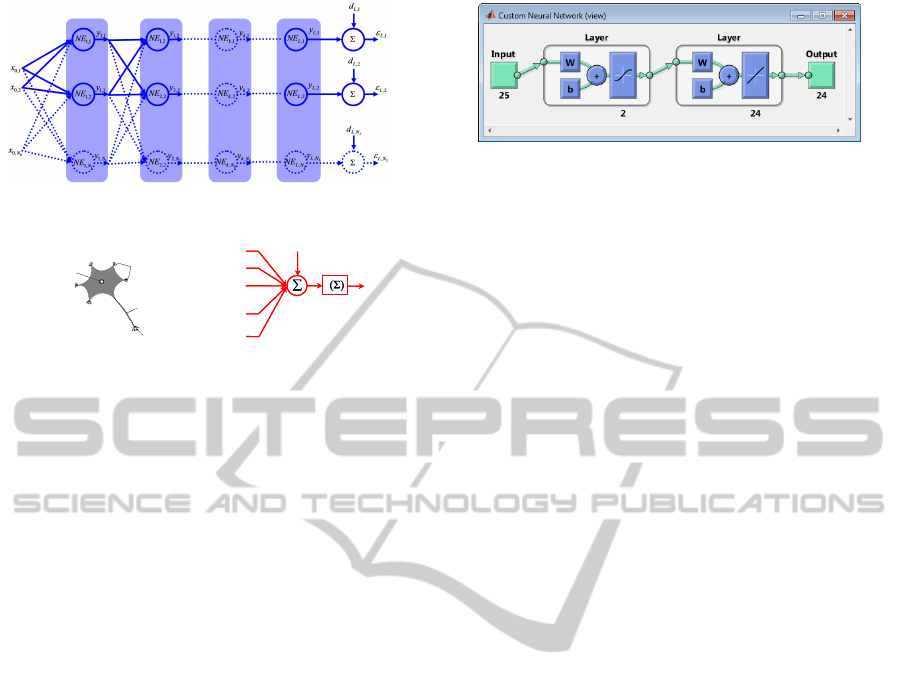
Figure 1: Artificial Neural Network model.
a)
axon
dendrites
synapses
nucleus
axon
dendrites
synapses
nucleus
b)
, ,1
k i
w
,1
k
x
,2
k
x
,3
k
x
,
k j
x
1
,
k
k N
x
−
, ,2
k i
w
, ,3
k i
w
, ,
k i j
w
1
, ,
k
k i N
w
−
,0
1
k
x
=
, ,0
k i
w
f
,
k i
y
, ,1
k i
w
,1
k
x
,2
k
x
,3
k
x
,
k j
x
1
,
k
k N
x
−
, ,2
k i
w
, ,3
k i
w
, ,
k i j
w
1
, ,
k
k i N
w
−
,0
1
k
x
=
, ,0
k i
w
f
,
k i
y
Figure 2: Neuron scheme (a) and its mathematical model
(b) (Demuth et al., ).
The answers of the neurons in the last layer are the
output parameters of the ANN model (see Fig. 1).
Backpropagation was chosen as the learning pro-
cess of the ANN. Backpropagation is the generaliza-
tion of the Widrow-Hoff learning rule to multiple-
layer networks and nonlinear differentiable transfer
functions. A detailed description of backpropagation
can be found in (Demuth et al., ).
Commercially available software (Demuth et al., )
was used for the ANN calculations. The Levenberg-
Marquardt algorithm was used to accelerate the train-
ing procedure. An overly complex network can be
trained with extraordinary accuracy, which means that
the network becomes noise dependent (overfitting).
Overfitting means the network has memorized the
training examples, but has not learned to generalize
to new situations. To improve network generaliza-
tion a network can be used that is just large enough
to provide an adequate fit. The simplest architec-
ture of the network was found in each case to avoid
overfitting. If a small enough network is used, it has
insufficient power to overfit the data. Further, opti-
mal regularization parameters were applied in auto-
mated fashion (Bayesian). This approach does not re-
quire dividing the database into two parts: training
and testing. Bayesian regularization makes a model
generalized, which is the main advantage of apply-
ing this algorithm to the network teaching process.
This means that the model can be validated by the
same batches of data. The weights of the network
were assumed to be random variables with specified
distributions. The regularization parameters are re-
lated to the unknown variances associated with these
distributions. Estimation of these parameters can be
made using statistical techniques. A detailed discus-
sion of the use of Bayesian regularization, in com-
Figure 3: Model of artificial neural network (25–2–24) in
MATLAB.
bination with Levenberg-Marquardt training, can be
found in (Foresee and Hagan, 1997). When using
Levenberg-Marquardt training with Bayesian regular-
ization, it is important to let the algorithm run un-
til the effective number of parameters has converged.
The training was stopped by the message “Maximum
MU reached.” This is typical, and is a good indication
that the algorithm has truly converged. A detailed ex-
planation of the training algorithm parameters can be
found in (Demuth et al., ).
The network architecture is indicated in the fol-
lowing way: “number of inputs – number of neurons
in the first layer – number of neurons in the second
layer”; e.g. 9-7-1 means that the two-layer network
consists of nine inputs, seven neurons in the first layer
and one neuron in the second layer (the number of
neurons in the last layer equals the number of out-
puts).
2.3 Construction of Chosen Variants of
ANN
Based on the performed analysis, it has been found
that the most appriopriate ANN architecture is as fol-
lows: one input layer, one hidden layer and one out-
put layer. The quantity of used neurons in both input
and output layers depends on model in/out parame-
ters. The number of neurons in the hidden layer was
determined during training procedures.
The network has 25 inputs, of which 24 is the load
in each hour of the previous day and one determined
day of the week. The output layer consists of 24
neurons, which reflects the forecast demand for every
hour during the day and night.
Different types of neuron activation functions
were applied for the first and hidden layers (hyper-
bolic tangent sigmoid) and different for the output
layer (linear transfer functions).
The only quantity of neurons in the hidden layer
was found by the trial and error method. Networks
have been tested from 1 to 25 neurons in the hidden
layer. The best configuration turned out to be 25-14-
24 because it gave reasonable results with the least
number of neurons.
OptimalControlStrategyofNGPistonEngineasaDGUnitObtainedbyanUtilizationofArtificialNeuralNetwork
173

Table 2: Variable costs of electricity by tariff G12r relating
to power companies: “ENERGA-OBRÓT S.A.” and “En-
erga Operator S.A”
hours $/kWh
7:00–13:00 & 16:00–22:00 0.228
13:00–16:00 & 22:00–7:00 0.091
2.4 Costs
In order to reduce electricity costs the possibility of
using a dual-zone tariff of electricity in cooperation
with a natural gas-powered piston engine was studied
in order to benefit from cheaper electricity in the val-
leys and to produce it oneself in the peaks or to buy it
from the mains, depending on what is more profitable.
Fixed costs include license fees for electricity,
which for the tariffs used in this analysis are about
$5.2/month gross (tariff G12r relating to power com-
panies: “ENERGA-OBRÓT S.A.” and “Energa Op-
erator S.A”). They also include a fixed charge of
$37.71/month gross for gas (transmission & distribu-
tion charged by the company “PGNiG”).
Variable costs include primarily the purchase of
electricity (Table 2) and the scales of the gas group
of “PGNiG” in tariff w-2 for fuel only ($0.415/Nm
3
)
and tariff E-1A for transmission ($0.011/Nm
3
).
Revenues include above all the avoided costs of
purchasing electricity at a time when producing it is a
cheaper way of meeting demand.
3 OPTIMAL CONTROL
STRATEGY OF A NG PISTON
ENGINE
The neural network created as described above
was trained using load data from 08.10.2011 to
15.10.2011 for part of the Institute of Heat Engineer-
ing and Central Canteens of Warsaw University of
Technology.
After putting on the input of the network informa-
tion about the load of 16.10.2011 together with infor-
mation what day of the week it concerns was received
a load of 17.10.2011, which was put on the network
input together with the information about the day of
the week.
This operation was repeated many times to ob-
tain load for the entire week from 17.10.2011 to
23.10.2011.
Figure 4 shows a comparison of results obtained
as described above against the real load of the same
period.
In the next step, a simulation of engine operation
0
10
20
30
40
50
60
70
80
90
17-10-2011
18-10-2011
19-10-2011
20-10-2011
21-10-2011
22-10-2011
23-10-2011
24-10-2011
time
Power, kW
prediction measured
Figure 4: Load prediction vs measured value.
0
10
20
30
40
50
60
70
17-10-2011
18-10-2011
19-10-2011
20-10-2011
21-10-2011
22-10-2011
23-10-2011
24-10-2011
time
Power, kW
Demand Engine load
Figure 5: Demand vs optimal engine load.
on the load generated by the neural network was per-
formed.
Figure 5 shows the optimal way of meeting de-
mand of part of the complex of buildings using the
piston engine and power grid.
0
0.03
0.06
0.09
0.12
0.15
0.18
0.21
0.24
0.27
0.3
17-10-2011
18-10-2011
19-10-2011
20-10-2011
21-10-2011
22-10-2011
23-10-2011
24-10-2011
time
$/kWh
Cost of electricity Cost of electricity production
Figure 6: Cost of electricity vs cost of electricity produc-
tion.
Figure 6 shows the cost of producing electricity
and its cost at the optimal operating strategy.
As is shown in Figure 4 the load predicted for the
week ahead is fairly close to the measured load. This
gives an opportunity for better analysis of the prof-
itability of potential investments.
The simulation engine work (Fig. 5) done on the
load generated by the neural network shows that the
engine operates only in the peaks of demand. In the
valleys electricity from the grid is so cheap that it is
ICINCO2012-9thInternationalConferenceonInformaticsinControl,AutomationandRobotics
174

not profitable to operate the engine in this situation.
On Monday (10.17.2011), Tuesday (18.10.2011)
and Thursday (20.10.2011), the engine shuts down
before the end of the evening peak, which is due to
low load and thus the low efficiency of electricity gen-
eration. A similar situation occurred on Saturday and
Sunday (22.10.2011 and 23.10.2011), when the en-
gine did not run continuously during the peaks and
sometimes electricity was purchased from the grid.
The cost of electricity production (Fig. 6) for the
previously predicted load ranged from $0.13/kWh (in
peaks) to $0.27/kWh (in valleys). The cost of elec-
tricity at the optimum operating strategy (Fig. 6) dur-
ing both the peaks and the valleys could not be higher
than the cost specified in the tariff G12r of the compa-
nies “ENERGA-OBRÓT S.A.” and “Energa Operator
S.A”.
In order to compare the cost-effectiveness of the
proposed solution it should be compared with the
single-zone electricity tariff by subtracting from each
the sum of both the variable and fixed costs for the
considered time period. As a reference point the
G11 tariff was assumed, relating to the power com-
panies “ENERGA-OBRÓT S.A.” and “Energa Oper-
ator S.A” (fixed cost – $3.49/month gross and variable
cost – $0.19/kWh gross).
For the considered week the difference in variable
costs was $287/week. After taking into account the
fixed costs, the income associated with the proposed
solution was $278/week.
4 CONCLUSIONS
The neural network used to predict the load was pro-
posed and the control strategy for the NG piston en-
gine as a DG source of power is presented. From
the investigations performed, it was determined that
the most appropriate objective function of the strat-
egy is to operate the engine for maximum profit (de-
fined as avoided costs of buying electricity from the
grid). On average, the NG piston engine is started up
two times a day: during both the morning and evening
peak loads.
Profits from operation of the NG piston engine de-
pend strictly on the load profile and for the case at
hand it was $278/week.
Currently, many buildings (e.g. office buildings)
have piston engines as emergency power units, but
mainly fueled by liquid fuels (gasoline, oil) – which
are more expensive than NG. Those units are not used
for power generation. If as expected there is further
inflation in electricity prices, power units might be
considered for power generation exclusively during
peak loads. In those cases, investment (installation)
costs are incurred, but in the case of large buildings
(with a range of MW), the profits could be quite sub-
stantial.
ACKNOWLEDGEMENTS
Scientific work financed from funds for science in
2010–2012 as a research project
REFERENCES
Adam, N. B., Elahee, M., and Dauhoo, M. (2011). Forecast-
ing of peak electricity demand in mauritius using the
non-homogeneous gompertz diffusion process. En-
ergy, 36:6763–6769.
Al-Sulaiman, F., Dincer, I., and Hamdullahpur, F. (2010).
Energy analysis of a trigeneration plant based on solid
oxide fuel cell and organic rankine cycle. Inter-
national Journal of Hydrogen Energy, 35(10):5104–
5113.
Amjady, N. and Keynia, F. (2009). Short-term load fore-
casting of power systems by combination of wavelet
transform and neuro-evolutionary algorithm. Energy,
34:46–57.
Azadeh, A., Ghaderi, S., and Sohrabkhani, S. (2008). A
simulated-based neural network algorithm for fore-
casting electrical energy consumption in iran. Energy
Policy, 36:2637–2644.
Azadeh, A., Ghaderi, S., Tarverdian, S., and Saberi, M.
(2007). Integration of artificial neural networks and
genetic algorithm to predict electrical energy con-
sumption. Applied Mathematics and Computation,
186:1731–1741.
Beccali, M., Cellura, M., Brano, V. L., and Marvuglia, A.
(2004). Forecasting daily urban electric load profiles
using artificial neural networks. Energy Conversion
and Management, 45:2879–2900.
Budzianowski, W. (2011). Opportunities for bioenergy
in poland: Biogas and solid biomass fuelled power
plants. Rynek Energii, 94(3):138–146. cited By (since
1996) 1.
Cai, Y., zhou Wang, J., Tang, Y., and chen Yang, Y. (2011).
An efficient approach for electric load forecasting us-
ing distributed art (adaptive resonance theory) & hs-
artmap (hyper-spherical artmap network) neural net-
work. Energy, 36:1340–1350.
Chaichana, K., Patcharavorachot, Y., Chutichai, B., Sae-
bea, D., Assabumrungrat, S., and Arpornwichanop, A.
(2012). Neural network hybrid model of a direct in-
ternal reforming solid oxide fuel cell. International
Journal of Hydrogen Energy, 37(3):2498–2508.
Corria, M. E., Cobas, V. M., and Lora, E. S. (2006). Per-
spectives of stirling engines use for distributed gener-
ation in brazil. Energy Policy, 34:3402–3408.
Demuth, H., Beale, M., and Hagan, M. Neural network
toolbox
TM
6 user’s guide matlab
R
. Technical report.
OptimalControlStrategyofNGPistonEngineasaDGUnitObtainedbyanUtilizationofArtificialNeuralNetwork
175

Foresee, F. and Hagan, M. (1997). Gauss-newton approx-
imation to bayesian regularization. In Proceedings
of the 1997 International Joint Conference on Neural
Networks.
Hajimolana, S., Hussain, M., Daud, W., Soroush, M., and
Shamiri, A. (2011). Mathematical modeling of solid
oxide fuel cells: A review. Renewable and Sustainable
Energy Reviews, 15(4):1893–1917. cited By (since
1996) 0.
Jagaduri, R. T. and Radman, G. (2007). Modeling and con-
trol of distributed generation systems including pem
fuel cell and gas turbine. Electric Power Systems Re-
search, 77:83–92.
Kavaklioglu, K., Ceylan, H., Ozturk, H. K., and Canyurt,
O. E. (2009). Modeling and prediction of turkey’s
electricity consumption using artificial neural net-
works. Energy Conversion and Management,
50:2719–2727.
Kupecki, J. and Badyda, K. (2011). SOFC-based micro-
CHP system as an example of efficient power genera-
tion unit. Archives of Thermodynamics, 32(3):33–43.
Lanzini, A., Santarelli, M., and Orsello, G. (2010). Residen-
tial solid oxide fuel cell generator fuelled by ethanol:
Cell, stack and system modelling with a preliminary
experiment. Fuel Cells, 10(4):654–675.
Maine, T. and Chapman, P. (2007). Prices and output from
distributed photovoltaic generation in south australia.
Energy Policy, 35:461–466.
Milewski, J. and Lewandowski, J. (2009). Solid oxide fuel
cell fuelled by biogases. Archives of Thermodynamics,
30(4):3–12.
Milewski, J., Miller, A., and Salacinski, J. (2005). The con-
ception of high temperature fuel cell exhaust gas heat
utilization. Prace Naukowe Politechniki Warszawskiej
z. Mechanika, 211.
Ocnasu, D., Gombert, C., Bacha, S., Roye, D., Blache, F.,
and Mekhtoub, S. (2008). Real-time hybrid facility
for the study of distributed power generation systems.
Revue des Energies Renouvelables, 11(3):343–356.
Paatero, J., Sevon, T., Lehtolainen, A., and Lund, P. (2002).
Distributed power system topology and control stud-
ies by numerical simulation. In Second International
Symposium on Distributed Generation: Power System
and Market Aspects.
Rezaei, N. and Haghifam, M.-R. (2008). Protection scheme
for a distribution system with distributed generation
using neural networks. Electrical Power and Energy
Systems, 30:235–241.
Rodriguez, P., Timbus, A., Teodorescu, R., Liserre, M.,
and Blaabjerg, F. (2007). Flexible active power con-
trol of distributed power generation systems during
grid faults. IEEE TRANSACTIONS ON INDUSTRIAL
ELECTRONICS, 54(5).
Sonderegger, R. Distributed generation architecture and
control.
Tarroja, B., Mueller, F., Maclay, J., and Brouwer, J. (2008).
Parametric thermodynamic analysis of a solid oxide
fuel cell gas turbine system design space. In Proceed-
ings of the ASME Turbo Expo, volume 2, pages 829–
841.
Wang, J., Kang, L., Chang, L., Cao, B., and Xu, D. (2004).
Energy complementary control of a distributed power
generation system based on renewable energy. IEEE.
http://www.kwk.info.
ICINCO2012-9thInternationalConferenceonInformaticsinControl,AutomationandRobotics
176
