
Modeling and Visualizing Individual and Global Trends of a Multi-agent
System
Vinicius Nonnenmacher, Marta Becker Villamil and Luiz Paulo Luna de Oliveira
Applied Computing-Graduate Program, Universidade do Vale do Rio dos Sinos,
Av. Unisinos 950, S
˜
ao Leopoldo, Brazil
Keywords:
Simulation, Social groups.
Abstract:
This paper proposes a new model for real-time visualization of the social dynamics as a resultant of individual
changes due to their mutual interactions. The model allows the dynamical visualization of both, the individual
characteristics changes as well as the resultant system trends as a whole. As an application, we investigated the
role of individual degrees of influence and the number of agents in the global choice of a population between
two antagonistic options.
1 INTRODUCTION
Recently mathematical models have gained ground
in the simulation of biological and sociological be-
havioral phenomena. In some fields of science these
models have helped to understand the operation of
other complex systems, such as the transmission of
disease or the tendency of an economic system.
One of the subject of sociological research is so-
cial behavior, or collective action. The collective be-
havior modeling is the result of actions, decisions,
or thinking of individual social actors (agents) that
lead to diffusion of innovations, coordination of con-
ventions, emergent norms, and cultural convergence.
At the emergent structure of these kind of models,
agents change location or behavior in response to so-
cial influences . Rather than producing homogene-
ity these decisions aggregate to produce global pat-
terns of cultural differentiation, stratification, and ho-
mophilic clustering in local networks
1
(Macy and
Willer, 2002) One limitation in most social influence
models is the assumption that influence is only posi-
tive. However, social relations can also have negative
valence, such that the state of an agent tends toward
maximal distinctiveness rather than similarity.
Theory of information and social structure has the
basic insight that the amount of widely shared infor-
mation in a system is negatively related to the level
of social differentiation in that system (Mark, 1998).
1
Homophily: the tendency to interact more frequently
with similar agents
In other words, high levels of shared information and
high levels of social differentiation do not occur in
the same societies at the same times. Social influence
occurs when an individual’s thoughts, feelings or ac-
tions are affected by other people. Social influence
takes many forms and can be seen in conformity, so-
cialization, peer pressure, obedience, leadership, per-
suasion, sales, and marketing.
Morton Deutsch and Harold Gerard (Deutsch and
Gerard, 1955) described two psychological needs that
lead humans to conform to the expectations of others.
These include our need to be right (informational so-
cial influence), and our need to be liked (normative
social influence). The informational social influence
is prominent in ambiguous social situations where
people are unable to determine the appropriate mode
of behavior, and is driven by the assumption that sur-
rounding people possess more knowledge about the
situation. Normative social influence is ”the influence
of other people that leads us to conform in order to
be liked and accepted by them.” In many cases, nor-
mative social influence serves to promote social co-
hesion. When a majority of group members conform
to social norms, the group generally becomes more
stable.
A multi-agent system (MAS) has multiple in-
teracting intelligent agents. They present self-
organization and related complex behaviors based on
agents simple parameters. They have been applied
in the real world to graphical applications such as
computer games and movies. Other applications in-
clude transportation, economy, networking and mo-
339
Nonnenmacher V., Becker Villamil M. and Luna de Oliveira L..
Modeling and Visualizing Individual and Global Trends of a Multi-agent System.
DOI: 10.5220/0004047903390344
In Proceedings of the 9th International Conference on Informatics in Control, Automation and Robotics (ICINCO-2012), pages 339-344
ISBN: 978-989-8565-22-8
Copyright
c
2012 SCITEPRESS (Science and Technology Publications, Lda.)

bile technologies. Usually we can visualize over sim-
ulation time only the result or emergence of these sys-
tems at the macroscopic way. The real-time visualiza-
tion of agents internal parameters is necessary as we
need to change some parameters at few agents to an-
alyze the system perturbation that this carries.
This work proposes a new model that allows the
analysis of a multi-agent system in order to investi-
gate which parameter is decisive to one society de-
cides to choose between two different concurrent con-
cepts. A real time visualization of the individual in-
ternal parameters allows researcher to identify the in-
dividual and global tendencies of the role system.
The outline of this paper is as follows: after pre-
senting the related work in the next section, we will
present our social model with some explanation about
the agents parameters and their interactions. After
that, a section explaining the two kinds of MAS visu-
alization. Some results of the simulation is explained
at Section and a conclusion will be given in the last
section of this paper.
2 RELATED WORK
Computer Graphics area has been extensively work-
ing with complexity of MASs systems. Works like
the modeling of flock of birds(Reynolds, 1987)and
(Resnick, 1994) was the forerunners of the recent
works like (Vigueras et al., 2010), (Narain et al.,
2009) . For modeling the flock, instead to use a
bottom up approach based on agent-level interaction,
Reynolds was able to produce highly realistic flight
formations using very simple rules that imposed rel-
atively small computational demands. He did not
model the flock, nor did he model isolated birds.
He modeled their interaction, at the relational level.
Agent-based models of human social interaction are
based on this same theory-building strategy. Like
flocks of birds, recently simulations of human crowds
processes are highly complex, non- linear, path de-
pendent, and self-organizing (Ondrej et al., 2010);
(Guy et al., 2010); (Prazak et al., 2009). We may be
able to understand these dynamics much better not by
trying to model them at the global level but instead as
emergent properties of local interaction among adap-
tive agents who influence one another in response
to the influence they receive . Simulation of soci-
eties as complex non-linear systems, which are dif-
ficult to study with classical mathematical equation-
based models has been used to simulate agent inter-
action with applications ranging from economy, bi-
ology and sociology areas (Helbing, 2009; Newman,
2003). Usually, groups modelling through interac-
Figure 1: Simulation scene. The agents move around and
interact.
tions is aplicated to crowd behavior simulation, Qiu et
al. (Qiu and Hu, 2010) presenedt in their work a unied
and well-dened framework for modeling the structure
aspect of different groups in pedestriancrowds. Both
intra-group structure and inter-group relationships are
considered and their effects on the crowd behavior are
modeled. As result it was presented that different
group sizes, intra- group structures and inter-group
relationships can have signicant impacts on crowd be-
haviors Villamil et al. (Villamil et al., 2005) presented
a work to simulate social groups formation and inter-
action based on simple rules and agents progression.
The competitive behaviors of those groups in the con-
text of behavioral animation was also simulated. As
the work presented here, psychological and physio-
logical characteristics of group and its effect on traffic
characteristics (speed, inter-distance, array of group)
was not analyzed. As Villamil et al. work, this ar-
ticle also present a simulation with sociological con-
notation. But, in this case, we are not interested in
groups displacement in a scene. Influence area, for
example, do not has the same meaning in terms of
local distance inside the scene where one agent can
influence other. It can be considered an analogy to
the level of influence of person on a big population
through television. In this case, the simulation pre-
sented here differs from crowd simulation because it
does not consider personal distance as a preponderant
factor to interaction.
3 INDIVIDUAL COMPETITIVE
MODEL
Simulation is based on a system where agents graphi-
cally represented by a cube get around a scenario ran-
domly. At the beginning agents are positioned ran-
domly and move continuously changing their routs
during the simulation (Figure1).
ICINCO2012-9thInternationalConferenceonInformaticsinControl,AutomationandRobotics
340

3.1 Agents Parameters
Each agent has social individual characteristics de-
scribed as follows:
• Influence (I). The capacity or power of persons
or things to be a compelling force on producing
effects on the actions, behavior, opinions of the
others was modeled in terms of magnitude. In-
fluence is based on popularity (either directly or
indirectly) or success or some combination of the
two and is not only related to a direct interac-
tion. It was represented by a bounding hemisphere
around the cube. The circle area that forms the
base of the hemisphere is directly proportional to
the influence of the agent. So, the most influent
agent of simulation has its hemisphere with a di-
ameter equal to the scenario width. Influence pa-
rameter has threshold between 0 and 1.
• Communicability (v). Agents communicability
represents the speed of exchange of thoughts,
messages, or information, using some way such
as speech, signals, writing, or behavior. In our
model, the communicability of each agent is rep-
resented by its velocity, with which it run about
the simulation space. The number of interactions
involving a specific agent is proportional to its
velocity. Communicability parameter also has a
threshold between 0 and 1.
• Status (S). Accounts for the position, or opinion,
of each agent with respect to two concurrent or an-
tagonistic concepts (products, teams, ideas, etc.)
In our model, 1 ≤ S
i
≤ −1, for each agent i, where
larger proximity to the extremes indicates greater
conviction for one or other concurrent concepts.
A threshold 0 < S
t
< 1 of this parameter divides
the set of agents in three groups:
G
+
= {A
i
; S
t
≤ S
i
≤ 1} (1)
G
0
= {A
i
; −S
t
< S
i
< S
t
} (2)
G
−
= {A
i
; −1 ≤ S
i
≤ −S
t
} (3)
In this paper, S
t
= 0.5, in such a way that G
0
is
empty.
3.2 Agents Interaction
Agents influence each other in response to the in-
fluence they receive. One agent can influence other
when the other is inside its bounding hemisphere. In-
fluence level (I) can be modified at each interaction as
shown in Equations (4) for i-agent and (5) for j-agent.
Modeling interaction between two agents is not a sim-
ple task. Moreover, there are an enormous variety
of ways those interactions can take place. Here, we
adopt the simplest possible premisses to attain math-
ematical expressions for those relations. We expected
that, even being simple, such a model can express
the most basic characteristics of social interactions.
In what follows, we present the formulation of our
model with respect to the change of our basic vari-
ables (I, v and S) when two agent A
i
and A
j
interact
with each other.
For influence, we suppose that the change of influ-
ence of agent A
i
is proportional to the influence of A
j
,
being positive when both agents have the same direc-
tions of opinion (S
i
and S
j
with the same signs), and
negative when they have opposite directions of opin-
ion (S
i
and S
j
with opposite signs). The adopted pro-
portionality constant is 1/N. The same is supposed
for agent A
j
. Then, the influence degree I
i
n+1
in time
n + 1 after a relation with agent A
j
is given by
I
i
n+1
= I
i
n
+
I
i
n
N
S
i
S
j
|S
i
S
j
|
(4)
I
j
n+1
= I
j
n
+
I
j
n
N
S
i
S
j
|S
i
S
j
|
(5)
Adopting a quite similar approach for the other
variables S and v, we have
S
i
n+1
= S
i
n
+
S
j
n
I
j
N
(6)
S
j
n+1
= S
j
n
+
S
i
n
I
i
N
(7)
v
i
n+1
= v
i
n
+
v
i
n
N
I
j
S
i
S
j
|S
i
S
j
|
(8)
v
j
n+1
= v
j
n
+
v
j
n
N
I
i
S
i
S
j
|S
i
S
j
|
(9)
where, after each relation, the direction θ for the ve-
locity actualization is taken randomly in the range
0 ≤ θ < 2π . According to above equations, an inter-
action between two agents belonging to antagonistic
groups is always taken as a destructive interference
for both agents, since it causes a reduction of all three
variables S, v and I. On the other hand, an interaction
with agents of the same group increases these vari-
ables, and are taken always as a constructive interac-
tion. Equations represent the dichotomic characteris-
tic of the model, where agents Status tend to 1 or -1
depending on the influences they receive over simula-
tion.
The above equations rule the dynamics of the set
of agents, that are put to run with their respective ve-
locities, into a simulation ambient. When a agent A
i
gets inside a circle of influence of agent A
j
(with ra-
dius I
j
) the variables of A
i
are actualized according to
ModelingandVisualizingIndividualandGlobalTrendsofaMulti-agentSystem
341
the above equations. As time passes by, transitions of
agents between groups G
+
and G
−
take place. The
objective of this paper is to study the asymptotic be-
havior of this hypothetical society, to see its final equi-
librium state. The possible results includes the victory
of G
−
(with the extinction of G
+
), the victory of G
+
(with the extinction of G
−
) , and the coexistence of
both G
+
and G
−
.
For a better understanding of the system trends we
developed two kinds of real-time visualization: one
concerning the total agents displacement (Window 1),
their interactions, and their influence area and its vari-
ation in a scenario (Figure1).
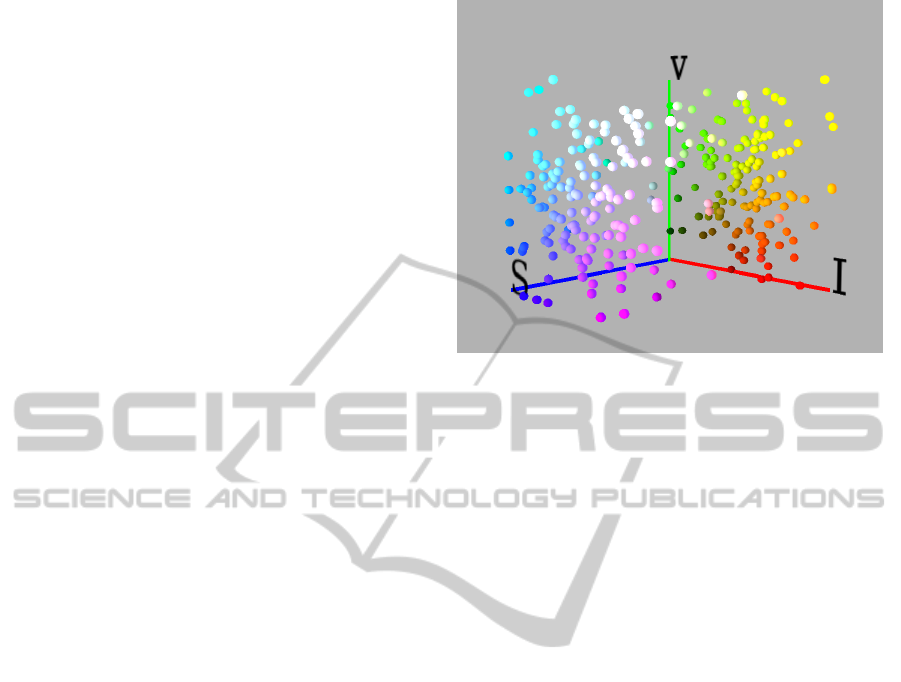
The other one is related to individual internal pa-
rameters (Window 2) (Figure2). Usually, simulations
involving MASs are analyzing by changing initial pa-
rameters and observing the trends of the system as a
role. In this case, changes of individual parameters
during simulation are not possible to identified in real
time.
To analyze agents dynamical internal parameters,
each agent is represented by a sphere positioned at
RGB color space. The individual parameters, Influ-
ence (I), Communicability (v), Status (S), is repre-
sented by chromaticities of the red, green, and blue
additive primaries, and can produce at real-time any
chromaticity that is the triangle defined by those pri-
mary colors. Normalized values of these parame-
ters were changed to fit on the corespondent values
of RGB. Influence was defined on the red threshold
chromaticitie, Communicability was defined on the
green and Status was defined on blue. Spheres change
their color and position during simulation as agents
parameters change. Figure 2 shows a simulation time-
step where all agents parameters are uniformly dis-
tributed on the RGB color space.
Moreover, system user can select some agent by a
mouse clic at the visualization Window 1 and observe
its position and internal parameters trends at visual-
ization Window 2. This is the first step to predict the
future behavior of the system based on present. As we
know, simulation models like this, tend to grow large
in size and complexity, and may be difficult to under-
stand which is the cause of system result. For exam-
ple, only one agent with large influence can modified
throw interactions all other agents parameters very
quickly. And, in this way, we can ask us: what would
happen with the role system if we decrease only this
agent parameter during the simulation? And, on the
other hand, if we choose a group of agents and in-
crease Influence parameter, or their Communicabil-
ity? Would it be sufficient to reverse the big influence
of this agent?
Figure 2: Visualization window 2. At this point of sim-
ulation there is much more agents with parameter S < 0.
Communicability (v) seems to be uniformly distributed.
4 RESULTS AND DISCUSSION
In this section, we present computational experiments
to get conclusions under two mains aspects: asymp-
totic behavior and the role of extremism over the
asymptotic results.
4.1 The Role of Influence I
Although simulation designs were used experimen-
tal rather than post- hoc statistical controls to iden-
tify underlying causal processes, statistical of the re-
sults were also done to system analysis. ABMs re-
quire replications that demonstrate the stability of the
results. Replications include variation in parameters
that are theoretically arbitrary or of secondary inter-
est. Agents S parameter means its position with re-
spect to two concurrent antagonistic concepts that can
be a product, teams, ideas or political parties. S limits
are -1 and . The closer these limits, the more con-
vinced about the concept becomes the agent. As re-
sult it was analyzed the impact of Influence parameter
to the agents choices. How the agents choices change
based on their interactions with others more influents?
The first result is related to system convergence. If
the number of influent agents is big, faster all agents
choose a side convinced. To investigate this, v and
I parameters were lock as they initiate. It was per-
formed 10 simulations for different I parameter aver-
ages. Initial Is were distributed with a 0.2 average and
with a standard deviation of 0.1 meaning not influent
agents. Also it was done more two set of simulations
with Is distributed with a 0.5 average (medium influ-
ICINCO2012-9thInternationalConferenceonInformaticsinControl,AutomationandRobotics
342
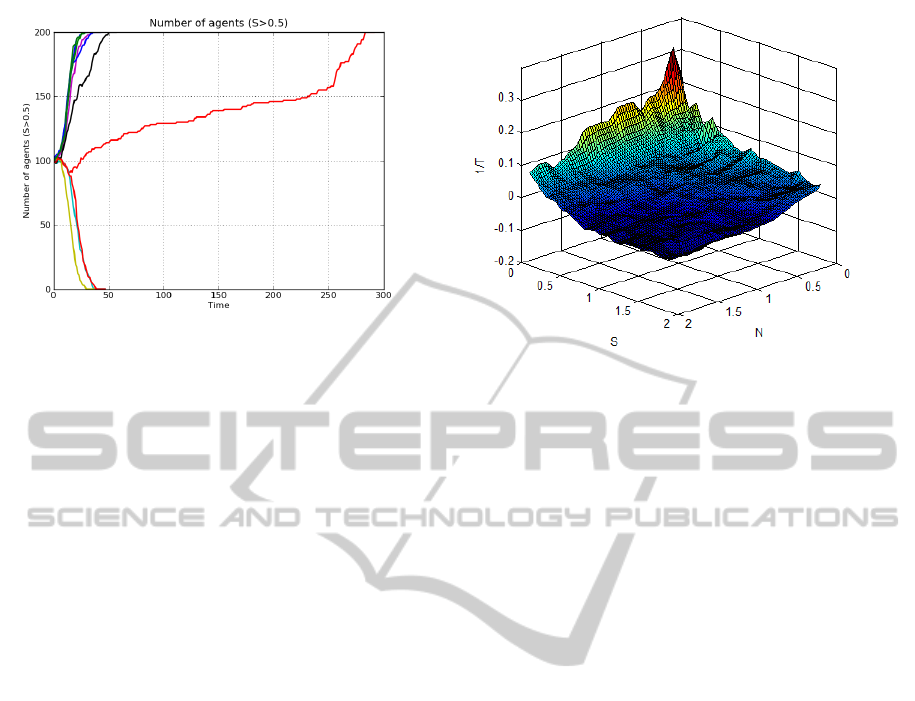
Figure 3: Agents parameter I with an average of 0.7.
ent agents) and Is distributed with a 0.7 average (in-
fluent agents). The standard deviation was maintained
at 0.1 for all simulations. We can observe that sim-
ulations that has agents more influents like the ones
at Figure 3 converge much quickly (9 simulation of
10 converges before frame 50) . And, on the other
side, simulations with not influents agents converges
slowly and agents change their Ss much times.
4.2 The Role of Extremism
Extremism denotes how close, in average, a group is
to on of the extrems = 1 or −1. To this investigation,
more than 400 simulations where made, with group
G
−
configured as in the previous Section, only vary-
ing the number of agents N as well as the extremism S
of one group in relation to the other. In this section we
will denote N = N
+
/N
−
and S = S
+
/S
−
. We consid-
ered 20 values for each of these parameters and made
the 400 corresponding simulations. With that we ob-
tain a 20x20 grid where the maximum and minimum
value for two axis are 2 and 0 respectively. Each point
in the grid is a relation beween the parameters of G
+
and G
−
(G
+
/G
−
). For example, the central point( 1,
1 ) of the grid is the equal distribution of parameters,
where the number of agents is 100 and the extremism
is 0.5 for both groups. To score the results, we mea-
sure T (N,S) = V /t, where t is the convergence time
of the corresponding simulations. To differ between
the victory of G
+
from the victory of G
−
, we make
V = 1 and V = −1, respectively.
As the result we have a surface that displays the
behavior of the system for different values of num-
ber of agents an extremism considering two opposite
groups. From that surface we can see that group G
+
wins for smaller values of S and greater values of N,
while the opposite occurs for the cases of victories of
G
−
. Moreover, some region of draws occurs between.
The overall result is easier to see from the curve lev-
Figure 4: Function T(N,S), as a function of N e S.
els, showed in (Figure 4). There we can see the curve
T (N,S = 0) passing by the point (1, 1) as a confirma-
tion that, when G
+
and G
−
have the same values for
N and S simultaneously, the convergence time tends
to infinite (draw). In the same figure, others curve
levels can be seen, for positive and negative values of
T (N,S). Another conclusion we can take is about the
minimum value that the relations for a equilibrium or
a negative convergence (G
+
). Its possible to note that
the the minimum relation value for a negative conver-
gence is the same for number of agents N = 1 and S:
0.6. In other words, adding N and S in the same pro-
portion causes the same effect in convergence time
and pole. Other data that must be explained is the
quantity of levels in the positive z value side of the
surface. That is because in lower relation values G1
is very less competitive than G
−
causing a very low
time positive conversion, and in the negative z value
side, G1 even being superior in values, is competing
with a medium group, of medium variables. We con-
sider so far this data irrelevant. We can conclude that
the N and S has the same weight in two competing
groups scenario. Thats because the minimum rela-
tions nedded for G1 to converge is the same.
5 CONCLUSIONS
In this paper, we introduced a new model for visual-
izing dynamics of social evolution in real time. It is
applicable to any set of interacting individuals which
is modeled as a multi-agent system, as the one pro-
posed here as an example. Moreover, it permits to
follow individual evolution of specific agents selected
while the simulation is running (by user interaction).
The social model for social evolution of interact-
ing agents proposed here and used as an example of
ModelingandVisualizingIndividualandGlobalTrendsofaMulti-agentSystem
343
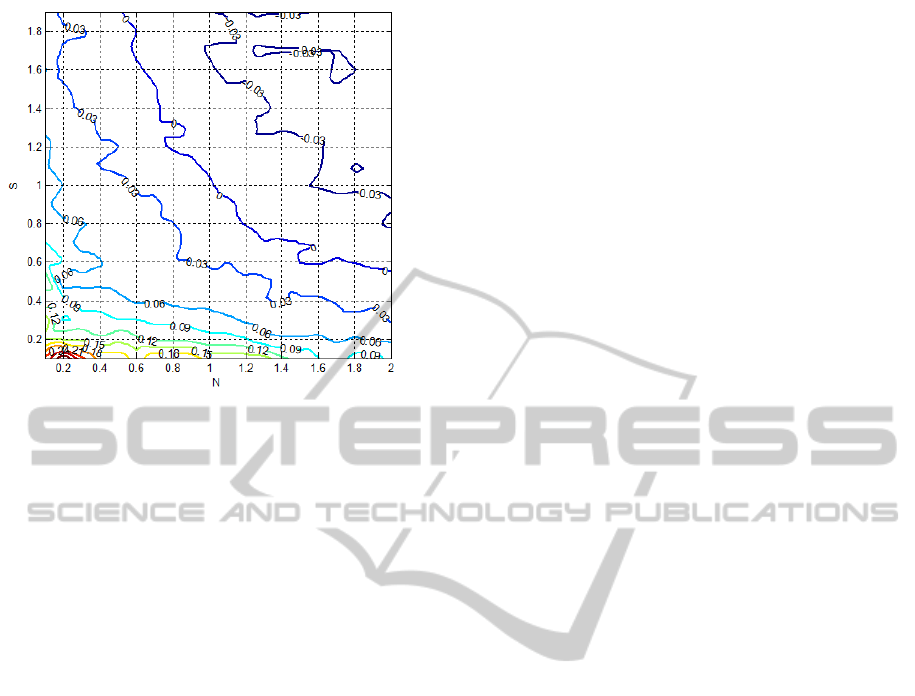
Figure 5: Surface that represents the behavior of the system
for diferent parameters of N and S.
application of the visualization model is based on very
simple assumptions. In fact, all the interactions are
based on proportionality of the considered types of
interacting parameters. This makes some of the re-
sults of a social evolution quite predictable in terms
of common cense most of humans have in terms of
society behavior. The application of the visualization
method to such case showed consistent results accord-
ing to those common cense, which gives validation to
the proposed method inside the scope of the consid-
ered case.
As a future work, the visualization model shall
permit to interfere on the evolution of a MAS in real-
time by the possibility of modification of individual
parameters to interfere on the system’s fate before
the asymptotic state is achieved. We intend to im-
prove the user interaction to permit select an agent
or a group of agents and change their parameters dur-
ing simulation and analyze how the system as a whole
would react. In this way, we could know what agents
or groups of agents are crucial to desired certain con-
vergence of the system. We also are working to im-
prove S parameter to consider it as a n-dimensional
vector to make it possible to include other agents char-
acteristics and choi ces related to its gender, work,
hobbies, etc.
REFERENCES
Deutsch, M. and Gerard, H. B. (1955). A study of norma-
tive and informational social influences upon individ-
ual judgment. The Journal of Abnormal and Social
Psychology, 51:629–636.
Guy, S. J., Chhugani, J., Curtis, S., Dubey, P., Lin, M., and
Manocha, D. (2010). Pledestrians: a least-effort ap-
proach to crowd simulation. In Proceedings of the
2010 ACM SIGGRAPH/Eurographics Symposium on
Computer Animation, SCA ’10, pages 119–128, Aire-
la-Ville, Switzerland, Switzerland. Eurographics As-
sociation.
Helbing, D. (2009). Managing complexity in socio-
economic systems. European Review, 17:423–438.
Macy, M. W. and Willer, R. (2002). From factors to actors:
Computational sociology and agent-based modeling.
Annual Review of Sociology, 28:143–166.
Mark, N. (1998). Beyond individual differences: Social
differentiation from first principles. American Socio-
logical Review, 63(3):pp. 309–330.
Narain, R., Golas, A., Curtis, S., and Lin, M. C. (2009). Ag-
gregate dynamics for dense crowd simulation. ACM
Trans. Graph., 28:122:1–122:8.
Newman, M. E. J. (2003). The structure and function of
complex networks. SIAM REVIEW, 45:167–256.
Ondrej, J., Pettre, J., Olivier, A.-H., and Donikian, S.
(2010). A synthetic-vision-based steering approach
for crowd simulation. SIGGRAPH ’10: ACM SIG-
GRAPH 2010 Papers.
Prazak, M., Kavan, L., McDonnell, R., Dobbyn, S., and
O’Sullivan, C. (2009). Moving crowds: a linear ani-
mation system for crowd simulation. In Proceedings
of the 2009 symposium on Interactive 3D graphics and
games, I3D ’09, pages 9:1–9:1, New York, NY, USA.
ACM.
Qiu, F. and Hu, X. (2010). Modeling group structures in
pedestrian crowd simulation. Simulation Modelling
Practice and Theory, 18(2):190 – 205.
Resnick, M. (1994). Turtles, termites, and traffic jams: ex-
plorations in massively parallel microworlds. MIT
Press, Cambridge, MA, USA.
Reynolds, C. W. (1987). Flocks, herds and schools: A
distributed behavioral model. SIGGRAPH Comput.
Graph., 21(4):25–34.
Vigueras, G., Lozano, M., Ordu
˜
na, J. M., and Grimaldo,
F. (2010). A comparative study of partitioning meth-
ods for crowd simulations. Appl. Soft Comput.,
10(1):225–235.
Villamil, M. B., Oliveira, L. P. L., and Musse, S. R. (2005).
A model for generating competitive groups based on
virtual agents progression. In International Con-
ference on Computer Animation and Social Agents,
pages 133–138. Hong Kong Polytechnic University.
ICINCO2012-9thInternationalConferenceonInformaticsinControl,AutomationandRobotics
344
