
Digital Signature of Network Segment using Flow Analysis
Alexandro M. Zacaron, Luiz F. Carvalho, Mario H. A. C. Adaniya, Taufik Abr˜ao
and Mario Lemes Proenc¸a Jr.
Computing Science Departament, State University of Londrina, Londrina, Brazil
Keywords:
DSNSF, Baseline, NetFlow, K-means, Ant Colony Optimization.
Abstract:
This paper presents two models for building Digital Signature of Network Segment using flow analysis
(DSNSF). The DSNSF can be classified as a characterization of the traffic or as a baseline of the analyzed
network segment. In this work two types of signatures of network segment are presented. The first is built ap-
plying K-means clustering algorithm and the second using optimized clustering by metaheuristic Ant Colony
Optimization (ACO). The signatures provide characterization of the traffic segments analyzed using NetFlow
v9 protocols TCP and UDP. The results achieved show that the two models presented using k-means Clus-
tering and metaheuristic Ant Colony Optimization obtained good results for the creation of DSNSF or traffic
characterization of the segments analyzed.
1 INTRODUCTION
Detecting anomalies became a crucial task for net-
work administrators who have an important role in
keeping networks running constantly. This increased
services running on the network, especially those of-
fered by the internet, motivate its management at a
detailed level of information (Fatemipour and Yagh-
maee, 2007).
The anomalies detection can be classified in two
ways: based in signature in which you have a prior
knowledge about the type of attack; and based in pro-
file that presents a history of network behavior by us-
ing statistical models and data mining among other
techniques (Denning, 1987) and (Patcha and Park,
2007).
This article presents two models for the construc-
tion of a baseline or Digital Signature of Network
Segment using flow analysis (DSNSF). A Flow is
defined as a set of packets passing an observation
point in network during a certain period in which
they share a common set of properties. NetFlow
(Claise, 2004) and IP Flow Information eXport (IP-
FIX) (Claise, 2008) are examples of protocols that ex-
port flows.
The construction of signatures was performed by
flows collected during the month of December 2011,
in The Federal University of Technology - Paran´a
(UTFPR) - Toledo Campus. It was used clustering
technique by the method K-means (MacQueen, 1967)
and metaheuristic Ant Colony Optimization (ACO)
(Dorigo et al., 2006), analysing the total of bits every
5 minutes of the protocols Transmission Control Pro-
tocol (TCP) and User Datagram Protocol (UDP) com-
paring them with motion generated by NfSen (Haag,
2005), that is the front end web for the NFDUMP
(Haag, 2004) tools.
The remainder of this paper is organized as fol-
lows. In Section 2, related works to flows and clus-
tering are presented. In Section 3, it is displayed the
management using flow analysis. In Section 4, it is
shown Digital Signature of Network Segment, while
in Section 5, it is discussed the adopted tests and re-
sults. Finally, in Section 6, we present the conclu-
sions and the final considerations about the models
proposed.
2 RELATED WORKS
Lima (Lima et al., 2010) combines Baseline for Au-
tomatic Backbone Management (BLGBA) to anoma-
lies detection, generated through collection SNMP
objects, which corresponds to the normal traffic at
the State University of Londrina (UEL) and K-means
clustering associated to Particle Swarm Optimization
(PSO) to escape of local optimal. Classifying the
baseline and the real traffic through clustering it is
possible to identify anomalies compared to the dis-
tance of real traffic and clusters centroid.
35
M. Zacaron A., F. Carvalho L., H. A. C. Adaniya M., Abrão T. and Lemes Proença Jr. M..
Digital Signature of Network Segment using Flow Analysis.
DOI: 10.5220/0004048100350040
In Proceedings of the International Conference on Data Communication Networking, e-Business and Optical Communication Systems (DCNET-2012),
pages 35-40
ISBN: 978-989-8565-23-5
Copyright
c
2012 SCITEPRESS (Science and Technology Publications, Lda.)

The clustering algorithms based on the behavior of
an ant colony began with the work of Deneubourg
(Deneubourg et al., 1990b). In this model, the ants
move randomly in a two-dimensional space divided
into cells, in which some data points are scattered.
Each cell can only accommodate a single data. An
ant can move points in space catching and releasing
them with a certain probability. This probability is
dependent on a density estimation of elements having
the same characteristics in the vicinity of the current
cell.
Shuying Chang (Chang et al., 2010) proposed a
new method of anomalies detection based on flows,
with the use of sketch and combinations of traffic
characteristics. Sketches are established for source
address, destination address and port destination. The
flow records are recorded with the use of hash func-
tions. For each sketch, the Holt-Winters technique is
used to achieve the forecast and prediction by creat-
ing a certain limit. When the limit is exceeded, sub-
alarms that are compared with characteristics of sev-
eral attacks are generated. Then final alarms are gen-
erated. While the sketches are constructed, the desti-
nation addresses are recorded in linked lists to be used
in detecting victims.
3 MANAGEMENT USING FLOW
ANALYSIS
The NetFlow service was developed by Cisco (Claise,
2004) to resolve the need for measuring/monitoring
the traffic in a way that the administrator could have a
vision of communication between hosts with informa-
tion that initially was known as five-tubles: (source
IPv4Address, destinationIPv4Address, source Trans-
portPort, destination TransportPort, protocolIdenti-
fier), also supporting IPv6. This information defines a
flow, and according to (Trammell and Boschi, 2011),
we have a less restrictive definition of the flow as a
set of packets passing an observation point on the net-
work during a certain period sharing a common set of
properties.
The IETF has developed a new protocol based on
NetFlow v9, called IP Flow Information eXport (IP-
FIX), described on RFC 5101 (Claise, 2008), with
some improvements in different domains, such as
congestion and safety.
The IPFIX can be used for various purposes, and
according to RFC3917 (Quittek et al., 2004), that de-
fined the requirements of the protocol, its objectives
are to satisfy the application considered of significant
importance today and/or for the future of IP networks.
4 DIGITAL SIGNATURE OF
NETWORK SEGMENT
An important and fundamental step for network man-
agement and anomalies detection is the adoption of
a efficient model for characterizing traffic Network
Segment. The traffic network is currently composed
of cycles consisting of bursts which have particular
characteristics of its use. This behavior is directly af-
fected by working hours and the workdays period of
people who use the networks (Proenca et al., 2006).
The creation of the Digital Signature of Network
Segment Using Flow analysis (DSNSF) or baseline
aims to create a basic profile that should portray this
behavior through the available information in the col-
lected flows, for example, the number of bits, the
number of packets and flows.
In this work, it is used using the technique of clus-
tering, that is a tool data mining used to find and quan-
tify similarities between points of determined group
of data. This process seeks to minimize the vari-
ance between elements of a given group and maxi-
mize them in relation to other groups (Fu, 2008). The
equation that measures the similarity between the data
is called the objective function and is described by
equation (1).
J(p) =
K
∑
k=1
S
∑
s=1
q
|P
k
s
− c
k
|
2
(1)
in which: K is the number of clusters; S is the number
of points; P
k
s
is the value of points belonging to the
cluster k; c
k
corresponds to the center of the cluster k.
The purpose of the clustering use is to create a
template from which it is possible to extract a pat-
tern of information. Thus, when a distance of data is
found in smaller quantities in relation to this standard,
you can group them into clusters of different sets of
greater representation.
4.1 K-means Clustering
K-means (KM) is the process that divides a popula-
tion into n-dimensional in K groups based on a sam-
ple. The KM procedure is easy to program and com-
putationally economical and feasible to process large
samples (MacQueen, 1967). In general KM does not
converge to optimal partition, although there are spe-
cific instances where they converge.
KM partitions points of the data matrix, which can
be a vector or matrix, in K clusters, the matrix rows
correspond to the points and the columns correspond
to variables. This partitioning seeks to maximize the
sum of the distances between clusters and minimize
DCNET2012-InternationalConferenceonDataCommunicationNetworking
36

the sum of distances within each cluster. Usually the
Euclidean Distance has been adopted to measure the
similarity of the data for being computationally sim-
ple. Each cluster of data is represented by center
called centroid.
Regardless if it is a matrix or an array, KM always
returns an array containing the indices of the cluster
for each point.
The DSNSF-KM algorithm hereafter demostrates
the implementation of KM.
DSNSF-KM
algorithm used to clustering.
Input:
Set of bits collected in the range of
5 minutes, number of clusters
Output:
m: Value representing the bits set in
the range of 5 minutes.
Step 1
Place k points in space that represent the
points to be clustered. These points
represent the inicial set of centroid.
Step 2
Assign each point to the group closer
to the centroid.
Step 3
When all the points have been
allocated recalculates the position of K
centroids.
Step 4
Repeat steps 2 and 3 until the centroid
does not move more or the number of
iterations is exceeded.
m <- weighted average between the centers
The problem of finding the local optimal can only
be solved in general, for an exhaustiveselection of the
centroids. Using several repetitions with the starting
centoids randomly, you can find the solution which is
possibly the global optimum.
4.2 Ant Colony Optimization
Deneubourg (Deneubourg et al., 1990a) observed us-
ing controlled experiments a set of ants could find the
shortest path between their colony and food source,
marking the path with a substance called pheromone.
This behavior of ants inspired Marco Dorigo and his
friends in the creation of the solution method for com-
binatorial optimization problems called Ant Colony
Optimization (ACO).
As in ant colonies, the ACO is composed of a
population of agents competing and globally asyn-
chronous, cooperating to find an optimal solution. Al-
though each agent has the ability to build a viable
solution, as well as a real ant can somehow find a
path between the colony and food source, the highest
quality solutions are obtained through cooperationbe-
tween individuals of the whole colony (Dorigo et al.,
2006).
The ACO described in this paper aims to optimize
the efficiency of clustering minimizing the objective
function value (1), i.e., it seeks solutions to the group-
ing data in a way that allows the extraction of patterns,
behaviors and characteristics. Thus, this ensures that
each point i will be grouped to the best cluster j in
which j = 1, ..., K. In addition, it enables the con-
struction of solutions that are not given by local opti-
mal, it is the existing problem in some clustering al-
gorithms.
The DSNSF-ACO algorithm hereafter de-
mostrates the implementation of ACO.
DSNSF-ACO
algorithm used to clustering.
Input:
Set of bits collected in the range of
5 minutes, number of clusters.
Output:
m: Value representing the bits set
in the range of 5 minutes.
while
stopping condition is not reached
Create solutions
Evaluate solutions through the objective
function
Update pheromone trail
end-while
Calculate the center of each cluster of
the best solution found
for
i = 1 : number of clusters
if
number of elements in the cluster c <
γ
Discard the cluster c
end-if
end-for
m <- weighted average between the centers
The result of DSDSF-ACO algorithm is the value
that describes the combination of the most representa-
tive clusters. To obtain this value, the weighted aver-
age is calculated between the clusters. The calculation
is demonstrated in equation (2).
m =
∑
K
j=1
c
j
. p
j
S
(2)
In this equation cj is the center value of cluster
j and pj is the amount of points associated with the
same cluster index. The variable represents the min-
imum amount of allowed points grouped in a cluster
and ensures that the data do not represent a pattern
that will be eliminated. Thus, the result will be closer
to the cluster center that has the highest number of
points, ie, the cluster that best represents the data be-
havior collected at intervals of five minutes.
DigitalSignatureofNetworkSegmentusingFlowAnalysis
37

5 RESULTS OBTAINED
In order to evaluatethe proposed model for generation
of Digital Signature of Network Segment using flow
analysis (DSNSF) tests were performed with real data
collected in the Federal University of Technology -
Paran´a (UTFPR) - Toledo Campus.
Figure 1: Scenario where flows were collected.
The figure (1) identifies the scenario in which the
collection of flows were performed, exported 1:1, in
other words, it was not used any sampling technique,
all flows were exported by softflowd (Miller, 2010)
application installed on the gateway. The flows are
saved in files every five minutes so they can be ana-
lyzed later. The solftflowd is a network analyzer ca-
pable of exporting data within the NetFlow pattern by
monitoring of a network interface or by reading a file.
The softflowd supports 1, 5, and 9 of NetFlow ver-
sions.
The Flows were exported in the NetFlow version
9 to a server running CentOS 5.5 with the application
NFDUMP, which it is a tool for collecting and pro-
cessing NetFlow data. The NfSen was installed with
the NFDUMP, it is a front end to NFDUMP, in order
to facilitate the viewing, searching, alerting genera-
tion and processing flows collected.
After the clustering of flows, similar data groups
are formed. Due to the high similarity of network
traffic, much of the information presents similar be-
havior. Thus, the clusters formed by small amounts
of data and that deviate enormously of the default be-
havior must be rejected in the construction of DSNSF,
because the abnormal behavior can mean any type of
anomaly in the segment analyzed and influence neg-
atively on the model. To do this, a γ lower limit was
set, which determines the minimum allowable propor-
tion of points grouped into a cluster. If any cluster has
fewer points than γ, it is discarded from the final solu-
tion, as well as the points that belong to it. Tests per-
formed show that if a cluster has less than five points
it should be discarded. This strategy ensures the flows
or points anomalous do not compose the DSNSF.
For the two models presented it is used K = 4 cen-
ters and 20 iterations in the creation of DSNSF, which
were obtained by simulation in which the values have
been varied to get the best results.
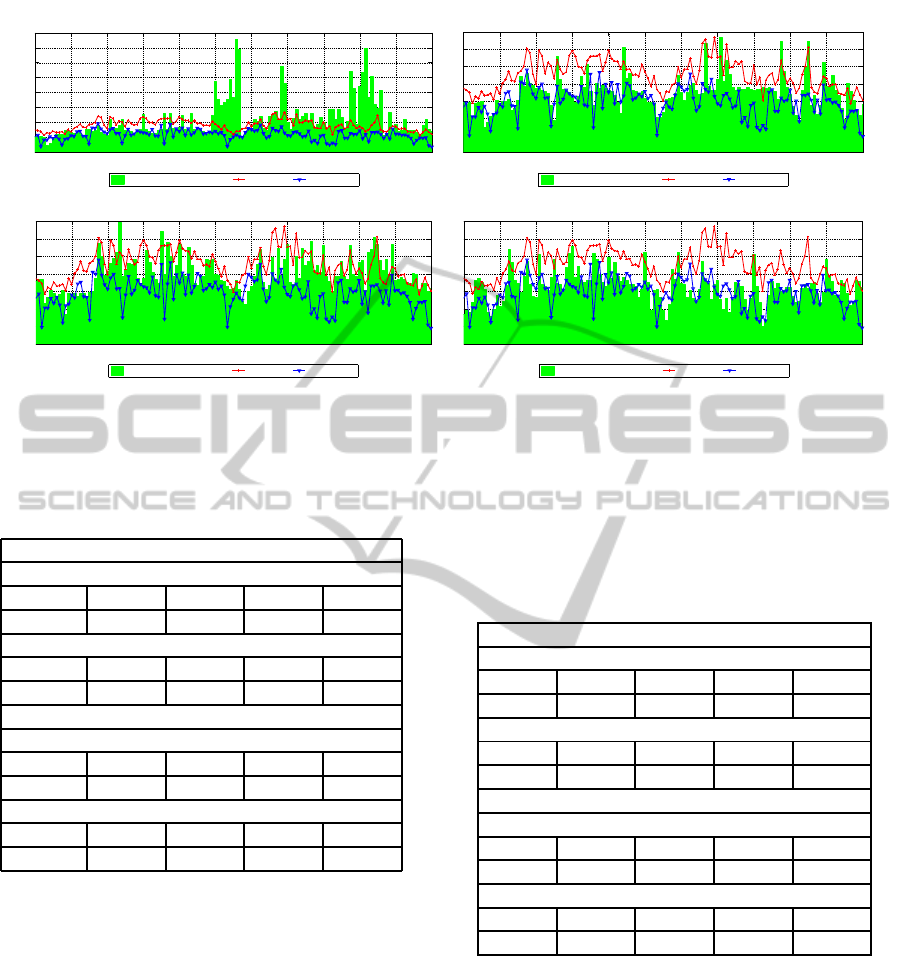
The figure (2) represents the actual movement of
the segment analyzed in bits/s to the UDP protocol
provided by DSNSF-KM e DSNSF-ACO on the mo-
tion generated by NfSen, referring to day 12 to 16
December 2011.
As it is noted, the models DSNSF in figure (2) de-
scribe the network behavior. It was observed that the
DSNSF-ACO is positioned below the DSNSF-KM.
Regarding the behavior of each DSNSF to movement,
it is not visually defined which is better, because for
Monday DSNSF-ACO adapted itself better to the mo-
tion, as DSNSF-KM for Tuesday.
The models DSNSF generated to the UDP proto-
col in figure (2) show that there is a small variation y
axis in relation to traffic volume. It was observed that
the DSNSF-ACO keeps below the DSNSF-KM. Re-
garding the behavior of each DSNSF to movement, it
is not visually defined what is best for UDP because
there are also cases in which one is better in a day but
worse in another.
Changes in the behavior of the motion before the
DSNSF models are being studied and serve as moti-
vation to discover what causes these changes. Some
options might be: increasing the number of users, a
software update, an attack, a problem in network as-
sets that may be causing such relays, etc. With a
good DSNSF the administrator can quickly realize
that his network has changed the behavior and inves-
tigate possible causes.
For a more detailed analysis, it was performed
the calculation of correlation and normalized mean
square error (NMSE). In order to indicate how the
models are related with the movement, it was per-
formed correlation with the movement generated by
NfSen. The results are displayed in the table (1) for
TCP and UDP protocols.
For the correlation, if the value displayed is 1, it
means that it is excellent or if the movement is up or
down for example 10%, the DSNSF models should
also accompany it in the same proportion. If the value
is 0, the correlation is poor. It implies disagreement
with the movement in the same proportion, and if -1 is
presented, it means that the values are anti correlated,
ie if the movement is up, the models are down and
vice versa.
Regarding the correlation to the TCP protocol, it is
verified that for each day the DSNSF-KM had a better
DCNET2012-InternationalConferenceonDataCommunicationNetworking
38
7 8 9 10 11 12 13 14 15 16 17 18
0
0.5
1
1.5
2
2.5
3
3.5
4
x 10
5
BASELINE DSNSF−KM AND DSNSF−ACO OVER TRAFFIC
GATEWAY REITORIA −− UDP PROTOCOL
TIME (Hours) −− 13/12/2011 (TUESDAY)
TRAFFIC (Bits/s)
TRAFFIC MEANS (NFSEN) DSNSF−KM DSNSF−ACO
7 8 9 10 11 12 13 14 15 16 17 18
0
2
4
6
8
10
12
14
x 10
4
BASELINE DSNSF−KM AND DSNSF−ACO OVER TRAFFIC
GATEWAY REITORIA −− UDP PROTOCOL
TIME (Hours) −− 14/12/2011 (WEDNESDAY)
TRAFFIC (Bits/s)
TRAFFIC MEANS (NFSEN) DSNSF−KM DSNSF−ACO
7 8 9 10 11 12 13 14 15 16 17 18
0
2
4
6
8
10
12
14
x 10
4
BASELINE DSNSF−KM AND DSNSF−ACO OVER TRAFFIC
GATEWAY REITORIA −− UDP PROTOCOL
TIME (Hours) −− 15/12/2011 (THURSDAY)
TRAFFIC (Bits/s)
TRAFFIC MEANS (NFSEN) DSNSF−KM DSNSF−ACO
7 8 9 10 11 12 13 14 15 16 17 18
0
2
4
6
8
10
12
14
x 10
4
BASELINE DSNSF−KM AND DSNSF−ACO OVER TRAFFIC
GATEWAY REITORIA −− UDP PROTOCOL
TIME (Hours) −− 16/12/2011 (FRIDAY)
TRAFFIC (Bits/s)
TRAFFIC MEANS (NFSEN) DSNSF−KM DSNSF−ACO
Figure 2: DSNSF-KM and DSNSF-ACO generated over the movement, UDP protocol, Tuesday,Wednesday, Thursday and
Friday.
Table 1: Correlation between two models digital signature
of network segment DSNSF-KM and DSNSF-ACO with
the movement generated by NfSen for TCP and UDP pro-
tocols.
Protocol TCP
DSNSF-ACO
Mon Tue Wed Thu Fri
0.8057 0.7601 0.7507 0.6985 0.7757
DSNSF-KM
Mon Tue Wed Thu Fri
0.8289 0.7981 0.7598 0.7666 0.8188
Protocol UDP
DSNSF-ACO
Mon Tue Wed Thu Fri
-0.0025 0.1042 0.4368 0.4220 0.3838
DSNSF-KM
Mon Tue Wed Thu Fri
0.2468 0.1437 0.5895 0.6466 0.5334
correlation than the DSNSF-ACO, but the DSNSF-
ACO was also successful. Both models are worth
more than 0.6900 indicating a good correlation, re-
membering that the closer to 1 the better.
The correlation to the UDP protocol showsthat for
both models DSNSF, the values fell very much with
DSNSF-ACO, coming to present a negative value
for Monday, characterizing a small descorrelation to
movement. As the behavior of the UDP protocol is
different from TCP, some adjustment as the number
of centers and iterations can improve the correlations
presented by the models.
To define the proximity between the models pre-
sented with the movement, it was used NMSE in rela-
tion to the movement to TCP and UDP protocols and
the results are presented in table (2). To this aspect,
it can be interpreted that the lower the value obtained,
the closer to the model is the movement.
Table 2: Normalized mean square error (NMSE) between
two models digital signature of network segment DSNSF-
KM and DSNSF-ACO with the movement generated by Nf-
Sen for TCP and UDP protocols.
Protocol TCP
DSNSF-ACO
Mon Tue Wed Thu Fri
0.6554 0.2242 0.2616 0.1739 0.6368
DSNSF-KM
Mon Tue Wed Thu Fri
1.4671 0.3614 1.0526 0.2620 1.2397
Protocol UDP
DSNSF-ACO
Mon Tue Wed Thu Fri
0.4588 0.2101 0.0889 0.1183 0.1017
DSNSF-KM
Mon Tue Wed Thu Fri
1.4038 0.1587 0.2016 0.0769 0.3733
As it is noted in the table (2), to this aspect the
DSNSF-ACO has a smaller distance than the DSNSF-
KM, demonstrating that it is closer to the movement.
For the UDP protocol, it is verified that the DSNSF-
ACO remains for Monday, Wednesday and Friday, as
the DSNSF-KM showed better values for the other
two days. It is observed that to the UDP protocol the
values of the models which were much closer to the
TCP protocol characterized a better fit for the item
UDP.
DigitalSignatureofNetworkSegmentusingFlowAnalysis
39

6 CONCLUSIONS
Two models for building Digital Signature of Net-
work Segment were presented using flow analysis
(DSNSF), building two types of signatures, DSNSF-
KM by K-means and DSNSF-ACO clustering opti-
mized by the metaheuristic Ant Colony Optimization
(ACO).
Both DSNSF-KM and DSNSF-ACO showed
good results being possible to generate both a model
which describes in general behavior of the network.
Between the two signatures, DSNSF-ACO had better
results as the proximity of the movement through nor-
malized mean square error; whereas the DSNSF-KM
had better results for correlation to the movement.
Tools that allow network administrators character-
ize network traffic is of vital importance. They make
it possible to identify behaviors for a given time, day
of week or even a particular service, having an impor-
tant role in detecting anomalies.
As future work, the proposed models must be im-
proved in order to increase the accuracy and test algo-
rithms for anomalies detection using signatures gen-
erated DSNSF-KM and DSNSF-ACO.
Also the creation of Digital Signatures of Network
Segments (DSNSF) with information as bits/s, TCP
port, IP source and destination aims to create a cor-
relation matrix DSNSF to assist in the detection of
network problems.
ACKNOWLEDGEMENTS
This work was supported by SETI/Fundac¸˜ao
Arauc´aria and MCT/CNPq by the financial sup-
port for the Rigel Project. Thanks to the Federal
University of Technology – Paran´a – Toledo Campus.
REFERENCES
Chang, S., Qiu, X., Gao, Z., Liu, K., and Qi, F. (2010).
A flow-based anomaly detection method using sketch
and combinations of traffic features. In Network
and Service Management (CNSM), 2010 International
Conference on, pages 302 –305.
Claise, B. (2004). Cisco Systems NetFlow Services Export
Version 9. RFC 3954 (Informational).
Claise, B. (2008). Specification of the IP Flow Information
Export (IPFIX) Protocol for the Exchange of IP Traf-
fic Flow Information. RFC 5101 (Proposed Standard).
Deneubourg, J.-L., Aron, S., and Goss, S. (1990a). The self-
organizing exploratory pattern of the argentine ant.
Journal of Insect Behavior, 3:159–169.
Deneubourg, J. L., Goss, S., Franks, N., Sendova-Franks,
A., Detrain, C., and Chr´etien, L. (1990b). The dynam-
ics of collective sorting robot-like ants and ant-like
robots. In Proceedings of the first international con-
ference on simulation of adaptive behavior on From
animals to animats, pages 356–363, Cambridge, MA,
USA. MIT Press.
Denning, D. (1987). An intrusion-detection model.
Software Engineering, IEEE Transactions on, SE-
13(2):222 – 232.
Dorigo, M., Birattari, M., and Stutzle, T. (2006). Ant colony
optimization. Computational Intelligence Magazine,
IEEE, 1(4):28 –39.
Fatemipour, F. and Yaghmaee, M. (2007). Design and
implementation of a monitoring system based on ip-
fix protocol. In Telecommunications, 2007. AICT
2007. The Third Advanced International Conference
on, page 22.
Fu, H. (2008). A novel clustering algorithm with ant colony
optimization. In Computational Intelligence and In-
dustrial Application, 2008. PACIIA ’08. Pacific-Asia
Workshop on, volume 2, pages 66 –69.
Haag, P. (2004). NFDUMP - NetFlow processing tools.
Haag, P. (2005). NetFlow visualisation and investigation
tool.
Lima, M., Zarpelao, B., Sampaio, L., Rodrigues, J., Abrao,
T., and Proenca, M. (2010). Anomaly detection us-
ing baseline and k-means clustering. In Software,
Telecommunications and Computer Networks (Soft-
COM), 2010 International Conference on, pages 305
–309.
MacQueen, J. B. (1967). Some methods for classification
and analysis of multivariate observations. In Cam, L.
M. L. and Neyman, J., editors, Proc. of the fifth Berke-
ley Symposium on Mathematical Statistics and Prob-
ability, volume 1, pages 281–297. University of Cali-
fornia Press.
Miller, D. (2010). Softflowd - traffic flow monitoring. [On-
line; accessed 28-May-2011].
Patcha, A. and Park, J.-M. (2007). An overview of
anomaly detection techniques: Existing solutions and
latest technological trends. Computer Networks,
51(12):3448 – 3470.
Proenca, M., Coppelmans, C., Bottoli, M., and
Souza Mendes, L. (2006). Baseline to help with
network management. In e-Business and Telecom-
munication Networks, pages 158–166. Springer
Netherlands.
Quittek, J., Zseby, T., Claise, B., and Zander, S. (2004). Re-
quirements for IP Flow Information Export (IPFIX).
RFC 3917 (Informational).
Trammell, B. and Boschi, E. (2011). An introduction to
ip flow information export (ipfix). Communications
Magazine, IEEE, 49(4):89 –95.
DCNET2012-InternationalConferenceonDataCommunicationNetworking
40
