
On Measuring Smartphones’ Software Energy Requirements
Hagen H
¨
opfner
1
, Maximilian Schirmer
1
and Christian Bunse
2
1
Mobile Media Group, Bauhaus-Universit
¨
at Weimar, Bauhausstraße 11, Weimar, Germany
2
Software-Systeme, University of Applied Sciences Sciences Stralsund, Stralsund, Germany
Keywords:
Software Engineering, Data Processing, Energy Awareness.
Abstract:
The continuous technological evolution of smartphones regarding their performance, networking facilities, and
memory capacity, as well as various sensors, leads to a significant increase of a device’s energy requirements.
Hence, energy demand is one of the most limiting factors of battery-driven, mobile devices. Improving energy
demand by software optimisation often relies on simulated energy demand data. This paper evaluates two
approaches for actually measuring real energy data with the goal to build an efficient and cost-effective basis
for future research. The main question underlying this paper is: Is the preciseness of energy data provided by
a smartphone’s operating system reliably close to the preciseness of data obtained via classic (i.e., hardware-
based) measurement approaches. We defined a case study to evaluate this question. Our evaluation results
show that software-based energy measures have an acceptable preciseness for comparative measures and are
thus sufficient for research that warrants or requires total values.
1 INTRODUCTION AND
MOTIVATION
Energy is one of the most limiting factors for the
growth of information and communication technolo-
gies, especially when it comes to mobile devices
such as smartphones. In most application scenar-
ios, mobile devices do not have a permanent power
supply but use batteries. Due to increases in hard-
ware performance, display qualities, and the integra-
tion of additional hardware, like global positioning
system (GPS) receiver, accelerometer, and other sen-
sors into smartphones, energy requirements are con-
stantly growing. However, software utilizes hardware
and therefore, directly affects the energy requirements
of the entire system. Energy-aware software devel-
opment, energy-aware algorithms and energy-aware
sensor substitution are only three examples for re-
cently initiated research areas that try to reduce en-
ergy requirements by optimising the software rather
than the hardware (H
¨
opfner and Bunse, 2011). A
common problem is the lack of guidelines and ap-
proaches to evaluate results. In this paper, we address
the question on how to systematically measure energy
requirements on smartphones. We examine two dif-
ferent approaches: First, a physical experiment setup
for measuring energy requirements of dedicated hard-
ware components. Second, a software-based approa-
using energy measurement facilities of the operating
system. While it is assumed that the hardware ap-
proach provides precise data the second can easily be
used with different devices without the need for ma-
nipulating the device.
We compare both strategies, examine differences
regarding preciseness and reasons thereof, and ad-
dress their use in the context of the following mea-
surement scenarios: Comparative measures allow
to compare different implementations, e. g. of algo-
rithms, regarding energy requirements. They are used
to specify that an algorithm requires less energy than
another one. Total demand measures allow to quan-
tify the amount of energy required in total to perform
a certain task, e. g., to sort a list of integer values.
Quantitative measures allow to quantify the amount
of energy required per hardware component to per-
form a certain task; e. g., how much energy does a
GPS receiver require per request.
The paper is structured as follows: Section 2
discusses related work. Section 3 introduces our
hardware-based reference setup. Section 4 presents
software-based techniques to measure energy. Sec-
tion 5 discusses their appropriateness. Section 6 con-
cludes the paper and shows future research options.
165
Höpfner H., Schirmer M. and Bunse C..
On Measuring Smartphones’ Software Energy Requirements.
DOI: 10.5220/0004067601650171
In Proceedings of the 7th International Conference on Software Paradigm Trends (ICSOFT-2012), pages 165-171
ISBN: 978-989-8565-19-8
Copyright
c
2012 SCITEPRESS (Science and Technology Publications, Lda.)

2 RELATED WORK
The research presented in this paper is rooted in the
research fields of energy-aware computing in gen-
eral, and on energy requirement ascertainment tech-
niques in specific. Most energy-aware computing ap-
proaches either try to reduce energy requirements by
substituting hardware resources (Bunse and H
¨
opfner,
2008), or by balancing energy requirements and in-
formation quality (Sousa et al., 2008). The authors
of (Bunse et al., 2011a) illustrate that even a simple
substitution of the resources central processing unit
(CPU) and memory helps to reduce the amount of en-
ergy required for sorting data. The reason is the fact
that CPU usage needs comparatively less energy than
memory storage (Marwedel, 2007). The authors of
(Veijalainen et al., 2004) found out that file compres-
sion (more CPU) reduces the energy requirements of
wireless data transmissions (less network traffic). Ac-
cording to (Kansal and Zhao, 2008), a comparable ef-
fect appears for hard-drive operations. Compression
does not reduce the quality of processed information
but reduces sizes and therefore energy needs. The
authors of (Schirmer and H
¨
opfner, 2011) presented
an approach to reduce energy requirements of loca-
tion determination by reducing the amount of GPS re-
quests. Hence, they also reduced the accuracy in order
save energy (i.e., graceful degradation). The authors
of (H
¨
opfner and Bunse, 2010) show that processing
less precise data requires less energy, and also present
an experimental setup for measuring the energy re-
quirements of core and memory of a micro controller
based system, running standard sorting algorithms.
We adapted this setup (cf. Section 3). Nokia provides
a tool called Nokia Energy Profiler
1
and an API
2
that
enables developers to monitor power consumption, as
well as battery voltage and current on Nokia S60 de-
vices. To the best of our knowledge Nokia did not
publish any information about data correctness. How-
ever, their approach falls into the software-based tech-
niques discussed in Section 4 and was used, e. g., by
the authors of (Kjærgaard et al., 2009). They exam-
ined energy-efficient position tracking techniques. In
contrast to the Nokia tool, the authors of (Zhang et al.,
2010) evaluated their software based energy measure-
ment approach called PowerTutor using hardware-
based reference measurements.
1
http://www.developer.nokia.com/Resources/Tools and
downloads/Other/Nokia Energy Profiler/
2
http://www.developer.nokia.com/Resources/Tools and
downloads/Other/Nokia Energy Profiler/External APIs.
xhtml
3 HARDWARE-BASED MEASURE
Based on (H
¨
opfner and Bunse, 2010), energy require-
ments can be measured via examining voltage drops
at sense resistors captured during the execution of a
service or application. Energy can then be calculated,
following Ohm’s and Kirchhoff’s law, by evaluating
the integral of the curve defined by the data. Using
resistors for measurement purposes requires the use
of specifically designed sense resistors that have an
error limit g ≤ 10
−3
. In the context of this study we
used a precision measurement sensor that has a resis-
tance tolerance of 0.005 % and a temperature coeffi-
cient ±0.05 × 10
−6
K
−1
.
In contrast to performance or execution time that
can be measured at specific (local) points, energy is
a “delocalized” property. The energy required by or
for a service is the sum of the energy required by
all involved components (CPU, memory, etc.). Exact
measures require multiple measurement points result-
ing in massive data sizes given that each component
provides a measurement opportunity. A typical so-
lution regarding this problem is to examine the en-
ergy demanded by a component in isolation in or-
der to either provide a fixed value (e. g., line losses)
or by defining a function (e. g., correlation to load).
Energy may then be measured at a central interface.
Unfortunately, it is not trivial to insert a sense resis-
tor between, e. g., a CPU and the power supply since
modern CPUs have multiple power lines. To avoid
such problems we decided to use a board that offers
dedicated measurement points for most components.
Modern CPUs using multiple cores embedded in one
chip cause another problem. A parallel execution of
processes would lead to errors if energy is measured
at one core only. Our first solution was to configure
the system in a way that only one core is used, but we
are revising our approach to address this problem.
As a side note, the sketched path to energy mea-
surement has a limiting factor. The quality of results
directly depends on the sampling rate. The higher
the sampling rate the better the calculation result be-
comes. Our experiments have shown that reliable re-
sults require a sample rate of at least 1 µs. So, every
second we do get 10
6
data points. To mitigate size
problems data should therefore only be collected for
the time needed for fulfilling a single request and not
for the lifetime of a service.
We used our own measurement framework that
already has been successfully used in the context of
several experiments (Bunse et al., 2011b). The cen-
tral element is the smartphone whose energy demand
is measured in relation to the execution of software
artefacts. We chose a Google Nexus One out of the
ICSOFT2012-7thInternationalConferenceonSoftwareParadigmTrends
166

following reasons: (1) It is a developer phone that al-
lows, due to an open boot loader, to install modified
Android versions without the need for jailbreaking.
(2) It makes use of a single-core Qualcomm proces-
sor; problems that may arise when measuring energy
requirements during parallel execution are avoided.
(3) It can easily be disassembled in order to get ac-
cess to relevant hardware components. (4) It can be
altered in order to attach measurement lines.
We attached sense resistors to the (direct) voltage
supplies of core, power supplies, etc. A digital oscil-
loscope continuously measures the voltage drops at
theses resistors. Data is sent to and stored/processed
by a a small industrial personal computer that pre-
processes the raw data and calculates energy values
(in Joule) for a predefined time period.
Typically, Android systems run several processes,
services, or threads in parallel. It is not unusual that
after some hours of operations more than 70 threads
or processes are active and thus, are increasing the
system load. Unfortunately, to satisfy all requests, the
system randomly switches between processes (based
on process priorities). In order to exactly measure the
energy demand that is related to a specific software ar-
tifact, switching might introduce measurement errors.
During our studies we had to learn that, although we
are able to identify process switching via triggering,
we cannot guarantee for loss-free measurements. So,
we stripped our custom Android ROM and switched
off as many services and processes as possible.
Most Android apps are written in Java. The
Dalvik VM executes the Java byte code by the line.
Every app is associated to its own VM instance in a
separate GUI thread and may spawn separate threads
and processes if needed. The garbage collector that
manages the memory is an additional error source re-
garding energy measures. Furthermore, the use of
kernel functions (i.e., triggering) is only possible us-
ing JNI that increases complexity and implies limita-
tions of the stripped Android version. So, we used the
Android NDK, aimed for performance critical apps. It
allowed us to execute software directly on the Linux
kernel without using the VM.
4 SOFTWARE-BASED MEASURE
Software-based measurement of power consumption
and energy demands is an interesting alternative to the
previously discussed hardware-based approach. The
advantage being that no additional hardware compo-
nents are required. This allows measurements in the
field and with a short preparation phase. Power and
energy characteristics are measured through the de-
vice’s internal power management software compo-
nents. Technically, these components are used to cal-
culate the remaining uptime of the device.
Most smartphone SDKs provide high-level access
to interpreted power management values in the form
of percentage of full charge, or remaining battery ca-
pacity in mAh. While this information is sufficient to
react to emergency situations (nearly empty battery),
it is not sufficient to make clear statements about the
energy demands of software or software components.
Regarding the source of the power and energy data
that is gathered with a software-based measurement,
two approaches can be distinguished:
In the model-based approach, a cost model re-
garding the power consumption and energy demands
for the hardware of a mobile device is required. For
each component, different operation states have to be
respected (e. g., the Wi-Fi chipset may be in a low-
power sleeping state, or at its highest power setting
while transmitting at high speeds on a weak chan-
nel). Hence, a high level of granularity and accuracy
is required for every feature in the model. The Pow-
erTutor project (PowerTutor, 2011), e. g., used high-
accuracy hardware-based measurements to determine
a device’s power and energy properties. Given the
model, statements regarding the power consumption
of a given software can be made by measuring the in-
tensity of use of the involved hardware components
(e. g., How long was the display turned on?) and their
state (e. g., Which brightness setting was it on?). Inte-
grating the cumulated power consumption of all com-
ponents provides a measure for their energy demand.
Compared to hardware-based measures, this ap-
proach clearly cannot provide the same level of ac-
curacy as it bases on constant values for the power
consumption of individual components. The Power-
Tutor system can reach 99.2 % of accuracy for short
measurement periods (10 s intervals), compared to an
actual hardware measurement (Zhang et al., 2010).
The applicability of the model-based approach is
also limited to the devices included in the model. For
unknown devices, no assumptions can be made as
used hardware components and their characteristics
vary greatly between different devices.
The data-based approach relies on live data.
Some smartphones include an electrical current sen-
sor, which provides in combination with up-to-date
voltage data from the device’s battery all required data
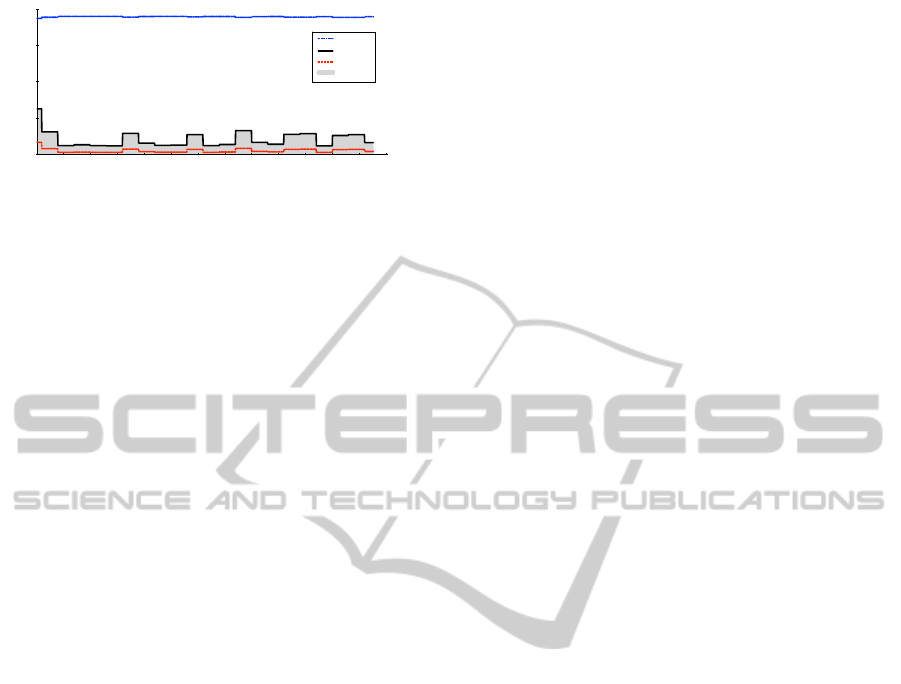
to calculate electrical power (cf. Figure 1).
There are, however, two major drawbacks to this
approach: resolution and availability. In our experi-
ence, the data provided by the smartphones is updated
only at a very low frequency. Values tend to remain
stable for a few seconds, even when there is actually a
OnMeasuringSmartphones'SoftwareEnergyRequirements
167
0 200 400 600 800 1000 1200
4
0
1
2
3
time [samples]
current [A] / power [W] / voltage [V] / energy [J]
voltage
power
current
energy
Figure 1: Data-based software measurement example.
high-frequency oscillation going on. Compared to the
hardware-based approach, where sampling rates in
the range of a few kHz can be achieved, it is possible
to miss short-time fluctuations. Figure 1 illustrates the
low temporal resolution with an exemplary measure-
ment from a HTC Sensation. Samples were logged at
a frequency of 1 Hz. The diagram shows the progres-
sion of electrical current, voltage, and derived from
this data, electrical power. Furthermore, we included
the electrical energy as the area below the electrical
power curve. It is easy to see that peaks (in this case
caused by GPS requests) can be detected, but changes
are abrupt and it is hard to detect short-time fluctua-
tions. One must also note that data is valid only, when
the device is currently not charging. Otherwise, the
current sensor reports the charging current that is not
directly related to the power consumption of the de-
vice. Some devices distinguish charge and discharge
current by signing the value, others provide separate
values, or just one of them. This is directly related to
the second drawback, availability. Electrical current
sensors in smartphone devices are common, but not
guaranteed to be included in every device, and while
some devices include the sensor, they do not expose
its values through the SDK. Despite these drawbacks,
the software-based energy measurement provides an
important opportunity to collect energy-related data
during real-world use of mobile devices in the field.
The approach requires only little preparation, gener-
ated data can easily be analysed and processed, and it
is our theory that the low temporal resolution is still
sufficient for comparative or total demand measures.
5 EVALUATION
As introduced before, the main question underly-
ing this study is: Is the precision and correctness
of software-based measurement sufficient in order to
make statements regarding a software’s energy re-
quirements? We defined and performed a case-study
in order to answer it. Our comparison-based evalu-
ation compares software-based measurement results
against a traditional, hardware-based treatment that
acts as baseline. Data is collected for a set of algo-
rithms of a varying runtime and space complexity. In
detail, we defined simple algorithms for each combi-
nation of the four major complexity classes (i. e., lin-
ear, polynomial, logarithmic, exponential). Each al-
gorithm was executed several times with an ascending
input data size. Hence, we simulated the CPU load
and memory requirement of a broad range of data pro-
cessing applications. To minimise the impact of other
energy demanders we switched off the display and all
wireless communication interfaces and avoided any
user interaction during the measurement phase of the
experiments. Furthermore, we used internal memory
only and removed external storage media.
Hypotheses and Research Questions.
We defined a couple of assumptions prior to the
actual measurements, based on our experiences with
software- and hardware-based energy measurement
experiments:
1. Software-based measurements are sufficient for
comparative and total demand measures.
2. Software-based measurements are not sufficient
for quantitative measures.
3. Software-based measurements require longer
sampling periods (> 10 s), compared to the
hardware-based approach. Sampling period and
accuracy of software-based measurements are
correlated.
Discussion of Results.
In order to assess the quality of the software-based
measurement results, we compared the average and
total deviation between all hardware and software
measurements, and the total amount of measured en-
ergy for both. The first two metrics serve as a measure
for the accuracy of the software-based method.
Average Deviation (ε
avg
) is the average of the
percentaged difference between each measurement
with varying input size n for a algorithm combina-
tion. In our experiment, this measure overvalued the
short measurements as they are overrepresented in our
range of n. Table 1 illustrates the distribution of aver-
age deviation across our experiment runs. The results
indicate that a low average deviation is given for long-
running tasks with an even distribution of the task
times. It severely increases when short-running tasks
are overvalued, like in the poly-poly case. In every
experiment run with polynomial runtime complexity,
we capped n at 750 to avoid extreme task times. As
shown in Table 2, 17 of the total 20 experiment runs in
ICSOFT2012-7thInternationalConferenceonSoftwareParadigmTrends
168
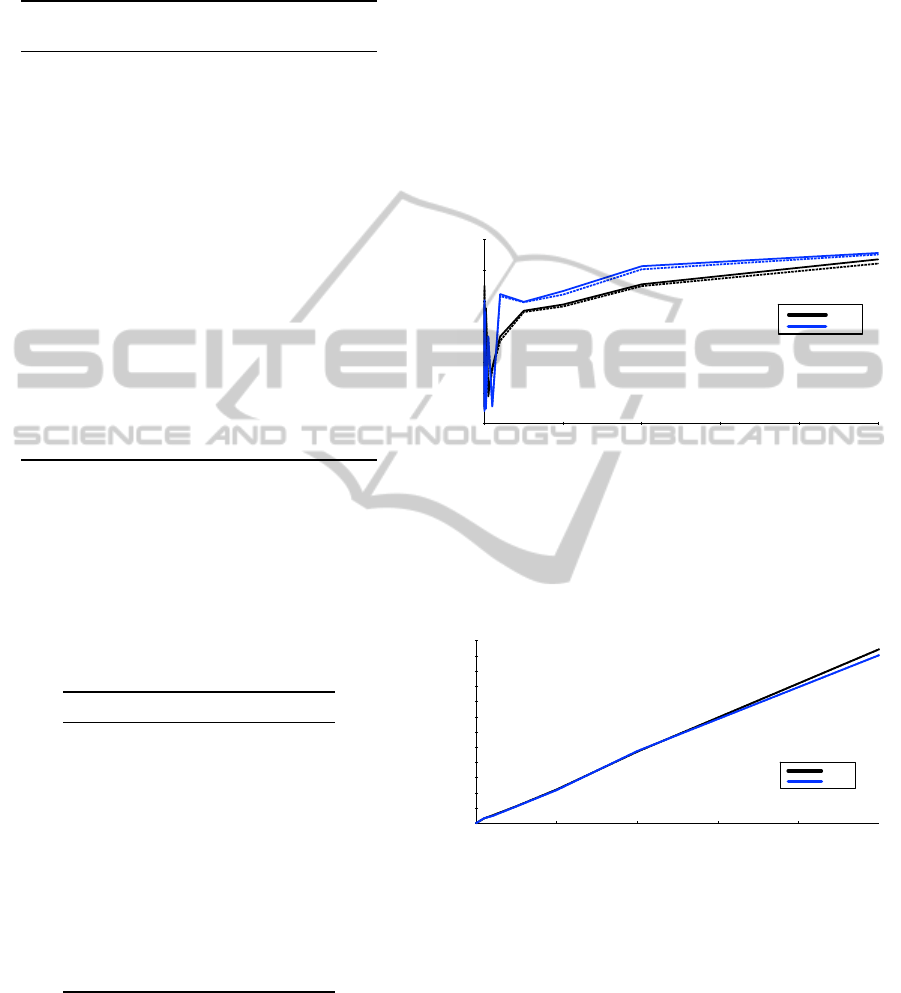
Table 1: Compressed comparison of results. n
max
repre-
sents the maximum n that was used for this algorithm com-
bination. t represents the total runtime for this combination.
Runtime complexity
log lin poly exp
Space complexity
log
ε
avg
6.68% 7.27% 21.22% 243.5%
ε
total
5.52% 5.28% 13.66% 62.42%
n
max
2.5M 2.5M 750 15
t 5.5 s 5.0 s 2.4 s 1.9 s
lin
ε
avg
4.23% 5.76% 19.86% 19.85%
ε
total
4.46% 5.02% 12.58% 13.85%
n
max
2.5M 2.5M 750 15
t 149.2 s 148.9 s 2.7 s 2.0 s
poly
ε
avg
4.43% 5.02% 84.82% 42.36%
ε
total
0.46% 0.41% 6.62% 25.62%
n
max
750 750 750 15
t 31.4 s 30.5 s 30.6 s 2.1 s
exp
ε
avg
4.17% 4.91% 74.59% 6.44%
ε
total
0.08% 0.08% 0.01% 0.10%
n
max
15 15 15 15
t 163.7 s 164.9 s 165.1 s 165.5 s
the poly-poly condition had a task time below 1 s. Be-
cause of the low temporal resolution of the software-
based approach, the peak energy levels during these
short intervals were missed. However, the average de-
viation immediately dropped to 5 % and below with
an increased task time for the 3 runs with larger n.
Table 2: Detailed data for the poly-poly case.
n t [s] E
SW
[J] E
HW
[J] ε[%]
1 0.04 0.0295 0.0998 238.12
2 0.12 0.0810 0.1531 89.07
3 0.08 0.0535 0.1325 147.44
4 0.13 0.0892 0.1674 87.59
5 0.10 0.0686 0.1418 106.57
6 0.06 0.0419 0.1120 167.55
· · ·
15 0.17 0.1361 0.2077 52.58
50 0.32 0.2178 0.2940 35.03
100 0.56 0.3830 0.4592 19.88
250 2.19 1.5119 1.5896 5.14
500 7.98 5.2660 5.3407 1.42
750 17.9 12.4818 12.5578 0.61
Total Deviation (ε
total
) is the percentaged dif-
ference between the cumulated amount of energy of
the hardware measurement and the software measure-
ment, for an algorithm combination. It helps to over-
come the unbalanced expressiveness of the average
deviation as it is more dependent on the total amount
of energy that results from the measurements. Inter-
preting the results confirms our assumption that the
extreme deviations during the experiment runs with
short task times overshadowed the rather low devia-
tions of the longer running tasks with an increased
n. In the poly-poly case, the difference between aver-
age (84.82 %) and total (6.62 %) deviation is immense
and reflects the shortcomings of the software-based
measurement in the cases with short task times.
Total Demand The energy demand over all al-
gorithm combinations and all n was 740.97 J for the
software measure, and 746.98 J for the hardware mea-
sure. So, the difference was 0.81 % only.
1 500,000 1,000,000 1,500,000 2,000,000 2,500,000
0.3
0
0.05
0.1
0.15
0.2
0.25
Energy [J]
log
lin
n
n
Figure 2: Logarithmic space complexity.
Figure 2 illustrates the energy demand for the al-
gorithms with logarithmic space complexity and log-
arithmic and linear runtime complexity. Even at this
small scale (< 0.3 J), the software results (dotted) are
very close to the hardware measurements.
0 500,000 1,000,000 1,500,000 2,000,000
60
0
10
20
30
40
50
log
lin
Energy [J]
n
n
Figure 3: Linear space complexity.
Figure 3 similarly illustrates the energy demand
for the algorithms with linear space complexity and
logarithmic and linear runtime complexity n
max
=
2.5M.
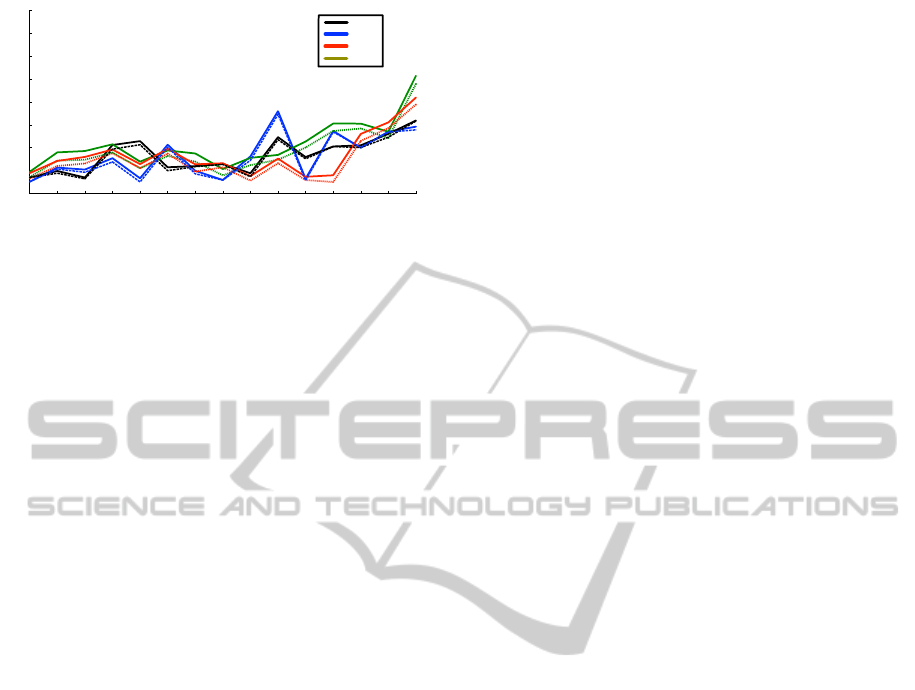
The Figures 4 finally illustrate all algorithm com-
binations for linear space complexity with n
max
capped at 15. It highlights the small differences es-
pecially for experiment runs with low n.
OnMeasuringSmartphones'SoftwareEnergyRequirements
169
151 2 3 4 5 6 7 8 9 10 11 12 13 14
0.4
0
0.05
0.1
0.15
0.2
0.25
0.3
0.35
exp
poly
lin
log
Energy [J]
n
Figure 4: Linear space complexity.
6 CONCLUSIONS AND
OUTLOOK
In this paper, we presented a case study to systemati-
cally examine and compare two approaches for mea-
suring smartphones’ software energy requirements.
First, we created a hardware-based reference setup.
Second, we introduced a software-based approach
that collects and computes energy data provided by
built-in features of the Android OS. Both setups were
used to measure the energy requirements of a repre-
sentative set of algorithms.
The interpretation of the evaluation results
strongly support our hypotheses. The energy values
for the individual n in the algorithm combinations al-
low to reconstruct the typical behavior, as one would
expect from these algorithms. This means, software
measurements are indeed sufficient for comparative
measures (e. g. to test the difference between an al-
gorithm with linear space complexity and an algo-
rithm with polynomial space complexity at n = 15).
Software measurement results are also sufficient for
total demand measures. In our experiment, the de-
viation between the total energy demand, as deter-
mined with the software method, and with the hard-
ware method, was as low as 0.81 %. When applied to
a real-world evaluation with a typically longer experi-
ment runtime, the software method provides valuable
insights into the total energy demand. The nature of
the used data-based approach clearly impedes quanti-
tative measures. As we were only able to gather data
about the system’s overall power consumption and en-
ergy demand, it is not possible to make clear state-
ments regarding the energy demand for individual
components. This strongly supports our hypothesis
that software-based measures are indeed not sufficient
for quantitative measures. The deviation between the
hardware and software measurements strongly cor-
related with the analysed time frame. Due to the
low temporal resolution of the software measurement
method, evaluations with a short runtime (< 2 s) are
error-prone and resulted in a drastic deviation. In fact,
we expected this threshold to be even greater.
During our study, we were able to support our hy-
potheses but, in turn, also identified several open is-
sues that warrant further research. First of all, we have
to validate the robustness of our approach regarding
different hardware platforms. Here, we also need
to support hardware measurements of multithreaded
systems. Furthermore, it is interesting to take a deeper
look into the characteristics of the energy require-
ments of algorithms. Our as well as the cited re-
sults support the impression that algorithms have an
energy signature that would help to define an energy
complexity classification similar to space and runtime
complexity. Finally, we have to take a look onto sys-
tems that provide only a subset of the data used in this
paper for software base energy calculations.
REFERENCES
Bunse, C. and H
¨
opfner, H. (2008). Resource substitution
with components — optimizing energy consumption.
In ICSOFT ’08 Proc., pages 28–35. INSTICC.
Bunse, C., H
¨
opfner, H., Roychoudhury, S., and Mansour, E.
(2011a). Energy efficient data sorting using standard
sorting algorithms. In Software and Data Technolo-
gies, pages 247–260. Springer.
Bunse, C., Klingert, S., and Schulze, T. (2011b).
GreenSLAs for the Energy-efficient Management of
Data Centres. In E-Energy ’11 Proc.
H
¨
opfner, H. and Bunse, C. (2010). Energy Aware Data
Management on AVR Micro Controller Based Sys-
tems. ACM SIGSOFT SEN, 35(3).
H
¨
opfner, H. and Bunse, C. (2011). Energy Aware-
ness Needs a Rethinking in Software Development.
In ICSOFT ’11 Proc., volume 2, pages 294–297.
SciTePress.
Kansal, A. and Zhao, F. (2008). Fine-grained energy pro-
filing for power-aware application design. ACM SIG-
METRICS PER, 36(2):26–31.
Kjærgaard, M. B., Langdal, J., Godsk, T., and Toftkjær, T.
(2009). EnTracked: energy-efficient robust position
tracking for mobile devices. In MobiSys ’09 Proc.,
pages 221–234. ACM Press.
Marwedel, P. (2007). Embedded System Design. Springer.
PowerTutor (2011). A power monitor
for android-based mobile platforms.
http://ziyang.eecs.umich.edu/projects/powertutor/inde
x.html.
Schirmer, M. and H
¨
opfner, H. (2011). SenST: Ap-
proaches for Reducing the Energy Consumption of
Smartphone-Based Context Recognition. In CON-
TEXT ’11 Proc., volume 6967 of LNCS, pages 250–
263. Springer.
Sousa, J. P., Balan, R. K., Poladian, V., Garlan, D.,
and Satyanarayanan, M. (2008). User Guidance of
ICSOFT2012-7thInternationalConferenceonSoftwareParadigmTrends
170

Resource-Adaptive Systems. In ICSOFT ’08 Proc.,
pages 36–44. INSTICC.
Veijalainen, J., Ojanen, E., Haq, M. A., Vahteala, V.-P., and
Matsumoto, M. (2004). Energy Consumption Trade-
offs for Compressed Wireless Data at a Mobile Termi-
nal. IEICE ToC, E87-B(5):1123–1130.
Zhang, L., Tiwana, B., Qian, Z., Wang, Z., Dick, R. P.,
Mao, Z. M., and Yang, L. (2010). Accurate On-
line Power Estimation and Automatic Battery Behav-
ior Based Power Model Generation for Smartphones.
In CODES/ISSS ’10 Proc., pages 105–114. ACM.
OnMeasuringSmartphones'SoftwareEnergyRequirements
171
