
Evaluating Disseminators for Time-critical Information Diffusion on
Social Networks
Yung-Ming Li and Lien-Fa Lin
Institute of Information Management, National Chiao Tung University, Hsinchu, Taiwan
Keywords: Social Networks, Information Diffusion, Time-critical.
Abstract: In recent years, information diffusion in social networks has received significant attention from the Internet
research community driven by many potential applications such as viral marketing and sales promotions.
One of the essential problems in information diffusion process is how to select a set of influential nodes as
the initial nodes to disseminate the information through their social network. Most of the existing solutions
aim at how to maximize the influence effectiveness of the initially selected "influential nodes", but pay little
attention on how the influential nodes selection could minimize the cost of the diffusion. Diffusion
effectiveness is important for the applications such as innovation and new technology diffusion. However,
many applications, such as disseminating disaster information or product promotions, have the mission to
deliver messages in a minimal time. In this paper, we design and implement an efficiently k-best social sites
selected mechanism in such that the total diffusion “social cost” required for each user in this social
network to receive the diffusion critical time information is minimized.
1 INTRODUCTION
A social network is a social structure made of
individuals or organizations that are tied by one or
more specific types of inter-dependencies, such as
friendship, co-authorship, collaboration, etc. On line
social networking has become a very popular
application in the era of Web 2.0, which enables the
users to communicate, interact and share on the
World Wide Web. Online social networking turns
out to be part of human life. Facebook, YouTube,
LinkedIn, Flickr, Orkut, are some of the prominent
online social networking websites which ease the
interfaces for online content sharing like photo
sharing, video sharing and professional networking.
Recently social networks have received a high level
of attention due to their capability in improving the
performance of web search, recommendations using
collaborative filtering systems, new technology
spreading in the market using viral marketing
techniques, etc.
Generally, social networks play a vital role for
the spread of an innovation or technology or
information within a population of individuals. A
piece of information can propagate from one node to
another node through a link on the network in the
form of “word-of-mouth” communication. The
interpersonal relationships (or ties or links) between
individuals could cause significantly change or
improvement in the social system because the
decisions made by individuals are influenced
heavily by the behavior of their neighbors.
Therefore, to enhance power of information
diffusion on a social network, it is beneficial to
discover the influential nodes which can strongly
affect the behavior of their neighbors. It is an
essential issue to find a small subset of influential
individuals in a social network such that they can
influence the largest number of people in the
network (Wang et al., 2001).
Finding a subset of influential individuals has
many applications. Recall that the motivating
example given by Kempel et al. (2009). Consider a
social network together with the estimates for the
extent to which individuals influence one another,
and the network performs as the platform for
marketing. A company would like to market a new
product, hoping it will be adopted by a large fraction
of the network. The company plans to initially target
a small number of "influential" individuals of the
network by giving them free samples of the product
(the product is expensive or the company has
limited budge so that they can only choose a small
251
Li Y. and Lin L..
Evaluating Disseminators for Time-critical Information Diffusion on Social Networks.
DOI: 10.5220/0004072002510260
In Proceedings of the International Conference on Data Communication Networking, e-Business and Optical Communication Systems (ICE-B-2012),
pages 251-260
ISBN: 978-989-8565-23-5
Copyright
c
2012 SCITEPRESS (Science and Technology Publications, Lda.)

number of people). The company hopes that the
initially selected users will recommend the product
to their friends, their friends will influence their
friends’ friends and so on, and thus many
individuals will ultimately adopt the new product
through the powerful word-of-mouth effect (or
called viral marketing).
Finding influential nodes is one of the central
problems in social network analysis. Thus,
developing efficient and practical methods of doing
this on the basis of information diffusion is an
important research issue. Commonly used
fundamental probabilistic models of information
diffusion are the independent cascade (IC) model
(Goldenberg et al., 2001); (Kempe et al., 2003);
(Gruhl et al., 2004) and the linear threshold (LT)
model (Watts, 2002); (Kempe et al., 2003).
Researchers studied the problem of finding a limited
number of influential nodes that are efficient for the
spread of information under the above models
(Kempe et al., 2003); (Kimura et al., 2007); (Kimura
et al., 2010). This problem is called the influence
maximization problem. Kempe et al. (2003) showed
on large collaboration networks that the greedy
algorithm can give a good approximate solution to
this problem, and mathematically proved a
performance guarantee of the greedy solution (i.e.,
the solution obtained by the greedy algorithm). The
influence maximization problem has applications in
sociology and “viral marketing” (Agarwal and Liu,
2008), and was also studied in a descriptive
probabilistic model of interaction (Domingos and
Richardson, 2001); (Richardson and Domingos,
2002). The problem has recently been extended to
influence control problems such as a contamination
minimization problem (Kimura et al., 2009a).
Early alert's situational awareness services
enhance the command and control and decision-
making process by helping users keep abreast of
rapidly changing conditions, execute operational
plans, and prepare for future actions.
In this paper, we study the problem for
disseminating the emergence information (ex, storm
surge, inland flooding, winter and severe weather,
earthquakes and tsunamis and critical time
promotion) through a social network. These
problems are usually significant in practice,
especially for cases where the influence is
meaningful only in a short period time. Our goal is
to minimize the total social cost for all users in a
social network to receive such information. The
major contributions of this paper as summarized as
follows.
- We present a minimize “social cost” information
dissemination, namely the K Best Disseminators,
which is indeed an important type of social network
influence diffusion with many real applications.
- We propose a naïve approach to process the
KBDD and also analyze the processing cost required
for this approach.
- An efficient algorithm, name the K Best
Disseminators (KBDD) algorithm, operates by the
support of R-tree and Voronoi diagram to improve
the performance of KBDD.
The remaining area of the paper is structured as
follows. Section 2 reviews the related literature in
the area of viral marketing and social networks.
Section 3 meant for the materials and methods used
and formulate research problem (K-Best
Disseminators-KBDD). Disseminator’s model with
social cost is presented in Section 4. In Section 5, a
naïve approach and its cost analysis are presented.
Section 6 describes the KBDD algorithm with the
used indexes. Performance evaluation is presented
in Section 7. Finally, we conclude the paper along
with future research direction as mentioned in
Section 8.
2 RELATED LITERATURE
2.1 Viral Marketing and Influential
Users
Word of mouth (WOM), one of the most ancient
mechanisms in the history of human society, is
being given new significance by this unique
property of the Internet. Recently WOM
communication has received scholarly attention in
the research areas of opinion leadership,
interpersonal influence, and diffusion of innovation.
WOM play a vital role in influencing attitudes and
behaviors, especially with regard to the diffusion of
innovations (Kardes and Kim, 1991). Diffusion
studies have provided useful information in
identifying the role of communication channels,
characteristics of potential adopters (e.g., innovators
and early adopters), and major stages in the
adoption process.
Online WOM (i.e., viral marketing) has become
a common topic of research in the area of computer-
mediated communication, particularly in the context
of consumer-to-consumer interactions. Powered by
such tools as email, instant messenger, chat rooms,
weblogs, and bulletin boards, online WOM
ICE-B2012-InternationalConferenceone-Business
252

communication has helped give rise to different
types of online communities. Viral marketing is a
new marketing method, which uses electronic
communications to trigger brand messages
throughout a widespread network of buyers.
Regarding the study of viral marketing, Dobele
et al. (2005) studied several real marketing cases
and analyze why they need viral marketing, and how
to use it successfully. Dobele et al. (2007) showed
that emotion has more impact than the expectation
of recipient in the successful message passing. They
also stated that marketing to several influential
people will perform better than sending message to
everyone and that is what we want to achieve.
Richardson and Domingos (2002) utilized
probabilistic models and data from knowledge-
sharing sites to design the best viral marketing plan.
2.2 Social Networks and Social
Analysis
A social network is a social structure made up of
individuals (or organizations) called "nodes", which
are tied (connected) by one or more specific types of
interdependency, such as friendship, kinship,
common interest, financial exchange, dislike, sexual
relationships, or relationships of beliefs, knowledge
or prestige. There are three important elements
included in a social network: actors, ties, and
relationships. Actors are the essential elements in
the social network to define the people, events or
objects. Ties are used to construct the relationship
between actors by using a mean of path to establish
the relationship directly or indirectly. Ties can also
be divided into strong and weak tie according to the
strength of the relationships; they are also useful for
discovering subgroups of the social network.
Relationships are used to illustrate the interactions
and relationships between two actors. Furthermore,
different relationships may cause the network to
reflect different characteristics (Easley and
Kleinberg, 2010).
Social networks are usually modeled by graphs,
where nodes represent individuals and edges
represent the relationships between pairs of
individuals (Easley and Kleinberg, 2010). Such
graphs are either “directed” or “undirected”, and
“weighted” or “unweighted”. In weighted graphs,
the weights of edges represent the level of
relationship or influence between individuals.
Several diffusion models have been proposed to
analyze the diffusion of innovation in social
networks. The widely studied models can be
generalized into the categories of threshold models
and cascade models (Easley and Kleinberg, 2010).
Different researchers carried out various aspects
in different dimensions of datasets using social
network analysis. In order to examine how friends
affect one’s decision to get vaccinated against the
flu, 2007 Neel combine information on social
networks with medical records and survey data.
Domingos and Richardson (2001) study the
influence maximization problem and propose a
probabilistic solution. Kempe et al. (2009a)
formulate the problem of finding a set of influential
individuals as an optimization problem.
Different definitions of influential nodes lead to
different computational challenges. In the
blogosphere, there is significant research in the
identification of influential blogs (Gruhl et al., 2004)
and bloggers (Agarwal and Liu, 2008);
(Mathioudakis and Koudas, 2009). For example,
Gruhl et al. (2004) study information diffusion of
various topics in the blogosphere. Their focus is on
studying how the topics propagate or how “sticky”
the topics are. In these cases, the authors define a
metric that determines the influence potential of a
blogger. Similarly, for marketing surveys, the
problem of identifying the set of early buyers has
been addressed. The focus is on developing efficient
algorithms for identifying the top-k influential
nodes. Information propagation models have been
considered in the context of influence maximization
(Kimura et al., 2010).
The focus of those works is on identifying the
set of nodes in the network that need to be targeted,
so that the propagation of a product or an idea
spreads as much as possible. In influence
maximization, the goal is to identify the nodes that
will cause the most propagation effect in the
network. Finding the set of the most influential
nodes is a well-known problem in social networks
analysis (Kimura et al., 2010). Different from the
above works, we consider the problem of
minimizing the total time delay of all users in a
social network getting the emergent information.
3 PROBLEM DEFINITION
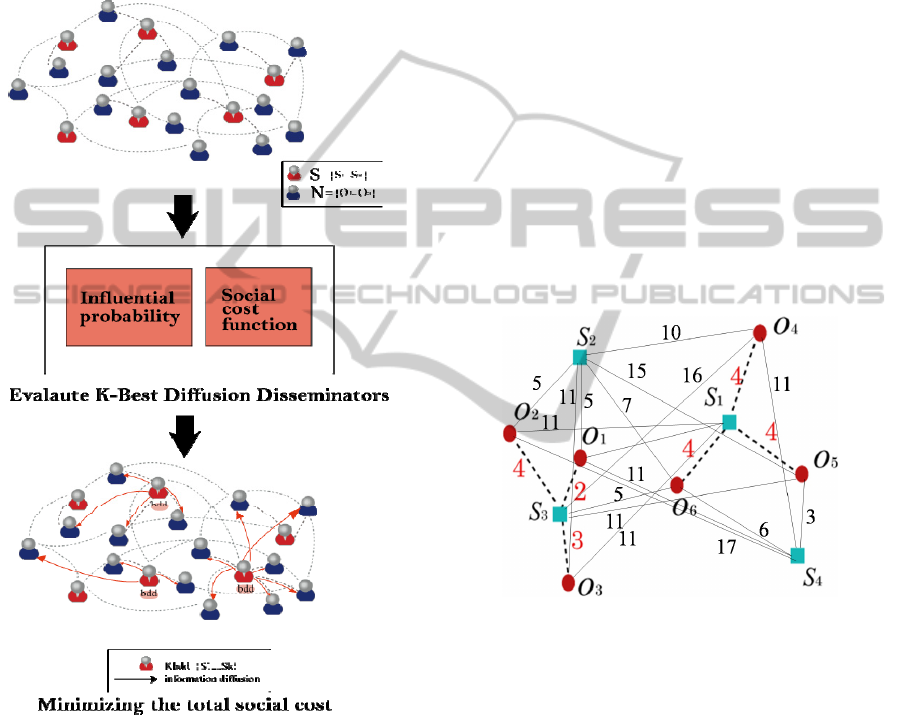
Figure 1 gives an illustration to present our problem.
The social network includes totally N+S nodes, S of
them are people with sufficient capability as serving
as diffusion seeds these sites are predefined,
registered or contracted. Given a set of social nodes
O, a set of sites S, and a user-given value K, a
EvaluatingDisseminatorsforTime-criticalInformationDiffusiononSocialNetworks
253
KBDD retrieves the K sites s
1
, s
2
, ..., s
K
from S such
that sc(o
i
,s
j
)
i
oO∈ is minimized, where sc(o
i
,s
j
)
refers the social cost to successfully distribute the
time-critical information between nodes o
i
and its
closest site s
j
∈ {s
1
, s
2
, ..., s
K
}. We term the sites
retrieved by executing KBDD the best diffusion
disseminators (or bdd for short).
Social Network
Figure 1: K-best diffusion disseminators problem.
The KBDD (K-best Disseminators) problem
arises in many fields and application domains. As an
example of real-world scenario, consider a company
has a time-limited deal for a special group. In order
to propagate this message to this special group as
soon as possible; the company may want to choose
the K influential users from this group to propagate
this message. To achieve the fastest diffusion
information, the sum of diffusion time delay from
each group member to its closest influential node
should be minimized.
Another real-world example is that an
earthquake or a tsunami occurs in a city. In order to
reduce the damage of earthquake or tsunami, how to
quickly propagate the emergency alert to people is
the most import thing. In this case, the top-k opinion
leaders of the organization should be chosen to
propagate information so that people can obtain
information immediately.
Let us use an example in Figure 2 to illustrate
the KBDD problem, where six nodes o
1
, o
2
, ..., o
6
and four sites s
1
, s
2
, ..., s
4
are depicted as circles and
rectangles, respectively. Assume that two best
Disseminators (i.e., 2bdd) are to be found in this
example. There are six combinations (s
1
, s
2
), (s
1
,
s
3
), ... , (s
3
, s
4
), and one combination would be the
result of KBDD. As we can see, the sum of diffusion
social cost from objects o
1
, o
2
, o
3
to their closest site
s
3
is equal to 9, and the sum of social cost between
objects o
4
, o
5
, o
6
and site s
1
is equal to 12. Because
combination (s
1
, s
3
) leads to the minimum total
social cost (i.e., 9 + 12 = 21), the two sites s
1
and s
3
are the 2bdd.
Figure 2: An example of KBDD.
4 THE MODEL
4.1 Mapping Influence Probability to
Diffusion Social Cost
Goyal et al. (2010) present the concept of user
influential probability and action influential
probability. The assumption is that if user v
i
performs an action y at time t and later (t′ > t) his
friend v
j
also perform the action, then there is an
influence from v
i
on v
j
. The goal of learning
influence probabilities (Goyal et al, 2010) is to find
a model (static representation of dynamic system) to
best capture the information of user influence and
action influence using the network of information
ICE-B2012-InternationalConferenceone-Business
254
diffusion social cost (sc). A node with a high value
of influential probability (IP) to other social nodes
reveals it is easier for him/her to affect other nodes
in propagating an idea or an advertisement across
the network. It takes less social cost for a node to
receive the message from a node with higher IP than
from a node with low IP. Hence, we define the
social cost is inversely proportional to the IP. Figure
3(a) illustrates a general influential probability
network. The influential probability can be
interpreted as the successful rate of information
propagated from disseminator to social nodes
directly or indirectly. Indirect influential probability
is depicted by a dotted line, which is derived based
on the production rule. Figure 3(b) shows a
diffusion social cost network, which is transferred
from Figure 3(a).
(a) Influential Probability (b) Diffusion Social Cost
Figure 3: Transfer diffusion probability network to
diffusion social cost network.
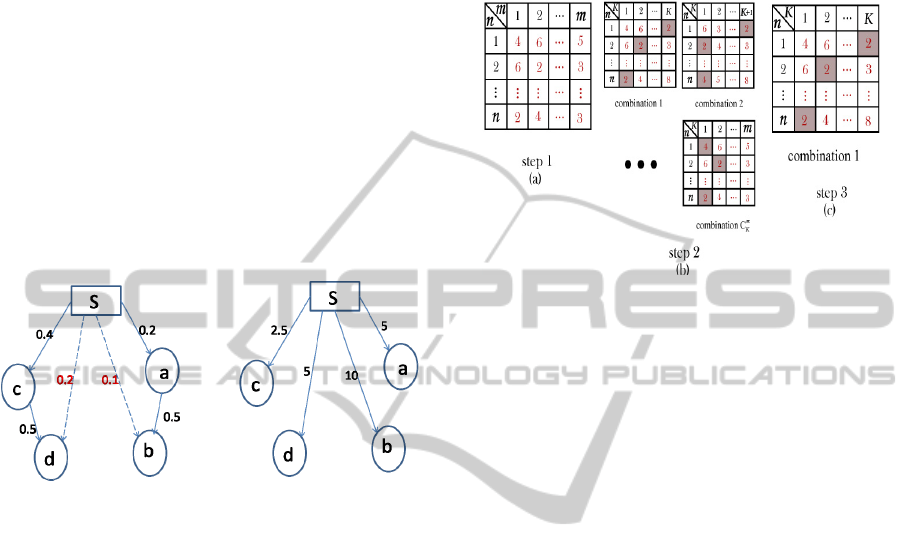
5 NAÏVE APPROACH
In this section, we first suggest a straightforward
approach to solve the KBDD problem, and then
study the processing cost required for this approach.
Assume that there are n nodes and m sites, and the K
bdd would be chosen from the m sites. The
straightforward approach basically includes three
steps.
The first step is to compute the information
diffusion social cost sc(o
i
,s
j
) from each social node
o
i
(1 ≤ i ≤ n) to each site s
j
(1 ≤ j ≤ m). Since the K
best sites needed to be retrieved, there are totally
C
K
m
possible combinations and each of the
combinations has K sites.
The second step is to consider all of the
combinations. For each combination, the diffusion
social cost from each node to its closest site is
determined so as to compute the total diffusion
social cost.
In the last step, the combination of K sites
having the minimum total diffusion social cost is
chosen to be the diffusion strategy of KBDD. The
procedure of the straightforward approach is
detailed in Algorithm 1.
Figure 4: Naïve approach.
Figure 4 illustrates the three steps of the naive
approach. As shown in Figure 4(a), the diffusion
social cost between social nodes and sites are
computed and stored in a table, in which a tuple
represents the diffusion social cost from a social
node to all sites. Then, the
C
K
m
combinations of K
sites are considered so that
C
K
m
tables are generated
(shown in Figure 4(b)). For each table, the minimum
attribute value of each tuple (marketed with gray
box) refers to the diffusion social cost between a
social node and its closest site. As such, the total
diffusion social cost for each combination can be
computed by summing up the minimum attribute
value of each tuple. Finally, in Figure 4(c) the
combination 1 of K sites can be the K bdd because
its total diffusion social cost is minimum among all
combinations.
As the naive approach includes three steps, we
consider the three steps individually to analyze the
processing cost. Let m and n be the numbers of sites
and nodes, respectively. Then, the time complexity
of the first step is m × n because the diffusion social
cost between all nodes and sites has to be computed.
In the second step,
C
K
m
combinations are considered
and thus the complexity is
C
K
m
× n × K. Finally, the
combination having the minimum total diffusion
social cost is determined among all combinations so
that the complexity of the last step is
C
K
m
. The
processing cost of the straightforward approach is
represented as m×n+
C
K
m
×n×K+
C
K
m
.
EvaluatingDisseminatorsforTime-criticalInformationDiffusiononSocialNetworks
255

Algorithm 1: The Naïve approach.
Input: A number K, a set of n social
nodes with influential
probability, and a set of m
sites.
Output : The K best Disseminators bdd
/* Step 1
for each node o
i
do
for each site s
j
do
compute the diffusion social cost
sc(o
i
,s
j
) diffusion information
from o
i
to s
j
;
/* Step 2
for each combination
c∈ C
K
m
do
for each node o
i
do
compute the diffusion social cost
sc (o
i
,s
j
) from o
i
to its closet
site s
j
;
compute the total diffusion social
cost sc
c
for combination c as
(
)
∑
i
o
ji
sosc ,
/* Step 3
return the combination c having the
minimum total diffusion social
cost;
6 KBDD ALGORITHM
The above approach is performed without any index
support, which is a major weakness in dealing with
large datasets. In this section, we propose the KBDD
algorithm combined with the existing indexes R-tree
(Guttman, 1984) and Voronoi diagram (Franz
Aurenhammer, 1991) to efficiently process the
KBDD. In order to apply the proposed algorithm,
the nodes in the diffusion social cost network should
be transformed to points in a 2-dimensional
Euclidean space.
Some dimensionality reduction
methods (e.g.; Multi-Dimensional Scaling (MDS) can be
used for converting distance information into coordinate
information
(Asano et al., 2009). Besides, we need to
find the closest site s for each object o (that is,
finding the RNN o of site s). Since the Voronoi
diagram can be used to effectively determine the
RNN of each site (Zhang et al., 2003), we divide the
data space so that each site has its own Voronoi cell.
For example, in Figure 5(b), the four sites s
1
, s
2
, s
3
,
and s
4
have their corresponding Voronoi cells V
1
,
V
2
, V
3
, and V
4
, respectively.
Taking the cell V
1
as an example. If node o lies
in V
1
, then o must be the RNN of site s
1
. Based on
this characteristic, node o needs not be considered in
finding the RNNs for the other sites. With Voronoi
diagram, the following pruning criteria can be used
to greatly reduce the number of social nodes
consider in query processing.
Pruning Nodes. Given an node o and the K sites s
1
,
s
2
, ..., s
K
, if o lies in the Voronoi cell V
i
of one site s
i
∈ {s
1
, s
2
, ..., s
K
}, then the diffusion social cost
between node o and the other K − 1 sites need not
be computed so as to reduce the processing cost.
With Voronoi diagram index approach, the
processing is represented as (log m)×n+
C
K
m
×n×K+
C
K
m
.
The R-tree was proposed by Antonin Guttman in
1984 and has found significant use in both research
and real-world application. The key idea of the data
structure is to group nearby objects and represent
them with their minimum bounding rectangle in the
next higher level of the tree; the "R" in R-tree is for
rectangle. Since all objects lie within this bounding
rectangle, a query that does not intersect the
bounding rectangle also cannot intersect any of the
contained objects. At the leaf level, each rectangle
describes a single object; at higher levels the
aggregation of an increasing number of objects.
Therefore, we use the R-tree, which is a height-
balanced indexing structure, to index the social
nodes.
In a R-tree, nodes are recursively grouped in a
bottom-up manner according to their locations. For
instance, in Figure 5(a), eight objects o
1
, o
2
, ..., o
8
are grouped into four leaf nodes E
4
to E
7
(i.e., the
minimum bounding rectangle (MBR) enclosing the
objects). Then, nodes E
4
to E
7
are recursively
grouped into nodes E
2
and E
3
, which become the
entries of the root node E
1
.
Combined with the R-tree and Voronoi diagram,
we design the following pruning criteria to greatly
reduce the number of social nodes considered in
query processing.
Pruning Nodes. Given a node o and the K sites s
1
,
s
2
, ..., s
K
, if o lies in the Voronoi cell V
i
of one site s
i
∈ {s
1
, s
2
, ..., s
K
}, then the diffusion social cost
between node o and the other K − 1 sites need not be
computed so as to reduce the processing cost.
Pruning MBRs. Given a MBR E enclosing a
number of nodes and the K sites s
1
, s
2
, ..., s
K
, if E is
ICE-B2012-InternationalConferenceone-Business
256

fully contained in the cell V
i
of one site s
i
∈ {s
1
, s
2
,
..., s
K
}, then the diffusion social cost from all nodes
enclosed in E to the other K − 1 sites would not be
computed.
(a) (b)
Figure 5: R-tree and Voronoi diagram.
To find the K
bdd
for the KBDD, we need to
consider
C
K
m
combinations of K sites. For each
combination of K sites s
1
, s
2
, ..., s
K
with their
corresponding Voronoi cells V
1
, V
2
, ..., V
K
, the
processing procedure begins with the R-tree root
node and proceeds down the tree. When an internal
node E (i.e., MBR E) of the R-tree is visited, the
pruning criterion 2 is utilized to determine which
site is the closest site of the nodes enclosed in E. If
the MBR E is not fully contained in any of the K
Voronoi cells, then the child nodes of E need to be
further visited. When a leaf node of the R-tree is
checked, the pruning criterion 1 is imposed on the
entries (i.e., nodes) of this leaf node. After the
traversal of the R-tree, the total diffusion social cost
for the combination of K sites s
1
, s
2
, ..., s
K
can be
computed. By taking into account the total
combinations, the combination of K sites whose
total diffusion social cost is minimum would be the
diffusion strategy of the KBDD. Algorithm 2 gives
the details for the KBDD algorithm.
Figure 6 continues the previous example in
Figure 5 to illustrate the processing procedure,
where there are eight nodes o
1
to o
8
and four sites s
1
to s
4
in social network. Assume that the combination
(s
2
,s
3
) is considered and the Voronoi cells of sites s
2
and s
3
are shown in Figure 6(a). As the MBR E2 is
not fully contained in the Voronoi cell V
2
of site s
2
,
the MBRs E
4
and E
5
still need to be visited. When
the MBR E
4
is checked, based on the pruning
criterion 2 the distances from nodes o
1
and o
2
to site
s
3
would not be computed because their closest site
is s
2
. Similarly, the closest site of the nodes o
7
and
o
8
enclosed in MBR E
7
is determined as site s
3
.
Figure 6: KBDD algorithm.
Algorithm 2: The KBDD algorithm.
Input: A number K, a set of n nodes
indexed by R-tree, and a set of m
sites index by Voronoi diagram.
Output: The K best Disseminators bdd
create an empty queue Q;
for each combination
c∈ C
K
m
do
insert the root node of R-tree into Q;
while Q is not empty do
de-queue q;
if q corresponds to an internal
node E
i
then
if E
i
is fully contained in a
voronoi cell V
j
then
for each node o
i
enclosed in
E
i
do
compute the diffusion
social cost sc(o
i
,s
j
) from
o
i
to site s
j
;
else
insert child nodes of E
i
into
Q;
else
if o
i
is enclosed by a voronoi
cell V
j
then
compute the diffusion social
cost sc(o
i
,s
j
) from o
i
to site
s
j
;
compute the total diffusion social
cost sc
c
for combination c as
(
)
∑
i
o
ji
sosc ,
;
return the combination c having the
minimum total diffusion social
cost;
EvaluatingDisseminatorsforTime-criticalInformationDiffusiononSocialNetworks
257

As for nodes o
3
to o
6
, their closest sites can be
found based on the pruning criterion 1. Having
determined the closest site of each node, the total
distance for combination (s
2
, s
3
) is obtained.
Consider another combination (s
2
, s
4
) shown in
Figure 6(b). The closest site s
2
of four nodes o
1
to o
4
enclosed in MBR E
2
can be found when E
2
is
visited. Also, we can compute the total distance for
the combination (s
2
, s
4
) after finding the closest sites
for nodes o
5
to o
8
. By comparing the diffusion social
cost for all combinations, the 2
bdd
are retrieved.
We use an example to illustrate how the KBDD
algorithm works. For the combination (s
2
, s
3
), when
the MBR E
4
is visited, because E
4
is fully contained
in site s
2
’s V
2
, the closest site of objects o
1
and o
2
enclosed in E
4
is site s
2
. Therefore, the distances
form objects o
1
and o
2
to site s
3
need not be
computed. Similarly, for the combination (s
2
, s
4
),
MBR E
2
is fully contained in site s
2
’s V
2
so that the
distances from objects o
1
, o
2
, o
3
, and o
4
, to site s
4
need not be computed. Based on the proposed
pruning criterion, the performance of KBDD can be
improved because many unnecessary distance
computations are reduced. With Voronoi diagram +
R-tree index approach, the processing is represented
as (log m)×(log n)+
C
K
m
×n×K+
C
K
m
.
7 PERFORMANCE
EVALUATION
7.1 Experimental Setting
All experiments are performed on a PC with Intel
Pentium 4 3.0 GHZ CPU and 4 GB RAM. The
algorithm is implemented in JAVA 2 (j2sdk-
1.4.0.01). One synthetic social network consisting of
1K social nodes is used in our simulation. The
performance is measured by the total running time
in k-best social sites selected from m candidate
Disseminators for initial influence diffusion such
that all the total diffuse social cost which all social
nodes in this social network may get the diffusion
critical time information is minimize.
The performance is measured by total running
time of process KBDD query. To exploit the
efficiency of the proposed k-best diffusion site
algorithm, we compare the performance of our
approach with the Naive approach (that operates
without the support of index). Table 1 summarizes
the parameters under investigation, along with their
ranges and default values. The number (#social
nodes) of the metric social nodes in a social network
varies from 1,000 to 10,000. The candidate social
node for initial influence diffusion metric S is 25.
The user gives the best influence Disseminators K is
5. The final statistic result is an average value of 100
experiments. The program used for experiment is
modified with the Voronoi diagram code of
Fortune’s algorithm (http://www.cs.sunysb.edu/
~algorith/implement/fortune/implement.shtml) and
the R-tree codes of R-tree Portal
(http://www.rtreeportal.org/).
Table 1: System parameters.
Parameter Default Range
Number of social nodes (N) 1K 1K, 5K, 10K
Diffusion site candidates (S) 25
Number of best diffusion site (K) 5
Figure 7: Influence of the number of considered social
nodes on performance.
Figure 7 studies the effect of various numbers of
considered social nodes (varying n from 1k to 10k)
on the performance of processing K bdd queries.
Note that Fig. 7 uses a logarithmic scale for the y-
axis. As we can see in Figure 7, the running time
(i.e., the CPU time required to find the K bdd) of
naïve approach increases with the increasing N. The
reason is that as N becomes greater, the amounts of
social cost that need to be computed increases so
that more cost spent on for finding their
corresponding K bdd is required. However, the
experimental result shows that the running time of
the KBDD approach is basically a constant for
various numbers of social nodes. This indicates that
for most of the cases the system’s running time is
acceptable. Even when the number of social nodes
increases up to more than 10K, the running time still
increases with a slow rate within a fairly acceptable
range. This result indicates that the performance of
ICE-B2012-InternationalConferenceone-Business
258

the KBDD algorithm is insensitive to the numbers
of considered social nodes. This is mainly because
Voronoi Diagram index approach largely reduces
the amount of social cost computation between the
social nodes and Disseminators and hence the effect
of the increase social nodes can be alleviated. With
the R-tree index, the KBDD algorithm decreases the
amount of the search of social nodes is nearest to
which diffusion site hence the running time can be
improved. From the experimental results, we find
that KBDD approach is more suitable for the highly
dynamic environments in which the social network
changes its scale of network size frequently.
8 CONCLUSIONS
In this paper, we study the problem for diffusing the
emergence information through social network. Our
goal is to minimize the "social cost" to reach
(successfully distribute the time-critical information)
"all" the users in the social network. To solve the
KBDD problem, we first proposed a straightforward
approach and then analyzed its processing cost. In
order to improve the performance of processing the
KBDD, we further proposed a KBDD algorithm
combined with the R-tree and Voronoi diagram to
greatly reduce the costs. Our next step is to process
the KBDD for social nodes with dynamic influential
probability.
ACKNOWLEDGEMENTS
The authors are grateful for the financial support of
National Science Council (NSC: 99-2410-H-009-
035-MY2).
REFERENCES
Agarwal N and Liu H., (2008) Blogosphere: research
issues, tools, and applications. SIGKDD Explorations
10(1): 18–31.
Asano, T., Bose, P., Carmi, P., Maheshwari, A., Shu, C.,
Smid, M., (2009). A linear-space algorithm for
distance preserving graph embedding. Computational
Geometry, 42(4), 289-304.
Domingos P., (2005) Mining social networks for viral
marketing. IEEE Intelligent Systems 20(1):80–82.
Domingos P., Richardson M., (2001) Mining the network
value of customers. In Proceedings of the seventh
ACM SIGKDD international conference on knowledge
discovery and data mining, San Francisco, CA, August
2001, pp. 57–66.
Easley and Kleinberg, (2010) Networks, Crowds, and
Markets: Reasoning about a Highly Connected World.
Cambridge University Press, Draft version: June 10,
2010.
Franz Aurenhammer, (1991). Voronoi Diagrams - A
Survey of a Fundamental Geometric Data Structure.
ACM Computing Surveys, 23(3):345-405, 1991.
Goldenberg, J., Libai, B. and Muller, E., (2001) Talk of
the network: A complex systems look at the
underlying process of word-of-mouth. Marketing
Letters 12:211–223.
Goyal, A., Bonchi, F., Lakshhmanan, L. V. S., (2010)
Learning influence probabilities in social networks.
Proceedings of the third ACM international
conference on Web Search and Data Mining. 241–250.
Gruhl, D., Guha, R., Liben-Nowell, D. and Tomkins, A.,
(2004) Information diffusion through blogspace. In
Proceedings of the 7th International World Wide Web
Conference, 107–117.
Guttman, “R-Trees: A Dynamic Index Structure for
Spatial Searching,” Proceedings of the 1984 ACM
SIGMOD international conference on Management of
data, 47-57, 1984.
Herr, P. M., Kardes, F. R., & Kim, J. (1991). Effects of
word-of-mouth and product-attribute information on
persuasion: An accessibility-diagnosticity perspective.
Journal of Consumer Research, 17 (4), 454-462.
Kempe, D., Kleinberg, J.,and Tardos, E., (2003)
Maximizing the spread of influence through a social
network. In Proceedings of the 9th ACM SIGKDD
International Conference on Knowledge Discovery
and Data Mining, 137– 146.
Kimura, M., Saito, K., Nakano, R., (2007) Extracting
influential nodes for information diffusionon a social
network. Proceedings of the 22nd AAAI Conference on
Artificial Intelligence 1371–1376.
Kempe, D., Kleinberg, J., and Tardos, E., (2005)
Influential nodes in a diffusion model for social
networks. In International colloquium on automata,
languages and programming No32, 1127–1138.
Kimura M., Saito K., Motoda H., (2009a) Blocking links
to minimize contamination spread in a social network.
ACM Transactions on Knowledge Discovery from
Data 3(2):9:1–9:23
Kimura M., Saito K., Motoda H., (2009b) Efficient
estimation of influence functions for SIS model on
social networks. In Boutilier C. (ed). Proceedings of
the 21st international joint conference on artificial
intelligence, Pasadena, CA, July 2009, pp. 2046–2051
Kimura M., Saito K., Nakano R., Motoda H., (2010)
Extracting influential nodes on a Social Network for
information. Data Mining and Knowledge Discovery
20(1): 70–97.
Mathioudakis and N. Koudas, (2009) Efficient
identification of starters and followers in social media.
In EDBT, pages 708–719.
EvaluatingDisseminatorsforTime-criticalInformationDiffusiononSocialNetworks
259

Richardson M., Domingos P., (2002) Mining knowledge-
sharing sites for viral marketing. In Proceedings of the
Eighth ACM SIGKDD international conference on
knowledge discovery and data mining, Edmonton,
Alberta, Canada, July 2002, pp. 61–70
Saito K., Kimura M., Motoda H., (2009) Discovering
influential nodes for SIS models in social networks. In
Gama J., Costa V. S., Jorge A. M., Brazdil P (eds).
Proceedings of the 12th International Conference of
Discovery Science, Porto, Portugal, October 2009.
Lecture Notes in Computer Science 5808, Springer,
pp. 302–316.
Saito, K., Kimura, M., Nakano, R., Motoda, H., (2009)
Finding influential nodes in a social network from
information diffusion data. In: Proceedings of the
International Workshop on Social Computing and
Behavioral Modeling 138–145.
Scott, J., (2002) Social Network Analysis: Critical
Concepts in Sociology, New York, Routledge
Publisher.
Watts, D. J., (2002): A simple model of global cascades
on random networks. Proceedings of National
Academy of Science, USA 99 (2002) 5766–5771 10.
Watts, D. J., Dodds, P. S.: Influence, networks, and public
opinion formation. Journal of Consumer Research 34
(2007) 441–458.
Yu Wang, Gao Cong, Guojie Song, Kunqing Xie, (2010)
Community-based Greedy Algorithm for Mining Top-
K Influential Nodes in Mobile Social Networks.
Proceedings of the 16th ACM SIGKDD international
conference on Knowledge discovery and data mining.
Zhang, Zhu, Papadias, Tao, and Lee, (2003) Location-
based spatial queries, in ACM SIGMOD, San Diego,
California, USA, June 9-12.
ICE-B2012-InternationalConferenceone-Business
260
