
An Idea for Universal Generator of Hypotheses
Grete Lind and Rein Kuusik
Informatics, Tallinn University of Technology, Raja 15, 12618, Tallinn, Estonia
Keywords: Knowledge Discovery, Data Mining, Classification, Rule, Data Description, Universal Hypotheses
Generator.
Abstract: We know that the task of Machine Learning (ML) is defined as finding of rules for the class on the basis of
learning examples for classification of unknown object(s). But we can use rules also for describing the class
data– who/what are they? which is the task of Data Analysis and Data Mining. There are several methods
for solving this task, for example, Determination Analysis (DA) and Generator of Hypotheses (GH). In the
paper we describe an idea for Universal Generator of Hypotheses, the complex method which can solve the
tasks of DA and GH and several new ones.
1 INTRODUCTION
In the domain of machine learning (ML) many
different algorithms are in use (Mitchell, 1997), for
example ID3 (Quinlan, 1986), CN2 (Clark and
Niblett, 1987), CART (Breiman, Friedman, Olshen
and Stone, 1984) and their derivates. There are
several algorithms which try to solve the same task
on a different algorithmic and pruning techniques
bases. Some algorithms output rules
as decision trees;
some as sets of rules;
some of them find non-intersecting rules;
some find overlapping rules;
some find only one system of rules;
some algorithms find different systems of
rules;
some find a set of rules that meets certain
requirements;
etc.
This is expected, because the number of all
possible rules in case of given sets of learning
examples can be huge and each method for finding a
set of rules tries to prune the number of rules.
We present an idea of Universal Generator of
Hypotheses, which can output most of the described
possibilities of output and some new possibilities for
the researcher.
2 MACHINE LEARNING TASK
AS A DATA MINING TASK
Machine Learning task is defined as learning from
examples i.e. finding concept description (set of
rules IF X THEN Y) that is both consistent and
complete at the same time (Gams and Lavrac, 1987).
A description is complete if it covers all
examples of all classes.
A description is consistent if it does not cover
any pair of examples from different classes.
2.1 Two Directions in ML
There are two directions (subtasks) in Machine
Learning:
Direction 1 (Main task): On the basis of
learning examples to find rules for
classification of unknown object(s)
(Classification task);
Direction 2: We can use the found rules for
describing the data table (learning examples)
under analysis: “Who/what are they?” (Data
Analysis and Data Mining task).
The main steps of direction 1 are:
1) Finding set of rules;
2) Testing rules on test-examples;
3) Applying tested rules on new instances.
Here the main goal is to find the rules with a
stably good ability of recognition. There exist
several methods for solving this task.
169
Lind G. and Kuusik R..
An Idea for Universal Generator of Hypotheses.
DOI: 10.5220/0004097101690174
In Proceedings of the 14th International Conference on Enterprise Information Systems (ICEIS-2012), pages 169-174
ISBN: 978-989-8565-10-5
Copyright
c
2012 SCITEPRESS (Science and Technology Publications, Lda.)

The main steps of direction 2 are:
1) Finding set of rules;
2) Analysis of found rules;
3) Class(es) description on the basis of rules.
The main goal for direction 2 is to describe the
class -“who/what they are” on the basis of found
rules. The best representatives of the direction 2 are
methods “Determinacy Analysis” (Chesnokov,
1980; Chesnokov, 1982) and „Generator of
Hypotheses” (Kuusik and Lind, 2004). They try to
answer to the questions:
“Who are they (objects of class)?”;
“How can we describe them?”;
“What distinguishes them from the others?”.
It means that on the basis of extracted rules we
can describe the class. Use of rules makes possible
to determine what is specific for the class and what
separate different classes. Using extracted rules also
the latent structure of the class can be discovered.
It is possible that the researcher is interested in
dividing attributes into two parts: causes (C) and
effects (E) and wants to analyze relations between
them (IF C THEN E).
From the other hand it can happen that the
researcher does not know what he/she seeks. It
means that the use of corresponding methods
provides him/her with some kind of (work)
hypotheses for description and he/she must decide
whether the extracted rules can help him/her to
describe or understand the essence of the data. That
is why we call extracted rules for data description
“hypotheses”. The same situation may arise also
when the amount of extracted rules is very big and
he/she physically cannot analyze them.
Next we present a brief description of DA and GH.
2.2 Determination Analysis
The main idea behind DA is that a rule can be found
based on the frequencies of joint occurrence or non-
occurrence of events. Such rule is called a
determinacy or determination, and the mathematical
theory of such rules is called determinacy analysis
(Chesnokov, 1982).
If it is observable that an occurrence of X is
always followed by an occurrence of Y, this means
that there exists a rule “If X then Y”, or X→Y. Such
correlation between X and Y is called determination
(from X to Y). Here X is determinative
(determining) and Y is determinable.
Each rule has two characteristics: accuracy and
completeness.
Accuracy of determination X→Y shows to what
extent X determines Y. It is defined as a proportion
of occurrences of Y among the occurrences of X:
A(X→Y) = n(X Y) / n(X), where
A(X→Y) is accuracy of determination,
n(X) is a number of objects having feature X and
n(X Y) is a number of objects having both
features X and Y.
Completeness of determination X→Y shows
which part of cases having Y can be explained by
determination X→Y. It is a percentage of
occurrences of X among the occurrences of Y:
C(X→Y) = n(X Y) / n(Y), where
C(X→Y) is completeness of determination,
n(Y) is a number of objects having feature Y and
n(X Y) is a number of objects having both
features X and Y.
Both accuracy and completeness can have values
from 0 to 1. Value 1 shows maximal accuracy or
completeness, 0 means that rule is not accurate or
complete at all. Value between 0 and 1 shows
quasideterminism.
If all objects having feature X have also feature
Y then the determination is (maximally) accurate. In
case of accurate determination A(X→Y) = 1
(100%).
Majority of rules are not accurate. In case of
inaccurate rule A(X→Y) < 1.
In order to make determination more (or less)
accurate complementary factors are added into the
first part of a rule. Adding factor Z into rule X→Y
we get a rule XZ→Y.
DA enables to find different sets of rules,
depending on the order in which the attributes are
included into the analysis. One possible set of
accurate rules for well known Quinlan’s data set (of
eight persons characterized by height, hair colour
and eye colour) (Quinlan, 1984) for example
describing (persons belonging to) class ”–” is
following:
Hair.red → Class. – (C=33%);
Hair.blond & Eyes.blue → Class. – (C=67%),
The second one:
Height.tall&Hair.red → Class. – (C = 33%)
Height.short&Hair.blond&Eyes.blue → Class.
– (C=33%)
Height.tall&Hair.blond&Eyes.blue → Class. –
(C = 33%).
2.3 Generator of Hypotheses
Generator of Hypotheses (GH) is a method for data
mining which main aim is mining for patterns and
association rules (Kuusik and Lind, 2004). The goal
ICEIS2012-14thInternationalConferenceonEnterpriseInformationSystems
170

is to describe the source data. Used evaluation
criteria are deterministic (not probabilistic). The
association rules it produces are represented as trees,
which are easy to comprehend and interpret.
By depth-first search (from root to leaves) GH
forms a hierarchical grouping tree. Such tree
example is given below. Method uses effective
pruning techniques.
(3) 0.667(2) 0.500(1)
Height.tall=>Hair .Dark->Eyes .Blue
0.500(1)
->Eyes .Brown
0.667(2) 0.500(1)
=>Eyes .Brown->Hair .Blond
(3) 0.667(2) 0.500(1)
Hair .Dark=>Eyes .Blue->Height.Short
0.333(1)
=>Eyes .Brown
(3) 0.667(2) 0.500(1)
Eyes .Brown=>Hair .Blond->Height.Short
The numbers above node show node’s absolute
frequency (in parentheses) and node’s relative (to
previous level) frequency (before parentheses).
Absolute frequency of node t shows how many
objects have certain attribute with certain value
(among objects having properties (i.e. certain
attributes with certain values) of all previous levels
t-1,…,1). Relative frequency is a ratio A/B, where A
is the absolute frequency of node t and B is the
absolute frequency of node t-1. For the first level the
relative frequency is not calculated.
For example we can translate the first tree
(Height.tall=>) of set of trees as “3 persons (objects/
examples) are tall, 67% of them have dark hair, and
of those (with Height.tall and Hair.dark) 50% have
blue eyes and 50% have brown eyes. Also, 67% of
tall persons have brown eyes and 50% of those have
blond hair.”
GH has the following properties:
GH guarantees immediate and simple output
of rules in the form IF=>THEN;
GH enables larger set of discrete values (not
only binary);
GH enables to use several pruning techniques;
The result is presented in form of trees;
GH enables to treat large datasets;
GH enables sampling.
3 AN IDEA FOR UNIVERSAL
GENERATOR OF
HYPOTHESES
Here we present an idea for Universal Generator of
Hypotheses (UGH), which can solve analysis task
(direction 2) and which can test hypotheses (for
example, whether some specific rule identifies some
designated class (task of query type) i.e. can the rule
open the essence of the class under description), and
generate the new ones. Building of UGH is real, due
to the existence of the base algorithm and special
techniques on the basis of which several versions of
DA (Lind and Kuusik, 2008; Kuusik and Lind,
2010; Kuusik and Lind, 2011b) and GH (Kuusik and
Lind, 2004; Kuusik, Lind and Võhandu, 2004) (both
direction 2) and IL task (direction 1) (Roosmann,
Võhandu, Kuusik, Treier and Lind, 2008; Kuusik,
Treier, Lind and Roosmann, 2009) have been
realized.
The block diagram of Universal Generator of
Hypotheses is shown in Figure 1.
Basically the variants divide into two:
1) The researcher (user) does not partition
attributes (objects’ characteristics) under
consideration – presented by blocks 3..6 on
the left side of the scheme;
2) The researcher divides attributes into cause
and effect – blocks 7..17 on the right side of
the scheme.
In the first case (blocks 3..6) simply the
enumeration of analyzable attributes is given to the
system, i.e. it is not required to observe all the
attributes that are used for describing the objects. As
a result all existing value combinations of those
attributes or relations in the form of cause-and-effect
where causes and effects are generated automatically
can be obtained. System does not determine the
causes and the effects in a relation in the same way
as the user does in case of Determinacy Analysis,
but offers different possibilities for that; the user has
to decide what is what.
Always it is possible to define the set of
observable objects (narrower than in initial data). It
is shown as a logical expression (in block 2). In a
sense of DA the narrowing of universal context
takes place. Context is the set of qualities that
describe the whole group (the ones, on the ground of
which the objects are selected). The qualities
common to the whole initial data set determine the
universal context. In the same data set it is not
possible to widen the context, it is the widest there.
AnIdeaforUniversalGeneratorofHypotheses
171
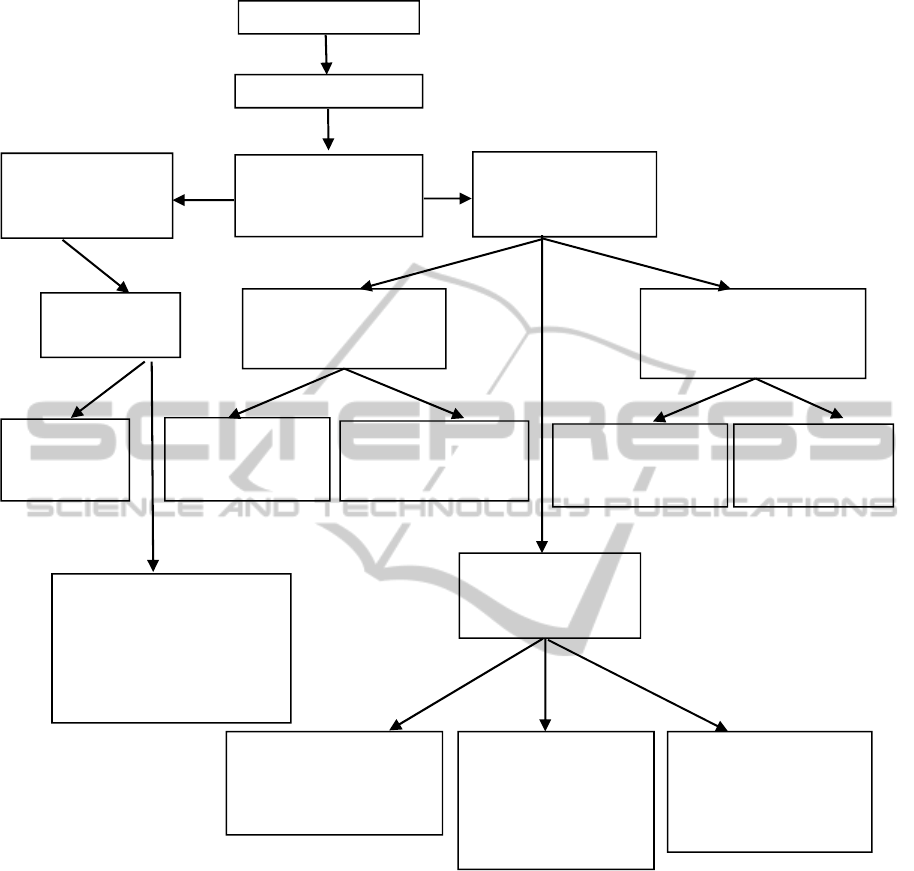
Figure 1: Block diagram of Universal Generator of Hypotheses.
Thus the context can be changed only by narrowing.
For that purpose the qualities on which basis to
make the restriction have to be shown. It is needless
to observe the attributes that determine the context
neither among causes nor among effects, since they
describe the whole subset under examination.
In the second case (blocks 7..17), blocks 14..17
describe the basic cases, where the researcher
distinguishes between cause-attributes and effect-
attributes. Block 15 presents the case, where with
each different existing combination of causes the
consequences characteristic only to it are associated.
In block 17 for each existing set of effects the causes
inducing only it are searched for. Although these
two cases are completely distinct for the user, the
difference here is only in the interpretation of the
data.
The case in block 16 differs from the one in
block 15 so that the sets of causes for which the
effects are searched for, are not restricted to the ones
that contain all the cause-attributes, but also the
combinations that contain only one or two etc
attributes from given set of attributes are observed.
In case of necessity here also the places of causes
and effects can be changed.
Blocks 8..10 represent a special case of blocks
14..15, where the user investigates what are the
effects resulting from specified cause(s). The set of
Dialogue with the user
Generation of hypotheses
In: 2
criterion for selection of
objects as a logical
expression
7
the researcher divides the
attributes into causes (C)
and effects (E)
8
In:
C as a given logical expression;
E – list of M2 attributes
11
In:
C – list of M1 attributes;
E as a given logical expression
3
the researcher does not
divide the attributes into
causes and effects
4
In:
list of M1 attributes
9
Out:
C→E, where
E – combinations by M2
10
Out:
C→E, where
E – combinations by 1,...,M2
12
Out:
C→E, where
C – combinations by 1,..,M1
13
Out:
C→E, where
C
–
combinations by M1
5
Out:
all combinations
by M1
14
In:
C – list of M1 attributes;
E – list of M2 attributes
6
Out:
all consequences in the form “cause-
effect” (C→E), where C and E are
combinations by 1,...,M1.
C and E are generated automatically
|C|+|E|=M1
16
Out:
C→E, where
C – combinations by
1,...,M1;
E – combinations by
1,...,M2
15
Out:
C→E, where
C – combinations by M1;
E – combinations by 1,...,M2
17
Out:
C→E, where
C – combinations by
1,...,M1;
E – combinations by M2
ICEIS2012-14thInternationalConferenceonEnterpriseInformationSystems
172

observable objects is determined by a logical
condition over cause-attributes.
Similarly the blocks 11..13 is a special case of
blocks 14&17, where the user examines what
reasons lead to specified effect. The logical
condition of effect-attributes determines the set of
observable objects.
Again the variants in blocks 8..10 and in blocks
11..13 differ solely in the interpretation.
Basically the results findable by blocks 14..17
can be obtained by proper repeated application of
simpler variants in blocks 8..13, but it is more
practical to give that work to the computer. For the
human user giving the different value combinations
(as logical expression) one by one is arduous
enough.
Usually it is reasonable to require from the user
that the sets of causes and effects do not intersect. In
cases (of variants) 15 and 17 the overlapping
attributes are always present in the fixed-length part
(C in block 15, E in block 17) and they can also
appear in the other part of relations. In case of
variant (in block) 16 such attributes can fall into
both sides. But something that causes itself or results
from itself is not very informative.
The overlapping might make sense if more than
one value is allowed for the overlapping attribute(s)
and objects with different values of such attribute(s)
form the same cause or effect. This is possible when
causes or effects are given by a logical expression
(blocks 8 and 11 accordingly). Appearing in the
other part of relations the overlapping attributes may
provide interesting information.
The same is true for restricting the context: if
more values are allowed for the attribute(s)
determining a context then it makes sense to observe
this(these) attribute(s) in the relations.
Generator of hypotheses does not presuppose
that observable objects are classified, however it
may come in handy when solving that task.
(Automatic) classification occurs here as follows.
The user submits a list of attributes (either causes or
effects); the system finds existing value
combinations of given attributes and each such
combination describes a class of objects. Such
classification takes place in block 15 by cause-
attributes and in block 17 by effect-attributes. As
mentioned, in these cases the difference (that is so
important for the user) is only in the interpretation.
In blocks 8..13 the determination of interesting
class by the researcher takes place on the basis of a
logical condition either by causes (block 8) or by
effects (block 11).
The variants on the left side of the scheme
(blocks 3..6) where the attributes are not divided into
causes and effects by the user is realized by
Generator of Hypotheses (Kuusik and Lind, 2004).
Variants on the right side are covered by machine
learning methods. Generally the classes are given
and rules for determining them have to be found
(Roosmann et al, 2008, Kuusik et al, 2009). Usually
the ML methods assume that class is shown by one
certain attribute, but in essence it can be a
combination of several attributes shown by a logical
expression. Again, whether the given classes are
cause (blocks 8..10, 14..15) or effect (blocks 11..13,
14&17), depends on the interpretation. Determinacy
Analysis (DA) can be qualified as a subtask of
machine learning as it finds rules for one class at a
time. So it covers the variants in blocks 8..10 and
11..13. Given class can be cause (in block 8) or
effect (in block 11). Output containing combinations
by M attributes (as in blocks 9 and 13) can be found
using DA-system (DA-system, 1998), output
according to blocks 10 and 12 can be obtained using
step-wise DA methods which allow rules with
different length (Lind and Kuusik, 2008; Kuusik and
Lind, 2010). By repeated use of DA also the variants
given in blocks 14..17 can be performed.
4 CONCLUSIONS
We have presented in the paper an idea for Universal
Generator of Hypotheses. We have discussed that
matter with specialists of data analysis and they have
mentioned that the use of DA and GH is not enough,
there are several other tasks to solve and there is
need for developing some additional new
possibilities. All these possibilities are described in
the paper. Possibilities of DA and GH are also
described in the paper and they are the part of the
functionality of UGH. As we have mentioned, it is
possible to realize UGH, there exist the base
algorithm and special pruning techniques on the
basis of which the functionality of UGH is easily
realizable.
REFERENCES
Breiman, L., Friedman, J. H., Olshen, R. A., Stone, C. J.,
1984. Classification and Regression Trees, Belmont,
California: Wadsworth.
Clark, P., Niblett, T., 1987. Induction in Noisy Domains.
In Progress in Machine Learning: Proceedings of
EWSL 87 (pp. 11-30). Bled, Yugoslavia, Wilmslow:
Sigma Press.
AnIdeaforUniversalGeneratorofHypotheses
173

Chesnokov, S. V., 1980. Determination-analysis of social-
economic data in dialogical regime (Preprint).
Moscow: All-Union Institute for Systems Research
(in Russian).
Chesnokov, S. V., 1982. Determinacy analysis of social-
economic data. Moscow: Nauka (in Russian).
DA-system 4.0 User’s Manual Version 1.0 (1998, 1999)
„Kontekst“ (in Russian)
Gams, M., Lavrac, N.1987. Review of five empirical
learning systems within a proposed schemata. In
Progress in Machine Learning: Proceedings of EWSL
87 (pp. 46-66). Bled, Yugoslavia, Wilmslow: Sigma
Press.
Kuusik, R., Lind, G., 2004. Generator of Hypotheses – an
Approach of Data Mining Based on Monotone
Systems Theory. International Journal of
Computational Intelligence, 1, 49 - 53.
Kuusik, R., Lind, G., 2010. Some Developments of
Determinacy Analysis. In Advanced Data Mining and
Applications - 6th International Conference, ADMA
2010, Proceedings, Part I. LNCS 6440 (pp. 593-602).
Springer.
Kuusik, R.; Lind, G., 2011b. New Developments of
Determinacy Analysis. In Advanced Data Mining and
Applications – 7th International Conference, ADMA
2011, Proceedings, Part II. LNCS 7121 (pp. 223-236).
Springer.
Kuusik, R., Lind, G., Võhandu, L., 2004. Frequent pattern
mining as a clique extracting task. In Proceedings:
The 8th World Multi-Conference on Systemics,
Cybernetics and Informatics (pp. 425 - 428). Orlando,
Florida, USA: International Institute of Informatics
and Systemics.
Kuusik, R., Treier, T., Lind, G., Roosmann, P., 2009.
Machine Learning Task as a Diclique Extracting Task.
In 2009 Sixth International Conference on Fuzzy
Systems and Knowledge Discovery (pp. 555-560). Los
Alamitos, California: Conference Publishing Service.
Lind, G., Kuusik, R., 2008. New developments for
Determinacy Analysis: diclique-based approach.
WSEAS Transactions on Information Science and
Applications, 5, 1458-1469.
Mitchell, T. M., 1997. Machine Learning McGraw-Hill.
Quinlan, J. R., 1984. Learning efficient classification
procedures and their application to chess and games.
In Machine Learning. An Artificial Intelligence
Approach, Springer-Verlag, 463-482.
Quinlan, J. R., 1986. Induction of decision trees. Machine
Learning, 1, 81-106.
Roosmann, P., Võhandu, L., Kuusik, R., Treier, T., Lind,
G., 2008. Monotone Systems approach in Inductive
Learning. International Journal of Applied
Mathematics and Informatics, 2, 47-56.
ICEIS2012-14thInternationalConferenceonEnterpriseInformationSystems
174
