
Predicting the Efficiency with Knowledge Discovery of a Budgeted
Company: A Cuban University
Validation through Three Semesters
Libia I. García
1,2
, Isel Grau
1
and Ricardo Grau
1
1
Centro de Estudios de Informática, Universidad Central “Marta Abreu” de Las Villas (UCLV), Santa Clara, Cuba
2
Dirección de Informatización y Comunicaciones, UCLV, Carretera a Camajuaní km 5½, Santa Clara, Villa Clara, Cuba
Keywords: Knowledge Discovery, Effectiveness of a Budgeted Company, University Efficiency.
Abstract: The efficiency analysis of a company cannot be reduced to a great number of statistical tables, despite the
reliability of them. It has been shown to be a better idea to seek the “essence” using Knowledge Discovery
(KD) techniques. In this paper, a simple methodology to apply KD in the efficiency analysis of a budgeted
company is presented. These analyses complement those from classical OLAP and Interactive Graphics.
Specifically, it is shown how to use in three steps: univariate analysis, non-supervised and supervised multi-
variate machine learning techniques in order to support the decision making. All these procedures are illus-
trated using the SIGENU database (in Spanish: Sistema de Gestión de la Nueva Universidad) of UCLV stu-
dents and the efficiency measure was the student graduation on time or not. The presented methodology was
elaborated in 2009 and it has been preliminary validated during three semesters of the years 2010 to 2012.
1 INTRODUCTION
Business Informatics is a discipline which combines
Information Technology and Informatics and man-
agement concepts. It integrates core elements from
the disciplines business administration, information
systems and computer science into one field. Also, it
has been considered that Business Informatics in-
cludes significant construction and implementation
oriented elements, i.e. one major focus lies in the
development of solutions for business problems
rather than the ex post investigation of their impact.
We do not agree and we will try to show that it is not
a contradiction, at least, in some type of research.
Business Informatics conceptualization is been re-
freshed today and its perspectives are continuously
updated (Forbrig and Günther, 2010).
The efficiency analyses are normally based on
transversal or longitudinal statistical studies of cer-
tain indicators such as profits, costs, productivity,
etc. When the subject is a public sector company,
e.g. state budgeted universities, cost-profits could
not be considered. These indicators should be al-
ways important, but the priority will be the effec-
tiveness on time. In addition, the analysis about the
efficiency of a company cannot be reduced to a great
number of tables, since the results are difficult to
interpret as a whole. Then, an alternative to classical
methods consists in looking for the essential infor-
mation using Knowledge Discovery techniques.
In this paper we show how to use several of these
supervised or unsupervised techniques for efficiency
analysis of a university. Specially, we explain how
could be used univariate and multivariate analyses to
predict a dichotomic efficiency measure (the com-
pany achieves its goal or not) from data that repre-
sent risk factors to failure.
2 METHODOLOGICAL ASPECTS
AND COMPUTATIONAL
TOOLS
The Central University of Las Villas was selected in
this study for two main reasons: firstly, it is one of
the best Cuban universities, every year it is first to
third in the national ranking; and secondly, it is the
most multidisciplinary university in the country. In
this sense, we can say that this university is a good
selection for a sampling by clusters in the Cuban
universities (Grau et al., 2004). From the design
315
García L., Grau I. and Grau R..
Predicting the Efficiency with Knowledge Discovery of a Budgeted Company: A Cuban University - Validation through Three Semesters.
DOI: 10.5220/0004106603150318
In Proceedings of the International Conference on Knowledge Discovery and Information Retrieval (KDIR-2012), pages 315-318
ISBN: 978-989-8565-29-7
Copyright
c
2012 SCITEPRESS (Science and Technology Publications, Lda.)

point of view, the experiment is a longitudinal study,
particularly a panel-cohort study (Grau et al., 2004).
Actually, we consider all the students that are in the
last year of their careers in the academic course
2009-2010, but we added all the students that began
its studies in the course 2005-2006 (cohort) although
some of them are not in the last year now because
they have not success during all the years, and so
they will not finish degree on time. Finally, the gen-
eral sampling has 1007 students from 12 faculties
and 25 careers. The cohort is composed with 803
students that began in the academic course 2005-
2006.
The efficiency measure or objective function to
predict efficiency is the dichotomy variable “Finish
degree on time” (Yes/Not). Predictive variables are
some individual student data, previous to the begin-
ning of their university studies, and additionally, the
Faculty and the Career where they are now. It is
important to notice that we used only “epidemiolog-
ical” predictive data and we do not use “clinical”
data, for example, the student performance in the
first/second year. It is a good idea to use only previ-
ous data because it will allow us to obtain a predic-
tion for every student before the first class in his first
course.
In the first step of this methodology it is used the
Association Univariate Analysis based on Crosstabs
Tables. There have been used, particularly, classical
measures as Chi-square, Φ and Cramer’s V (Cramer,
2011) and the classical epidemiological measure of
Relative Risk (Prentice and Farewell, 1986). We try
to build an “integral score of risk to not-finish on
time”. In order to do that, we split each variable
using Decision Trees with the CHAID growing
method: Chi-squared Automatic Interaction Detec-
tion (Decision Trees, 2011). We calculated a statistic
that represents the presence of relative risk weighted
by its relevance, quantified by Cramer’s V.
The multivariate unsupervised Analysis is devel-
oped in two directions. First of all the work is fo-
cused on the predictive data in order to form clusters
of students which have similar previous characteris-
tics. There are used Two-step clusters to determine
the optimal cluster number (with Schwarz’s a Bayes-
ian Information Criterion) and the clusters them-
selves (Bacher et al., 2004). Afterwards is employed
the Categorical Principal Component Analysis
(CATPCA) with the variables to reduce them to two
dimensions (Meulman et al., 2002). In order to vali-
date the clusters and the dimensions found, the re-
sults of both techniques are cross tabulated with the
efficiency measure. But it is important to notice that
unsupervised results are independent from the objec-
tive function and so they could be used if another
objective function is selected. Finally, Decision
Trees in a supervised analysis are used again with
our efficiency measure, but this time we use CRT:
Classification and Regression Trees.
3 KNOWLEDGE DISCOVERING
3.1 Univariate Analysis
The Univariate procedure can be illustrated with the
variable Faculty. The Decision Tree forms three
groups of Faculties that exhibit a Chi-square statistic
with high significance. Students that finish on time
are predominant but in different proportions. We
constructed three dichotomic variables respectively
associated with these nodes and calculate: the Chi-
square statistic, the Cramer’s V (Φ), the Relative
Risk and its 95% confidence interval in their cross
tabulation with the efficiency measure. This proce-
dure is repeated for every possible predicting varia-
ble. From the KD point of view, it is already inter-
esting to know which variables show risk or protec-
tion (negative risk) in some of their categories.
An integral-univariate risk score in any student is
calculated. Essentially, we should sum the present
risk Φ weighted by Cramer’s, standardized and
compare it with a threshold that it is optimized with
a Curve ROC (Fawcett, 2004). The accuracy results
65%. It is not a spectacular result but at least prove
that we can obtain a classification with this Univari-
ate analysis.
3.2 Multivariate Unsupervised Analysis
We separated the unsupervised analysis (clusters)
from data and variables (principal components).
3.2.1 Discovering Clusters
The Bayesian Information Criterion in the Two-Step
Clustering technique found that two is the optimal
number of clusters. Cluster 1 has 309 students
(47.7% of the total analyzed). Cluster 2 has 339
students (52.3%). Due to the missing values (specif-
ically Academic Index in the previous school and
Scale to get admission) 359 students were excluded
in the clustering procedure. It determined the varia-
bles that essentially distinguish the clusters.
So, this cluster analysis allows us to classify the
students according to the predictive variables. This
analysis was repeated also within the cohort and the
results were similar: 2 clusters were formed; the
KDIR2012-InternationalConferenceonKnowledgeDiscoveryandInformationRetrieval
316

significant variables were the same, with the inter-
esting exception that appears the mother occupation
with significance. On the other hand the cross tabu-
lation between the clusters with the efficiency meas-
ure is similarly significant (accuracies 88,5% and
84,5%).
3.2.2 Discovering Dimensions
We look for two dimensions with CATPCA and we
obtained them with high reliability (Cronbach’s
Alpha 0.702 for the first dimension, 0.458 for the
second and 0.866 for the total). The variables more
strongly associated with each dimension were de-
termined.
It is interesting that dimension 1 includes varia-
bles relatives to the students whereas dimension 2
includes variables relatives to the university (faculty
and career). For instance, Birth_Year, Academic
index in the previous school, and Academic scale to
get admission are variables with high negative corre-
lation with dimension 1, and so it reduces its value
when these variables increase; whereas Sex and
Scholastic origin increase the dimension 1 propor-
tionally. It is important to explain that Sex was codi-
fied with the greater value for males and Scholas-
tic_Origin with the greater values for origins that are
not the normal High school institutes.
It was clear that dimension 1 is more important
than dimension 2 regarding to the efficiency meas-
ure, because it has more separated extreme values.
These are good news for faculties and university
directives, and help them in decision making about
what variables explore and which students support.
Similar results are obtained with this procedure
applied to the cohort students. Finally we could
combine the results of these two unsupervised analy-
sis. If we do this, we obtain, as it was expected, that
dimension 1 is more strongly marked in the cluster 1
where the efficiency measure is the worst and the
inverse with dimension 2 (ANOVA is significant).
Of course, it is possible to combine the clustering
and a CATPCA technique in other forms, for in-
stance, as it was elaborated in (Nuñez et al., 2006),
but the information will be redundant, and we prefer
to show the results of the supervised analysis.
3.3 Multivariate Supervised Analysis
In the Fig. 1 we show the decision tree obtained with
the CRT technique for the general sampling. This
technique is capable to work with missing values
replacing them with values of the central tendencies
corresponding variables. The detected interactions
are interesting and the different paths lead to 12
terminal nodes. Associated with every one of them
and travelling throughout the correspondent path, it
can be defined a “simplified rule” (actually saved in
several formats, in a more complex form) for the
prediction. The confusion matrix confirmed 70.3%
accuracy. It is enough if we take into account that
we try to predict the success only with epidemiolog-
ical data. And it was ratified with the cohort with
classification accuracy greater than 0.79. Definitive-
ly, this supervised form to predict the efficiency is
the best for the general and the cohort sampling and
can be easily incorporated to SIGENU.
4 VALIDATIONS
The rules obtained were validated with the students
that began in Sept. 2010. They finalized their first
semester in April 2011 and their first year in July
2011. All the prognostics were concordant in these
moments. Recently we made a validation with stu-
dents that began in Sept. 2011. It is interesting that
prediction is already exact at least in 39% of cases.
Actually these are not good news because the prog-
nosis is for a long time (5 years) and the student that
could fail must increase. But faculties are advised
with specific names of students in risk, in order to
make decisions.
5 CONCLUSIONS
It is shown a methodology about how to use, in three
steps, univariate and multivariate non-supervised
and supervised Machine Learning Techniques, in
order to predict an efficiency measure of a budgeted
company and finally, to support the decision making
related with it. Specifically we tried a university
efficiency measure in terms of the possibility of
student’s graduation on time.
Univariate analysis was significant with appro-
priated risks. It was shown how to use optimally the
Cramer’s V to predict -in an original form- weighted
sum of risks.
Unsupervised analysis was also significant. It
showed the student classification in two clusters, and
variables combined in two dimensions. Both separa-
tions were essentially capable to show their associa-
tion with the graduation on time or not.
Supervised analysis was more significant be-
cause it obtains a higher accuracy (almost 80%) in
the efficiency prediction.
This methodology is applied and validated through
PredictingtheEfficiencywithKnowledgeDiscoveryofaBudgetedCompany:ACubanUniversity-Validationthrough
ThreeSemesters
317
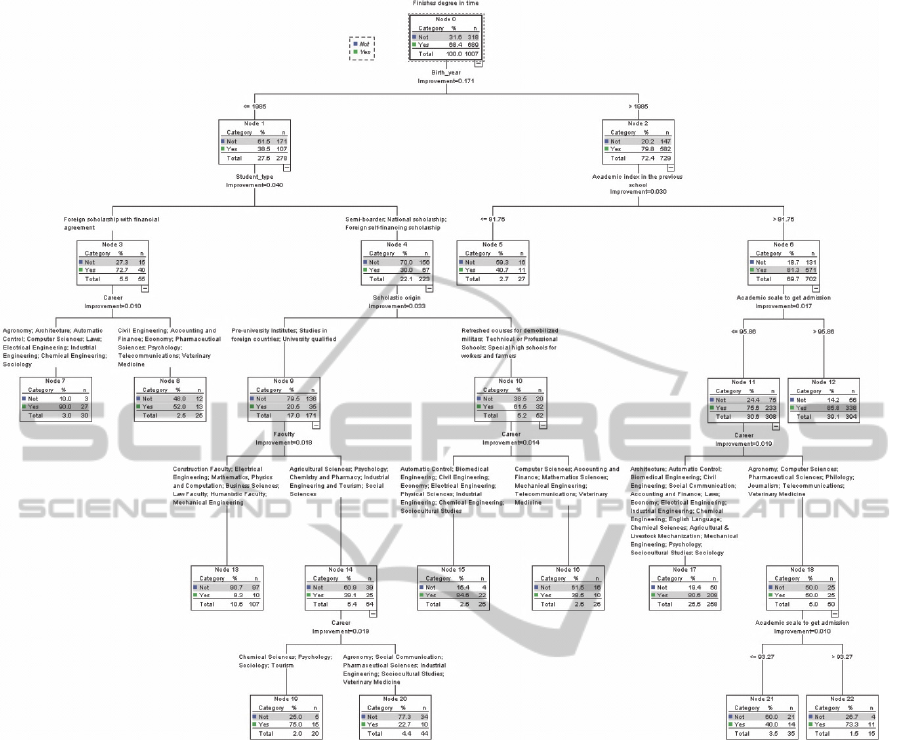
Figure 1: Shows the decision tree obtained with the CRT technique. It describes how the predictive variables can interact to
obtain a better prediction of “Finish degree on time”.
three consecutive semesters and the predictions are
used to improve special attention to students at risk
of failing in the UCLV.
REFERENCES
Bacher, J., et al., 2004. SPSS Two Step Cluster. A First
Evaluation. In RC33 6th International Conference on
Social Science Methodology, Amsterdam.
Cramer, 2011. http://changingminds.org/explanations
/research/analysis/cramers_v.htm, consulted Oct.
2011.
Decision Trees, 2011. Learning to Classify with
Branching Test, http://www.aaai.org/AITopics/pmwiki
/pmwiki.php/AITopics/, consulted Oct. 2011
Fawcett, T., 2004. ROC Graphs: Notes and Practical
Considerations for Data Mining Researchers. Kluwer
Academic Publishers. Netherland.
Forbrig, P., Günther, H., 2010. Perspectives in Business
Informatics Research. In Referred proceedings of BIR
2010. Lecture Notes on Business Information
Processing, 64, Rostock, Germany.
Grau, R. et al., 2004. Metodología de la Investigación.
Editorial EL POIRA S.A. Ibagué, Colombia. 2nd Edi-
tion.
Meulman, J. J. et al., 2002. New features of Categorical
Principal Components Analysis for Complicated Date
Sets, Including Data Mining. In Gaul, W., Ritter, G.
(eds.) Proceedings of the 24 annual conference of the
Geselschaft für Classifikation V. 24. Part 3: Data
Mining, Information Processing and Automation,
Springer, pp. 207-218.
Nuñez, I. et al., 2006. Two-Step Cluster Procedure after
Principal Component Analysis Identifies Sperm
Subpopulations in Canine Ejaculates and Its Relation
to Cryoresistance. In J. Androl., 27 (4) p. 596
Prentice, R. L, Farewell, V. T., 1986. Relative Risk and
Odd Ratio Regression. In Annual review of public
health. 7, 35-58.
KDIR2012-InternationalConferenceonKnowledgeDiscoveryandInformationRetrieval
318
