
Product Assortment Decisions for a Network of Retail Stores using
Data Mining with Optimization
Sudip Bhattacharjee, Fidan Boylu and Ram Gopal
Department of Operations and Information Management, University of Connecticut, Storrs, U.S.A.
Keywords: Product Assortment, Retail Operations, Optimization, Association Rule Mining.
Abstract: This paper presents a model for product assortment optimization for a network of retail stores operating in
various locations of a company. Driven by the local market information of each retail store, the model
determines the right products to include in a store’s assortment and which stores to ship from in the store
network. The model first learns the global patterns of the frequent itemsets based on association rule mining
to extract patterns of products with corresponding sales benefits. It then encodes the pattern information into
the development of a global optimization formulation, which maximizes the revenue of the company in
aggregate and identifies the optimal solution for each local store by taking into account the possibility of
shipments in the network. We use the transactional level data from an industry leading plastics manufacturer
and retailer in the United States to demonstrate the utility of the model.
1 INTRODUCTION
Retailers with multiple stores of commodity
products commonly face the problem of product
assortment selection, especially when these stores
are spread over several different geographic
locations. Given a network of stores, the problem
becomes how to incorporate varying market
conditions of store locations and at the same time
take into account the possible transportation of
products between stores, to decide on the right
product assortment for a given store location.
We approach the problem using data mining an
optimization tools. We use the conflict resolution
method (Bai et al., 2012) for itemsets extracted
using Association Rule Mining to extract global
patterns. We then use these patterns in a network
optimization problem to find the optimal product
assortment and shipment decisions for local stores.
We will make use of the measures developed in Bai
et al. (2012) to identify the concentration of clients
interested in certain patterns around a given location
and the retailer’s global sales performance on such
patterns.
For our analysis, we use the data of an industry
leading plastics manufacturer and distributor with
over seventy branch locations in the US, Canada and
Mexico. It offers a wide range of products such as
plastic sheet, rod, tube and film in various
shapes and sizes. These products are used to serve
various industries such as appliances, automotive,
electrical, manufacturing, medical, printing and
transportation. Companies such as these, with a large
number of branch locations, strive for solutions that
provide data-driven, quantitative decision support
tools that would help decide on the right product
assortment and shipment decisions for maximum
profitability of branch and company-wide
profitability.
This paper presents a model for product
assortment optimization for multiple stores of a
company where these stores, while holding a local
assortment of products, can also receive shipments
of products outside their portfolio from other stores
in the network. We contribute to the literature by
providing a network model of product assortment
decision using data mining and optimization tools.
We differentiate form earlier studies by providing a
more realistic framework where there is the
possibility of product shipments in a network of
stores which hasn’t been considered in the prior
studies.
2 LITERATURE REVIEW
Association Rule Mining (Agrawal et al., 1993,
Agrawal and Srikant, 1994, Brin et al., 1997) is the
319
Bhattacharjee S., Boylu F. and Gopal R..
Product Assortment Decisions for a Network of Retail Stores using Data Mining with Optimization.
DOI: 10.5220/0004106703190323
In Proceedings of the International Conference on Knowledge Discovery and Information Retrieval (KDIR-2012), pages 319-323
ISBN: 978-989-8565-29-7
Copyright
c
2012 SCITEPRESS (Science and Technology Publications, Lda.)

extraction of patterns of interest among different
items in a collection of transactions. Association rule
mining techniques are based on the several measures
of interestingness such as support, confidence and
lift to gather possible association rules from the
databases. However, due to the increase in the size
and complexity of modern databases, the number of
the association rules mined can become
tremendously large. To narrow down and to
optimize the list of association rules, advanced
techniques have been proposed (Agarwal et al. 2000,
Han 2000, Malik 2006). We adopt the methodology
by Bai et al. (2012) which develops procedures for
eliminating conflicting patterns for the problem
under study, and differentiate between the frequent
patterns and beneficial patterns.
Product assortment decision has been the
attention of several studies. Caro and Gallien (2007)
study the problem of dynamically optimizing the
assortment of a store as more information becomes
available during the selling season. They focus on
one store and predict sales data to optimize the
assortment. Gaur and Honhon (2006) developed an
assortment planning model under the locational
choice demand model. In this model, products are
perceived as bundles of attributes, and each product
is defined by its location in an attribute space.
Individual preferences are defined by associating a
point in the attribute space with each consumer.
Problem of efficient shipment of products
between the stores in retail networks has also been
the center of research around inventory management
and distribution systems. In Caro and Gallien
(2010), authors address the problem of distributing a
limited amount of inventory across all the stores in a
fast-fashion retail network. They formulate a
stochastic model predicting the sales of a product in
a single store. They formulate a mixed-integer
program embedding a piecewise-linear
approximation of the first model applied to every
store in the network to compute store shipment
quantities maximizing overall predicted sales,
subject to inventory availability and other
constraints.
Although, closely related to these studies, we
focus on the product assortment decisions for
individual stores in the network when product
shipment is an option between the stores. We
maximize the revenue function of the company as a
whole taking into account the discount factors of
possible shipments. None of the above papers just
cited has brought together product assortment using
patterns of beneficial product combinations with the
availability of shipments in a network of stores.
3 MODEL
Let the firm offer a total of P products indexed as
pϵ1,…,P in B store locations indexed as
bϵ
1,…,B
to clients in S different industry
segments indexed as sϵ1,…,S. Let iϵ1,…,N
index the client companies in a given industry
segment across all stores. Note that each client i may
operate in one or more of the stores and N represents
the collection of all clients in all stores. Let π
denote the revenue of client i from its own sales. Let
r
,
denote the sales of product p from the firm we
model to client i. We define a transaction as the
vector t
r
,
,…,r
,
which indicates sales to the
client of various products.
Let Aa
,…,a
|
|
denote the set of all
frequent itemsets with lift values greater than 1. A
transaction is denoted as supporting a frequent
itemsetif r
,
0∀p ∈ a
. Let θ
,θ
⊆A, denote
the set of frequent itemsets that are supported by
transaction t
i
. Following the notation in Bai et al.
(2012), we introduce two key measures: Industry
coverage: Υp,a
∑
∀,
∑
∀
and Revenue
Capture Ratio: Φp,a
fπ
,r
,
∀i:a
ϵθ
.
Industry coverage denotes the ratio of revenues
of clients who purchased the frequent itemset a
without any conflicts with other frequent itemsets to
the revenue of all potential clients around the stores
of the firm. Revenue capture ratio describes the
ratio of the firm’s sales value of product p to the
revenue of clients that purchasea
. As a common
approach, we use
Φp,a
average
,
∀i:a
ϵθ
.
We first begin the analysis to remove conflicts in
the frequent itemsets and in the process prune the
number of itemsets for further analysis. Consider
two frequent itemsets
and
in
such that
,
∈
. They are said to conflict if
∩
∅ (where ∅ denotes null or empty set). In other
words, there exists at least one product that belongs
to both itemsets, which raises the question of which
itemset influences the sales of the products common
to both itemsets for a given transaction. Clearly, a
conflict removal strategy is needed to identify the
main itemset that influence the sales of a set of
products. Adopting the methodology by Bai et al.
(2012), we remove the conflicts in frequent itemsets.
We start with one frequent itemset and compare it
with every other frequent itemset for the transaction.
For each transaction, we terminate with a set of non-
conflicting itemsets, and prune the number of
itemsets for the whole set of transactions. At the end
KDIR2012-InternationalConferenceonKnowledgeDiscoveryandInformationRetrieval
320
of the process, for each product in each transaction,
at most one frequent itemset is utilized. This process
ensures that the frequent itemset that is identified
uniquely influences the products present in that
itemset.
For a given store, let Π denote the total revenues
of the client companies belonging to a given
industry segment in that store location. We focus on
deciding which products to offer (and as a result
which itemsets come into play) and the
corresponding branch sales figures. We define the
following variables:
1 if the product p is shipped from branch
to b, 0 otherwise, for p1,…,P , 1,…,B
and 1,…,B
1 if itemset a
applies for branch b, 0
otherwise, for j1,…,
|
A
|
and 1,…,B
1 if product ∈a
is shipped from branch
to b, 0 otherwise, for j1,…,
|
A
|
and
1,…,B, 1,…,B
Δ
1is the discount factor when product p is
shipped from branch to b, for p1,…,P ,
1,…,B and 1,…,B where Δ
Δ
.
Notice that when ,
1 if the product
p is kept in branch b and 0 otherwise. Similarly,
when , Δ
1 since no discount is
necessary. The total expected sales for a branch b
can be written as:
∑
Υ
p,∅
Φ
p,∅
Π
∑
Δ
∑∑
Υp,a
ΠΦ
p,∅
∑
Δ
|
|
Φp,a
∑
Δ
Next, we develop the optimization model using
the above sales formula for each branch to formulate
the objective function.
Problem
(no more than
products kept at
each store):
∑
∑
Υ
p,∅
Φ
p,∅
Π
∑
Δ
∑∑
Υp,a
ΠΦ
p,∅
∑
Δ
|
|
Φp,a
∑
Δ
s,t For 1B:
∑
1
(A product should be shipped
from at most 1 other store)
forp 1,…,P∀ ∈
1,…,B
b (If a store doesn’t hold a product, can’t ship
that product to other stores)
∑∑
∈
1
,∀
, (all
products of an itemset should be either received
or held for the itemset to be in effect)
∑
y
∀ ∈
,∀
(If any of the
products of an itemset are not received or kept
then the itemset is not in effect)
,∀∈
,∀
, ∀ ∈ 1,…,B
(When a product of an itemset is not received or
held,
0
1
,∀∈
,∀
,
∀ ∈
1,…,B
(When an itemset is in effect,
1 for
1
∑
y
,∀∈
,∀
(When an
itemset is not in effect,
0)
∑
(Maximum number of products
that can be kept at the store)
,
,
∈0,1
Note that the above formulation is for a single
industry segment. However, it can easily be
generalized for multiple industry segments by
summing the objective function over the industry
segments and populating the constraints accordingly.
4 COMPUTATIONAL ANALYSIS
AND RESULTS
In order to illustrate our model, we use a prototype
example for 10 products and 3 branches for a single
industry segment. After conflict removal, we extract
7 frequent non-conflicting itemsets. We randomly
select the shipment discount factor Δ
in the
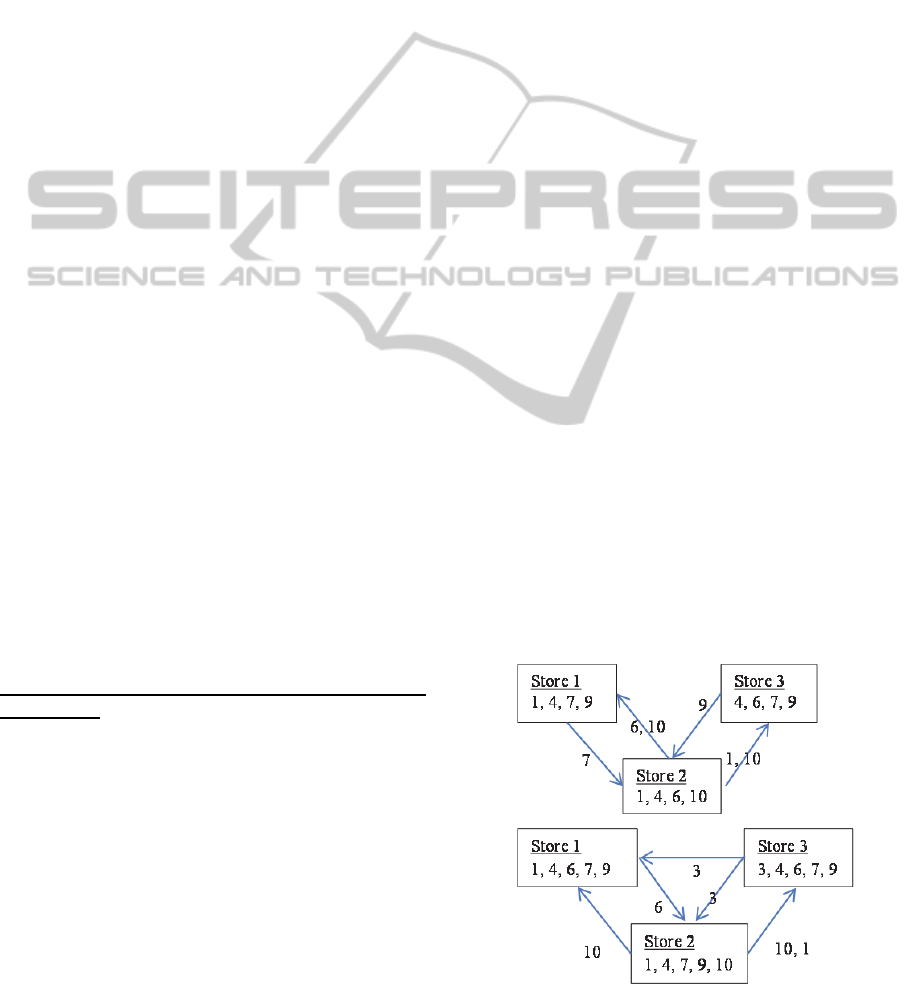
Figure 1:
=4 and
=5 shipment networks.
ProductAssortmentDecisionsforaNetworkofRetailStoresusingDataMiningwithOptimization
321
interval [0.5, 1] and use the same value of Π for all
stores. We solve the model for different values of
. In Figure 1, as an example, we display the
product shipment graphs for the two values of
=4
and 5. We observe that the shipments of products
dramatically change with an increase in
.
Table 1 reports the total revenue and individual
store revenues when maximum number of products
for all stores are set to increasing values of
starting from
7 for ease of presentation.
Notice that the product shipments are not
reported in Table 1 due to space limitations. When
the product assortments in Table1 for increasing
values of
are examined, we observe that the
assortments show much variability from one
to
another. This can be attributed to the random
shipment discount factor Δ
which does not have a
certain pattern. This results in variability in optimal
shipment of products as the number of products per
store is increased
Table 1: Revenues and product assortments.
Store Rev.(million)
# of
itemsets
Products in store
Total
Rev.
(million)
7
1 5.66 4 1,3,4,5,6,7,9
16.68 2 5.69 2 1,4,6,8,9,10
3 5.33 4 3,4,5,6,7,8,9
8
1 5.66 4 1,3,4,5,6,7,8, 9
16.69 2 5.70 2 1,3,4,6,7,8,9,10
3 5.33 4 3,4,5,6,7,8,9,10
9
1 5.61 7 1,2,3,4,5,6,7,8,9
16.57
2 5.65 5 1,2,3,4,6,7,8,9,10
3 5.30 7
2, 3, 4, 5, 6, 7, 8,
9, 10
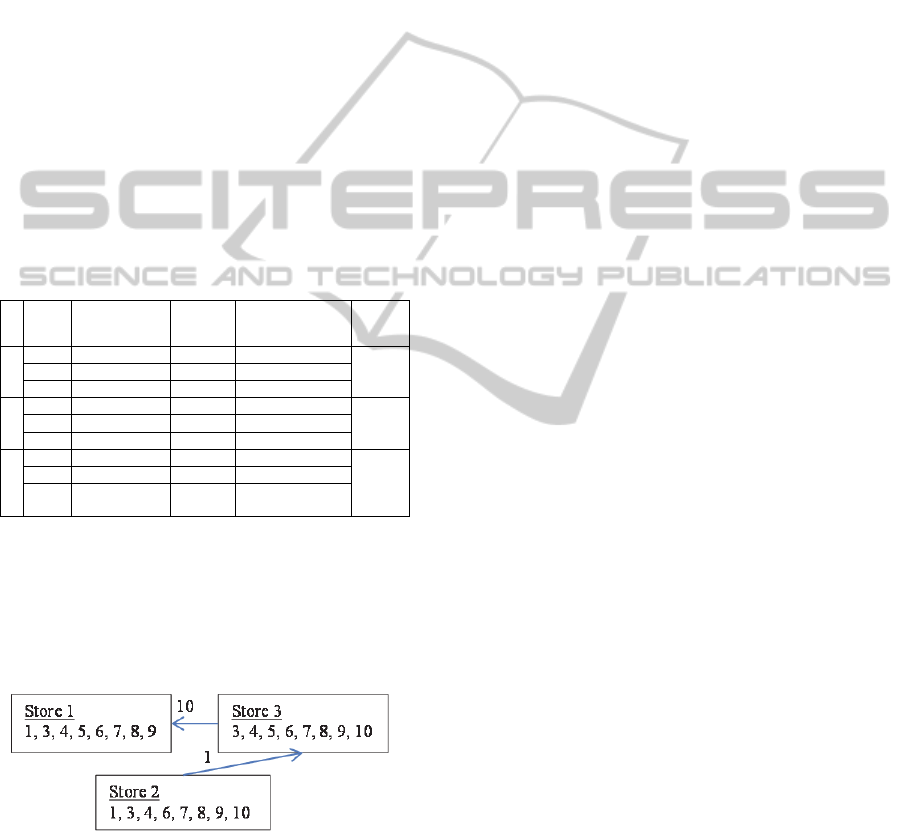
We observe that the optimal revenue occurs at
=
8. To obtain values for
= 9, we force the
constraint in the model to an equality. We see that
the objective value for
= 9 is less than the optimal
= 8. In Figure 2, we display the shipment graph
of this optimal network.
Figure 2: Optimal shipment network
.
In Table 1, when the numbers of itemsets are
compared, we see that they saturate around the
optimal value at 4, 2 and 4 for three stores of the
company. We note that for larger number of
products and higher number of stores, the optimal
graph will look more interesting as the shipment of
multiple products will be in effect and the related
revenues and assortments will show more variability
as multiple industry segments are considered. The
results of such a dataset from an industry leading
plastics manufacturer and retailer in the United
States will be demonstrated at the time of
presentation.
5 CONCLUSIONS
In this paper, we present a model for product
assortment optimization for a network of retail stores
operating in various locations of a company. We
combine local information captured from each retail
store and use a global frequent itemset analysis.
Later, for each retail store, our optimization model
determines the right products to include in a store’s
assortment and which stores to ship from in the store
network. The model first learns the global patterns
of the frequent itemsets based on association rule
mining to extract patterns of products with
corresponding sales benefits. It then uses a global
optimization formulation maximizing the revenue of
the company in aggregate and identifies the optimal
assortment for each local store by taking into
account the possibility of shipments in the network.
REFERENCES
Agarwal, R., Imielinski, T., Swami, A., 1993, Mining
association Rules Between Sets of Items in massive
databases, Proceedings of the ACM/SIGMOD
International Conference on Management of Data, pp.
207-216
Agrawal, R., Srikant. R. (1994) Fast algorithms for mining
association rules. Proceedings of the 20th
International Conference on Very Large Data Bases,
VLDB, pp. 487-499.
Agarwal, R., Aggarwal C. C., Prasad V. V. V. (2000). A
tree projection algorithm for generation of frequent
itemsets. Journal of Parallel and Distributed
Computing. 61. pp. 350-371
Bai, X., Bhattacharjee, S., Boylu, F., Gopal, R. (2012) A
Data Mining and Optimization Methodology for
Improving Branch Product Portfolio and Performance,
under review
Brin, S., Motwani, R., Ullman, Tsur. J. D., (1997).
Dynamic itemset counting and implication rules for
market basket data. In SIGMOD 1997, Proceedings
ACM SIGMOD International Conference on
Management of Data, pp. 255-264.
Caro, F., J. Gallien. (2007). Dynamic assortment with
demand learning for seasonal consumer goods.
Management Science. 53(2) 276–292.
KDIR2012-InternationalConferenceonKnowledgeDiscoveryandInformationRetrieval
322

Caro, F., J. Gallien. (2010). Inventory Management of a
Fast-fashion Retail Network. Operations Research.
58(2) 250–273.
Gaur, V., D. Honhon. (2006). Assortment planning and
inventory decisions under a locational choice model.
Management Science. 52(10) 1528-1543.
Han, J. A. (2000). Mining frequent patterns by pattern
growth: Methodology and Implications. ACM
SIGKDD Explorations Newsletter. 2(2) pp. 14-20.
Malik, H. H. (2006). Clustering web images using
association rules, interestingness measures, and
hypergraph partitions. Proceedings of the 6th
International Conference on Web Engineering (ICWE
'06). pp. 48-55.
ProductAssortmentDecisionsforaNetworkofRetailStoresusingDataMiningwithOptimization
323
