
Factor Analysis and the Retrieval of Medical Images Depicting
Structures with Similar Shapes
Alexei Manso Correa Machado
Pontificia Universidade Catolica de Minas Gerais, R. Dom Jose Gaspar, 500, Belo Horizonte-MG, 30535-901, Brazil
INCT de Medicina Molecular, Faculdade de Medicina, Universidade Federal de Minas Gerais
Av. Alfredo Balena, 190, Belo Horizonte, MG, 30130-100, Brazil
Keywords:
Content-based Image Retrieval, Factor Analysis, Shape Representation, Medical Image Databases.
Abstract:
This work presents a new perspective to medical image retrieval based on factor analysis. The shape of
anatomical structures are represented as high-dimensional sets of vector variables obtained from non-rigidly
deforming a template image so as to align its anatomy with the subject anatomy of a group. By eliminating the
redundancy embedded in the data, a reduced set of factors is determined, corresponding to new variables with
possible anatomic significance. The method’s ability to retrieve relevant images is exemplified in a study of
the corpus callosum, a structure with very subtle shape differences. The factor analysis approach is compared
to principal component analysis in a set of 960 experiments, yielding significantly higher precision rates.
1 INTRODUCTION
The development of modern medical imaging modali-
ties represents a corner stone for non-invasive analysis
of in vivo anatomy and physiology, as it provides in-
valuable information to support diagnosis and unveils
intricate mechanisms related to pathologies. Never-
theless, the overwhelming amount of information as-
sociated to these technologies cannot be appropriately
handled without computerized tools. Medical imag-
ing studies usually involve a large number of vari-
ables that by far exceeds the number of subjects in
the sample. In this scenario, the ability of physicians
to compare, analyze and select specific exams from a
database can be seriously compromised.
This article presents a new perspective to medi-
cal image retrieval based on multivariate factor anal-
ysis. The proposed method is based on the analy-
sis of high-dimensional sets of vector variables ob-
tained from non-rigidly deforming a template image
so as to align its anatomy with the subject anatomy of
a group, depicted by computerized imaging modali-
ties. By eliminating the redundancy embedded in the
data, we aim to extract a reduced set of common fac-
tors that correspond to new variables with possible
anatomic significance. Image retrieval is performed
based on the computation of a similarity function that
takes into account the values assigned to each of the
factor variables, for both the dataset and the query.
Figure 1 shows a schematic of a content-based
image retrieval (CBIR) system that follows this ap-
proach. A set of images depicting neuroanatomical
structures is segmented and the structures represented
by their boundaries. Another image, taken as a com-
mon reference, is deformed through elastic registra-
tion so as to align its anatomy with the anatomy of
the images in the dataset. The result of registration
is a mapping function from each point in the refer-
ence to a point in the target image that enables de-
tailed shape description. The displacements are rep-
resented in a lower-dimensional space determined by
factor analysis and the corresponding transformation
coefficients, called loadings, are stored to be used in
the retrieval step. The querying phase follows the
same steps used to convert the images into descriptive
scores. The query image converted to the correspond-
ing score vector is compared with the database, the
most similar images are retrieved and presented to the
user.
2 RELATED WORKS
The effective and efficient representation of similar
shapes has been an old aspiration of the computer vi-
sion research community. Unlike gross scalar features
such as area, perimeter and compactness, the descrip-
tion of shape requires more complex sets of variables.
175
Machado A..
Factor Analysis and the Retrieval of Medical Images Depicting Structures with Similar Shapes.
DOI: 10.5220/0004116901750180
In Proceedings of the International Conference on Knowledge Discovery and Information Retrieval (KDIR-2012), pages 175-180
ISBN: 978-989-8565-29-7
Copyright
c
2012 SCITEPRESS (Science and Technology Publications, Lda.)
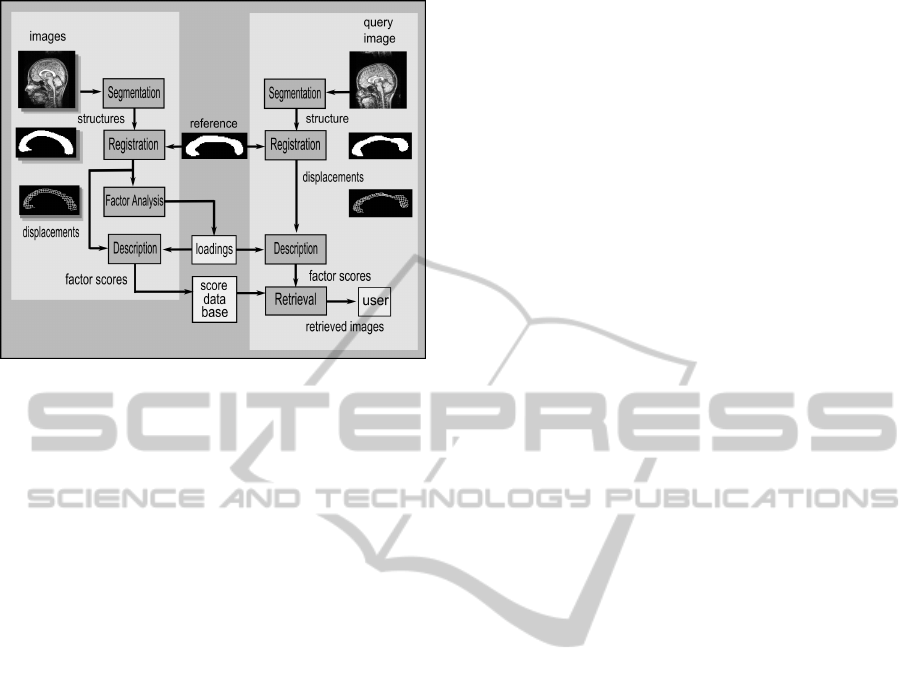
Figure 1: Schematic of a CBIR system based on registra-
tion. The left part of the scheme shows the steps performed
off-line for each image in the database. The on-line part of
the retrieval process is shown in the right. The link between
the on-line and off-line phases is the reference image that
is registered to the query and to the database, establishing a
basis for shape comparison.
Historically, the first attempt to represent shape was
based on the explicit selection of landmarks. Land-
mark techniques assume that the relevance of the vari-
ables to be selected is known in advance, thus limiting
the robustness of automatic algorithms (Bookstein,
1997). An alternative to manual data selection is the
implementation of automatic registration algorithms
that enable more detailed shape description (Golland
et al., 2001; Attalla and Siy, 2005).
The representation of shape has been frequently
addressed as a data reduction problem. Multivari-
ate analysis based on principal components (PCA) is
one of the most frequently used method to describe
shape variability. It can be found in the early works of
Sclaroff and Pentland (1995) and Cootes and Taylor
(1999), applied to features and landmark data analy-
sis, and in the works of Le Briquer and Gee (1997),
which extends PCA to the high-dimensional sets of
variables resulting from registration. PCA and its
two-dimensional version are frequently used to the
recognition and retrieval of faces (Mohammed et al.,
2011) and biomedical images (Oliveira et al., 2010).
An alternative linear Gaussian model to PCA is
factor analysis (FA), which aims to explore the cor-
relation among the variables. When applied to shape
representation, FA may reveal aspects about the rela-
tionship between regions of interest and facilitates in-
terpretation. Nonetheless, the use of FA in shape rep-
resentation has been restricted to the representation
of gross measurements and landmarks, regardless of
exploring the relationship between pointwise shape-
related variables, as the ones obtained from image
registration (Reyment and J
¨
oreskog, 1996; Machado
et al., 2004).
The retrieval of images based on their content is
still a challenge. Lew et al. (2006) presents a compre-
hensive discussions on the main aspects of image re-
trieval. Muller et al. (2004) and Iakovidis et al. (2009)
show how CBIR systems can be used to retrieve im-
ages in general medical databases. Shape-based re-
trieval systems relies on the concise and effective rep-
resentation of the objects’ contours (Zhang and Lu,
2004; Shu and Wu, 2011) or skeletons (Xie et al.,
2008), as well as on methods that allows for shape
matching and the definition of similarity metrics (Xu
et al., 2009; Biswas et al., 2010).
Image retrieval is even more challenging when the
database to be searched is composed of images de-
picting objects of the same class, with uniform shape
and subtle differences, as in the case of biomedical
imaging (Mallik et al., 2010). In the next sections we
discuss how factor analysis can be used to reduce the
dimensionality of complex shape representation and
allow for effective retrieval of images depicting struc-
tures with similar shapes.
3 METHODS
3.1 Image Registration
The images in the database should be registered to
a reference in order to establish a common basis
for comparison. Image registration can be stated as
the process of determining a correspondence between
each pixel in a reference image to a pixel in the sub-
ject image (Gee, 1999). The result of registration is a
displacement vector for each pixel. When a structure
does not present texture information, registration may
be applied to the boundaries, and thin plate splines
used to interpolate the warping to the whole structure,
so that each pixel in the reference image is assigned a
displacement vector.
3.2 Image Description
The overwhelming amount of information resulting
from image registration should be properly handled
as a data reduction problem. Factor analysis is a pow-
erful multivariate analysis method that explores the
correlation among the variables of a problem. Simi-
larly to PCA, it makes it possible to manage the high-
dimensional datasets obtained from imaging modali-
ties. A fundamental feature of FA is that, in addition
to data reduction, it may favor data interpretation.
KDIR2012-InternationalConferenceonKnowledgeDiscoveryandInformationRetrieval
176

In PCA, the original p × N data matrix X com-
posed of N subjects at a p-dimensional centered vari-
able space is rotated in order to find the orthogonal
axes along which the data is maximally spread out.
Data reduction is achieved by taking only the first m
rotated variables (principal components). It can be
shown that the rotation matrix that causes the data to
align with the principal components is the orthogo-
nal m × p matrix B
T
whose rows are the eigenvectors
of the covariance matrix associated with the m largest
eigenvalues. The rotated data matrix Z is given by
Z = B
T
X. (1)
In factor analysis, the p × N data matrix Y com-
posed of N subjects at a p-dimensional standardized
variable space is represented as linear combinations
of m hypothetical constructs called factors:
Y = AF + E, (2)
where F is m × N matrix of common factors, E is the
matrix of unique factors which account for the por-
tion of Y that is not common to other variables, and
A is the p × m loading matrix. The coefficients of A,
called loadings, express the correlation between vari-
ables and factors. The factor analytic model assumes
that common and unique factors are not correlated and
have null expected values. The covariance matrix for
the common factor is the identity matrix.
Considering the assumptions of the factor analytic
model, the variance of a given variable can be decom-
posed into components related to the common and
unique factors. Since AF and E are not correlated, the
covariance matrix of their sum is the sum of the co-
variance matrix of each term. Also, since cov(F) = I,
the relationship between the data covariance matrix,
S, and the covariance matrix of the unique factors, P,
can be written as
S = cov(AF +E) = cov(AF) + cov(E)
= Acov(F)A
T
+ P = AA
T
+ P.
(3)
Many techniques have been proposed to determine A.
The simplest one, called principal factor method, ne-
glects P and uses spectral decomposition to represent
the covariance matrix S:
S ≈ AA
T
= QLQ
T
= (QL
1/2
)(QL
1/2
)
T
, (4)
where L
1/2
is the diagonal matrix with the square root
of the m largest eigenvalues of S, and Q is the p × m
matrix of the corresponding eigenvectors. Therefore,
the loading matrix can be estimated based on the sam-
ple covariance matrix as
A = QL
1/2
. (5)
An important property of the loading matrix A is
that it can be rotated and still be able to represent
the covariance among factors and original variables.
The rotation of loadings plays an important role in
factor interpretation, as it is possible to obtain a ma-
trix that assigns few high loading for each variable,
keeping the other loadings small. The quartimax al-
gorithm (Reyment and J
¨
oreskog, 1996) is an orthog-
onal rotation method that maximizes the variance of
the squared loadings in each column of the loading
matrix, so that each variable presents high loading for
fewer factors.
Once the linear coefficients are determined (and
rotated, in the case of FA), we may want to repre-
sent the original dataset in the new lower-dimensional
variable space. This is done by computing the prin-
cipal component scores, Z, and factor scores, F, for
each subject in the sample. In PCA, Z is directly com-
puted from (1). In FA, F can be computed based on
(2), replacing the loading matrix A by its rotated ver-
sion R = AT, where T is the m × m orthonormal ma-
trix determined by the quartimax algorithm. We also
desire that the common factor scores, F, maximally
represent Y, so that the specific factors may be mini-
mized in a mean squared sense. The factor scores can
thus be obtained by solving the overdetermined linear
system Y = RF, viz.,
F = R
T
QL
−1
Q
T
Y. (6)
3.3 Image Retrieval
In a CBIR system based on image registration, the
user presents an image as a query, which is registered
to the reference image. The features obtained from
the resulting mapping function are compared to the
features of the images stored in the database, which
have been previously processed and registered to the
same reference. Following a measure of similarity,
the most similar images are retrieved and presented to
the user. In this work, the metrics used to determine
the similarity between two images were the Euclidean
distance and the cosine of the angle between their cor-
responding vector representation in the factor space
(Lew, 2010).
The effectiveness of an image retrieval system can
be evaluated by computing two metrics: The recall of
the system is the ability to retrieve relevant images.
It is defined as the ratio between the number of re-
trieved images considered relevant and the total num-
ber of relevant images in the database. The precision
reflects the ability of the system to retrieve only rel-
evant images. It is defined as the ratio between the
number of retrieved images considered relevant and
the total number of retrieved images. The plot of re-
call × precision for the results of a query gives an
estimate of the effectiveness of a CBIR system, as a
FactorAnalysisandtheRetrievalofMedicalImagesDepictingStructureswithSimilarShapes
177

compromise between both performance metrics is ex-
pected. Since a CBIR system should be evaluated for
a set of queries, an average precision value for each
level of recall is usually computed. Moreover, a sin-
gle average precision value for all queries, computed
based on all levels of recall is of interest, as it provides
a simple way to compare the performance of different
approaches.
4 EXPERIMENTS
The ability of the proposed CBIR system to retrieve
images from large homogeneous datasets is illustrated
with a case study on the morphology of the corpus
callosum, the largest bundle of axons connecting the
two hemispheres of the brain, whose shape variation
is related to many degenerative and genetic deseases.
The MRI images used in the experiments are a set of
299 patients and normal controls recruited for a study
on schizophrenia. The images were divided into 4
groups: one composed of a single subject used as a
reference for registration; 6 subjects of varying shapes
used as queries; 50 subjects used to evaluate the pre-
cision of the system; and the remaining 242 subjects
used to compute the eigenvalues and the loadings for
the PCA and FA transformation models. The pro-
vided images had been previously segmented by su-
pervised thresholding for other studies. For each seg-
mented image, the boundary of the callosum was au-
tomatically determined using the Rosenfeld algorithm
for 8-connected contours and the pointwise curvature
of the callosum contour computed for each subject,
using the k-curvature metric (Gonzalez and Woods,
2002). Registration was performed, by aligning the
reference image to all 298 subject’s images of the
dataset through dynamic programming, based on the
elastic matching algorithm. Average registration time
was 2.9 s. All methods were implemented in IDL 7.0
and run in a 2.66 GHz Intel Quad Core 2 processor
computer with 4 GB of RAM, under Windows XP op-
erating system.
Centered data matrix X and the standardized data
matrix Y were formed by taking the x and y compo-
nents of the displacement fields obtained from regis-
tration, at each of the 2830 pixels of the callosal tem-
plate, in a total of 5660 variables for each of the 242
subjects. Data reduction was performed through PCA
and FA, based on different number of components.
The computational costs for the off-line steps, consid-
ering 12 components, were: 4.6 s for the eigendecom-
position of the data matrices; 0.5 s for the computa-
tion of the rotated loadings; 15 ms for the computation
of the PCA scores; and 16 ms for the computation of
(a)
(b)
Figure 2: Example of retrieval based on FA (a) and PCA
(b) considering 12 components and the Euclidean distance.
The first structure in each image is the query. The remain-
ing structures, from left to right, top to bottom, are the 15
first retrieved structures for each method. The structures
considered relevant by an expert rater are shown in black.
the factor scores.
The evaluation of the methods was based on the
response of a group of 10 voluntary raters selected
from staff, graduate and undergraduate students of the
university (3 females and 7 males; age 20-42), with no
previous training on neuroanatomy. The users were
asked to select up to 10 structures considered to be
similar to each of the 6 query images, from the set
of 50 candidate images randomly displayed in a sep-
arate chart. For each query, the 10 most voted images
were considered to be relevant. The average number
of votes per query ranged from 3.6 to 4.7. Addition-
ally, the evaluation of relevance was performed based
on the judgment of an expert, in order to evaluate the
impact of the user perception on the results. It should
be noticed that both the queries and the set of 50 im-
ages used in the evaluation step were excluded from
the data used to compute the eigenvectors and load-
ings.
An example of the results of image retrieval based
on FA and PCA, considering 12 components and the
Euclidean distance, is shown in Figure 2. The first
structure in each image is the query. The remaining
structures, from left to right, top to bottom, are the 15
first retrieved structures based on each method. The
structures considered relevant by the expert rater are
shown in black. It can be seen that FA was able to
provide much better precision than PCA, retrieving 7
relevant structures, while PCA could retrieve only 3.
The superiority of FA was observed throughout the
experiments. Figure 3 shows an average precision ×
KDIR2012-InternationalConferenceonKnowledgeDiscoveryandInformationRetrieval
178
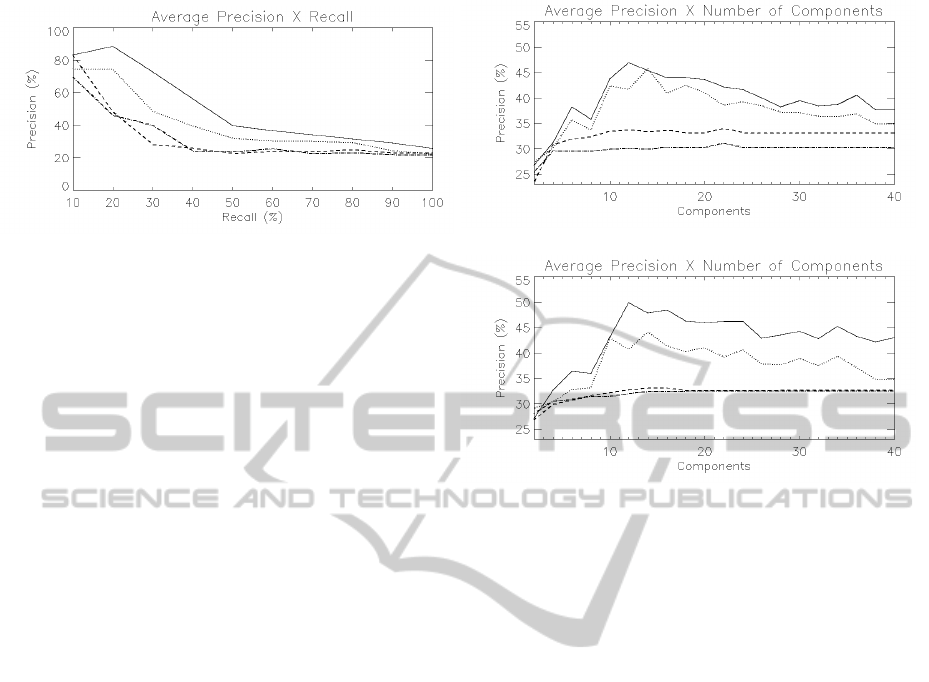
Figure 3: Average precision × recall plot considering 12
components and the Euclidean distance. The precision axis
shows an average of the precision for the 6 queries, at differ-
ent values of recall, based on FA for the expert (solid) and
for the group of raters (dotted), and based on PCA for the
expert (dashed) and for the group of raters (dash-dotted).
recall plot, computed over all queries, based on FA
and PCA for the expert rater and for the group of
raters. Regardless of the rater’s perception of similar-
ity, the FA representation was consistently more pre-
cise to retrieve relevant images, yielding 80% of av-
erage precision for 25% of recall, while PCA yielded
only 42%. The cost of the retrieval step, considering
12 components, was dominated by the computation
of the PCA scores (15 ms) and the FA scores (16 ms),
with other execution times being neglectably small.
The impact of parameter m (number of factors or
principal components) and the similarity metric was
investigated in a set of 960 experiments. The num-
ber of components varied from 2 to 40. The results
obtained with the Euclidean distance were generally
better than the ones obtained with the cosine metric.
The most effective number of components to repre-
sent the shape of the structure was around 12. Fig-
ure 4 summarizes the results in a plot of the overall
average precision as a function of the number of com-
ponents, based on the cosine metric and the Euclidean
distance. The precision axis shows an average of the
precision taken at all levels of recall and considering
all the 6 queries, based on FA and PCA for the two
groups of raters. The results of FA were consistently
superior to the ones based on PCA, regardless of the
similarity metric, number of components and user’s
perception, showing that the method should be seri-
ously taken into account while designing CBIR sys-
tems for the retrieval of similar shapes represented in
high-dimensional variables spaces.
5 CONCLUSIONS
A CBIR system based on factor analysis for the re-
trieval of medical images depicting similar-shaped
(a)
(b)
Figure 4: Overall average precision × number of compo-
nents plot considering the cosine metric (a) and the Eu-
clidean distance (b). The precision axis shows an average of
the precision taken at all levels of recall and considering all
the 6 queries, based on FA for the expert (solid) and for the
group of raters (dotted), and based on PCA for the expert
(dashed) and for the group of raters (dash-dotted).
structures was presented. The representation of the
images in the factor score space is advantageous as the
amount of information that should be accounted for
is drastically reduced. The method makes it possible
to manage the information obtained from image reg-
istration which is a pointwise displacement field for
each image in the database. The correspondence of
these new variables to morphological features in the
structure is possible, since FA aims to represent the
correlation among original variables, instead of prin-
cipal modes of variance, as is the purpose of PCA.
The association of factors to shape variability con-
tributes to the retrieval effectiveness, as shown in the
experiments.
The method’s ability to retrieve relevant images
was exemplified in a study of the corpus callosum, a
structure with very subtle shape differences. The fac-
tor analysis approach overperformed PCA in all sce-
narios. The relevance of the method relies in the fact
that it may serve as a sophisticated visual informa-
tion retrieval model for structures with complex shape
variability, in which small differences should be ac-
counted for.
The method deserves more systematic evaluation
with different structures and larger set of raters, as vi-
FactorAnalysisandtheRetrievalofMedicalImagesDepictingStructureswithSimilarShapes
179

sual perception is subjective and difficult to quantify.
Relevance feedback is another important step to be
considered. Different similarity functions associated
to relevance feedback may enhance the effectiveness
of image retrieval, as the user’s preferences are more
rapidly met. The method’s ability to retrieve images
of the same group may qualify image retrieval as a po-
tential knowledge discovery tool. It implements new
levels of supporting environments and opens new per-
spectives to exploratory research in image databases.
ACKNOWLEDGEMENTS
This work was supported by FAPEMIG (PPM
00416/11), CNPq (481989/2010-2, 301907/2010-2)
and INCT-MM (FAPEMIG: CBB-APQ-00075-09 /
CNPq 573646/2008-2. The author is grateful to the
University of Pennsylvania for sharing the callosum
data.
REFERENCES
Attalla, E. and Siy, P. (2005). Robust shape similarity re-
trieval based on contour segmentation polygonal mul-
tiresolution and elastic matching. Pattern Recogn,
38(12):2229–2241.
Biswas, S., Aggarwal, G., and Chellappa, R. (2010). An
efficient and robust algorithm for shape indexing and
retrieval. IEEE T Multimedia, 12(5):372–385.
Bookstein, F. L. (1997). Landmark methods for forms with-
out landmarks:morphometrics of group differences in
outline shape. Med Image Anal, 1(3):225–243.
Cootes, T. and Taylor, C. J. (1999). A mixture model for
representing shape variation. Image Vision Comput,
17(8):567–574.
Gee, J. C. (1999). On matching brain volumes. Pattern
Recogn, 32:99–111.
Golland, P., Grimson, W. E. L., Shenton, M. E., and Kiki-
nis, R. (2001). Deformation analysis for shape based
classification. LNCS, 2082:517–530.
Gonzalez, R. C. and Woods, R. E. (2002). Digital Image
Processing. Prentice-Hall, Upper Saddle River.
Iakovidis, D. K., Pelekis, N., Kotsifakos, E. E., Kopanakis,
I., Karanikas, H., and Theodoridis, Y. (2009). A pat-
tern similarity scheme for medical image retrieval.
IEEE T Inf Technol B, 13(4):442–450.
Le Briquer, L. and Gee, J. C. (1997). Design of a Statistical
Model of Brain Shape. LNCS, 1230:477–482.
Lew, M., Sebe, N., Djeraba, C., and Jain, R. (2006).
Content-based multimedia information retrieval: State
of the art and challenges. ACM T Multimedia Comput,
2(1):1–19.
Lew, M. S. (2010). Principles of Visual Information Re-
trieval. Spring-Verlag, London.
Machado, A., Gee, J. C., and Campos, M. (2004). Structural
shape characterization via exploratory factor analysis.
Artif Intell Med, 30:97–118.
Mallik, J., Samal, A., and Gardner, S. L. (2010). A content
based image retrieval system for a biological speci-
men collection. Comput Vision Image Und, 114:745–
757.
Mohammed, A. A., Minhas, R., Wu, Q., and Sid-Ahmed,
M. A. (2011). Human face recognition based on mul-
tidimensional pca and extreme learning machine. Pat-
tern Recogn, 44:2588–2597.
Muller, H., Michoux, N., Bandon, D., and Geissbuhler, A.
(2004). A review of content-based image retrieval sys-
tems in medical applications-clinical benefits and fu-
ture directions. Int J Med Inform, 73(1):1–23.
Oliveira, J., Machado, A., Chavez, G., Lopes, A., Deserno,
T., and Arajo, A. A. (2010). Mammosys: a content-
based image retrieval system using breast density pat-
terns. Comput Meth Prog Bio, pages 289–297.
Reyment, R. and J
¨
oreskog, K. (1996). Applied Factor Anal-
ysis in the Natural Sciences. Cambridge University
Press, Cambridge.
Sclaroff, S. and Pentland, A. (1995). Modal matching for
correspondence and recognition. IEEE T Pattern Anal,
17(6):545–561.
Shu, X. and Wu, X. (2011). A novel contour descriptor
for 2d shape matching and its application to image re-
trieval. Image Vision Comput, 29:286–294.
Xie, J., Heng, P., and Shah, M. (2008). Shape matching
and modeling using skeletal context. Pattern Recogn,
41(5):1756–1767.
Xu, C. J., Liu, J. Z., and Tang, X. (2009). 2d shape
matching by contour flexibility. IEEE T Pattern Anal,
31(1):180–186.
Zhang, D. S. and Lu, G. J. (2004). Review of shape repre-
sentation and description techniques. Pattern Recogn,
37:119.
KDIR2012-InternationalConferenceonKnowledgeDiscoveryandInformationRetrieval
180
