
Observability of Transportation Systems
A Methodology for Reliability Analysis in Logistics and Manufacturing
Jan Pinkowski
1
and Axel Hahn
2
1
OFFIS Institute for Information Technology, Escherweg 2, Oldenburg, Germany
2
Department of Computing Science, Carl von Ossietzky University,
Ammerlaender Heerstrasse 114-118, Oldenburg, Germany
Keywords: Reliability Analysis, Material Flow, Observability, Information Flow, Logistics.
Abstract: Real world events are observed by sensors since decades, for instance in the logistics where packages are
identified and tracked. This information result in an information flow. This information flow is used to
control the physical material flow. Hence, the information flow is a digital representation of the physical
material flow. However, to guarantee that the digital representation is in alignment to the physical world is a
challenging task. Especially for scenarios with manual operations, the representation is vulnerable for
errors. This paper proposes a generic approach to assure consistency between digital and physical world.
The paper presents a methodology to model the monitoring of physical entities and to analyse the model to
evaluate the risk of unreliable digital representation.
1 INTRODUCTION
Today, many parts of our all-day life are affected by
the use of sensors, devices and machines. Especially
at work, people are assisted by technique for
instance in a factory to produce, transport, register,
and analyse goods. Even human-free environments
where those processes are automated are more and
more common. However, humans as well as
Computer Integrated Manufacturing (CIM)
applications are working with their own
representation of the physical world. The digital
representation is generated by interpreting sensor
data. In any cyber physical system the consistency of
the digital representation and the physical world is
of crucial importance. Manufacturing Execution
Systems (MES) use this representation for steering
and controlling of manufacturing systems. When the
representation differs from the physical world, the
system is not reliable.
As an example we consider cross-docking
scenarios in warehouses. Each warehouse has
various incoming and outgoing packages daily.
Incoming trucks supply new packages to a
warehouse. Within the warehouse, conveyors such
as forklift trucks, belt and roll conveyors, transport
the packages to defined outgoing ports of the
warehouse. In order to control the transport,
packages must be identified. This identification is
done with sensors in the warehouse. The digital
representation holds and provides this information to
the conveyors. If a sensor identifies a package
wrongly, the digital representation differs from the
real world. Errors within the representation therefore
may lead to lost packages, inefficiencies etc. In
order to reduce such errors, stakeholders take
individual measures to ensure the correctness of the
digital representation.
However, this leads to the following questions:
How good is the monitoring of the system? How can
the correctness of the generation of the digital
representation be assessed? In general, the digital
representation abstracts from physical world systems
with its processes. For complex systems the
reliability of a system depends on the reliability of
each of the subsystems. Our focus is to develop a
generic methodology to evaluate the reliability of the
digital representation of material flow by evaluating
the subsystems to retrieve reliability for the overall
system. The paper is organised as follows: we start
with the related work in section 2, in which we
reference current research and define our approach
in contrast. This is followed by an overview of the
methodology where all phases with the
548
Pinkowski J. and Hahn A..
Observability of Transportation Systems - A Methodology for Reliability Analysis in Logistics and Manufacturing.
DOI: 10.5220/0004120605480551
In Proceedings of the 9th International Conference on Informatics in Control, Automation and Robotics (ICINCO-2012), pages 548-551
ISBN: 978-989-8565-22-8
Copyright
c
2012 SCITEPRESS (Science and Technology Publications, Lda.)
corresponding measures will be described. Each
phase of the methodology in section 3 is separated
into a subsection where we present goals, measures
and which techniques can be used. We conclude
then with a summary and outlook for future work.
2 RELATED WORK
When planning a warehouse with forklifts, storage
space and belt conveyors, simulation is most
commonly used. The major goal at this stage is the
efficiency and throughput of the warehouse. Those
values are determined with tools like Plant
Simulation (Bangsow, 2010). Our goal is to add the
perspective of reliability to the planning process of
transportation systems within warehouses.
Therefore, we use the risk analysis method Fault-
Tree-Analysis (FTA) (Lee, 1985). This method is
common in safety-relevant areas such as avionic
(ARP 4761) or automotive (ISO 26262). In the
logistics, safety and reliability analysis is not yet
prescribed. However, the application of such
methods can also decrease the financial risks of
errors in the transportation process. Essential for the
analysis is a model of the corresponding system.
Among various other model methods, there are some
basic technologies such as petri nets (Petri, 1962) or
Markov Chains (Spiegelhalter, 1995) that already
have been applied in the logistics. Current research
combines model and analysis approaches. In
(Buchacker, 1999) extended fault trees are used to
model the behaviour of a system and petri nets to
analyse the fault tree. In contrast, (Reza, 2009)
combine traditional petri nets and fault trees to
derive a forward and backward reachability analysis
method. Whereas our approach is a qualitative and
quantitative reliability analysis, by combining risk
analysis and process modelling.
3 METHODOLOGY
We introduce a generic method to detect risks of
misalignment of the physical world and its digital
representation for material handling operations. The
sequential phases and used methods are described in
the following subsections. This methodology with
modelling and risk analysis functions will be
implemented in a software tool. We propose the
application at design and planing time of a
transportation system.
3.1 Process Analysis Phase
The first phase in the methodology is the process
analysis. This means that the corresponding material
flow process is analysed to identify the interactions
between the following components:
• Actors: active roles that interact with the
environment
• Objects: passive objects that are used by an
actor
• Activities: actions that relate actors with
objects.
The major goal of this phase is to understand the
corresponding process. This knowledge is essential
for the following modelling phase and the later
evaluation.
3.2 Modelling Phase
Once, the Process Analysis phase is finished, and the
components are identified, we develop a model of
the system.
3.2.1 Model Structure
The model structure contains modelling constructs
which are the basis to build a model of the system. It
also contains the relation between these constructs.
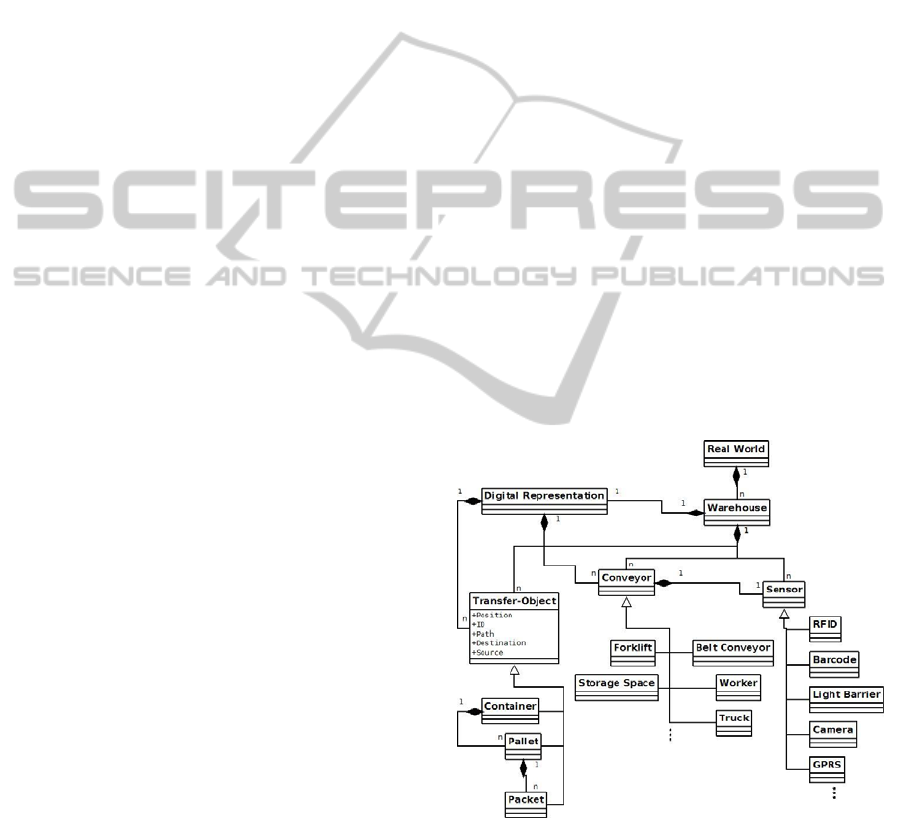
An excerpt of the structure is depicted in fig. 1.
Figure 1: Excerpt of the conceptual Model.
It illustrates the three major components: conveyors,
sensors and transfer-objects. These components are
involved in the transfer from real world to
representation. The digital representation contains
transfer-objects (TO) with attributes position, id and
path. The attribute id represents the unique identifier
ObservabilityofTransportationSystems-AMethodologyforReliabilityAnalysisinLogisticsandManufacturing
549
of each package. Path is an accumulation of the
positions where a TO was detected. To steer the
transport in the warehouse, there are also planned
paths in the digital representation. For controlling
purpose the planned and the actual path can be
compared. The real world consists of multiple
warehouses that interact with each other by
conveyors that transport goods. Each warehouse has
its own representation of the transportation process.
A warehouse has internal and external conveyors to
transport goods within, to, or from a warehouse.
The conveyors and sensors within a warehouse
provide information about the current status of the
transportation process. This information is used to
build a digital representation of the real world
transportation process.
3.2.2 System Model
The system model is an instance of the model
structure and contains detailed information about all
identified components involved in the analysed
process. An example of a system model is a special
warehouse layout, with conveyors and sensors at
defined positions with a defined behaviour. In
general, such models are used to abstract from the
complex real world using the outcome of the process
analysis. In our methodology the model instance is
the basis for the reliability evaluation, described in
section 3.3. The content of the model depends on a
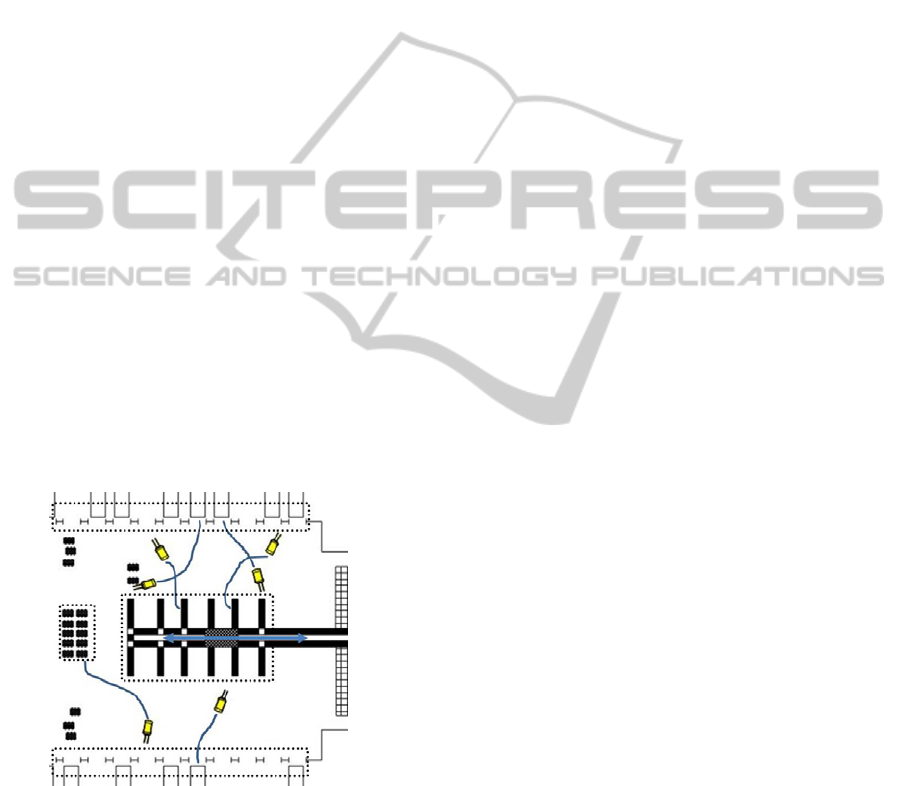
specific system, as illustrated in figure 2.
Figure 2: An Example Warehouse Layout.
The warehouse consists of forklifts, several belt
conveyor modules, packages, sensors and storage
space. Each conveyor has its own behaviour that
must be modelled to represent the material flow.
Also sensors have their own behaviour, because
different sensors detect different events with
different accurateness.
Sensors in the real world are not perfect. The use
of sensors is always related to failures and
restrictions. Typical restrictions are temperature,
humidity or light restrictions where the sensor
measurements contain errors. But also under ideal
conditions sensors are not perfect. In order to
evaluate the reliability and observability of the
material flow, the sensors play a major role.
3.3 Reliability Evaluation Phase
In (Laprie, 2001) the reliability is defined as the
”continuity of correct service”. Continuity means
that the reliability requirement applies to the whole
runtime. Correct service in our context stands for the
consistency between real world and representation.
”The validity of the reliability analysis of a system is
directly related to the validity of the model used to
represent the system” (Allan, 1992). In (Allan, 1992)
there are two main categories of reliability
evaluation techniques: analytical and simulation. A
popular analytical technique in research and
industrial practice is model checking (Clarke, 1999).
These complementary techniques are compared in
(Harris, 2006). It has been shown that simulation is
not complete in terms of error detection and model-
checking is vulnerable to state explosion problems in
complex systems. Therefore, simulation is the
common technology to analyse complex
transportation processes in the logistics. These can
be classified as dynamic, deterministic and discrete
(Law, 2000). After a model has been analysed by
simulation or model-checking, we evaluate the
actual reliability in the process. In (Allan, 1992) one
tool for reliability evaluation is probability theory
which helps to transform knowledge of the system
into a prediction of its likely future behaviour. In our
case we examine the components involved in the
transfer between real world and representation in
order to reveal errors and to distinguish the
probability for an error of a component. When all
components are described with probability theory,
the relation between components and the process is
known, then the reliability evaluation of the
components can be expanded to the whole system,
for instance by quantitative fault tree analysis.
We derive reliability from observability. This
means that the material flow is reliable when we
observe at any time any package within the material
flow. Also with a high degree of observability we
cannot exclude failures during the material flow, but
the system is able to recognise failures at the time
they appear. This recognition is done by sensors at
the spots where packages are transferred between
conveyors. At these spots the system compares the
digital representation with the real world. But as
ICINCO2012-9thInternationalConferenceonInformaticsinControl,AutomationandRobotics
550

introduced in section 3.2.2 sensors contain errors.
These errors are also part of the reliability evaluation
that helps to improve the design of a planned
warehouse.
3.4 Measures Phase
There are two main ways by which the reliability
can be affected. The first relates to quality and the
second to redundancy (Allan, 1992). Quality
concerns the components used in the system, in our
context the involved components on the transfer
between real world and representation. This includes
also personnel with their experience and training.
These human factors play an important role in the
reliability of systems (Allan, 1992). Redundancy
helps to improve reliability of a system, in case a
component fails that there is another component that
can do the function and does not fail.
The reliability evaluation reveals spots with a low
degree of observability. To improve observability at
this spots a measure is to use redundancy and
heterogeneity of sensors.
4 CONCLUSIONS
As introduced in the previous sections, we defined
the methodology with its phases. Which
technologies are applied exactly in the phases will
be evaluated in regard to their applicability, analysed
and compared in the next step. Afterwards we will
define a scenario to apply this methodology to a
specific transportation system. We will then analyse
and model the scenario with its transportation
process, and evaluate the reliability. The knowledge
obtained from the first iteration of the methodology
will be used to optimise the scenario system, for
example with new or redundant sensors. At the end
we will derive an optimised transportation system
with a reliable material flow, and a refined
methodology with applied specific modelling
technologies.
In order to support reliability analysis as an
additional aspect for planning of transportation
systems, we will develop a graphical tool. This tool
contains a graphical editor to create system models
as described in section 3.2.2. These models consist
of conveyors, sensors and packages. Defined state
transitions are used to represent the material and the
information flow. Based on this model we use Fault-
Tree-Analysis (FTA), as an automated risk analysis
method within the tool to evaluate reliability of the
planned warehouse at design and planning time. The
components within the model are annotated with
error probabilities to enable qualitative and
quantitative FTA. By combining the error
probability of the components with the FTA we
retrieve a calculation method with relation of the
components within the transportation system. The
modelling and risk analysis results are then
compared to evaluate vulnerable spots in the model.
REFERENCES
Allan, R. B. (1992). Reliability Evaluation Of Engineering
Systems: Concepts And Techniques. Springer.
Bangsow, S. (2010). Manufacturing Simulation with Plant
Simulation and Simtalk. Berlin: Springer.
Buchacker, K. (1999). Combining Fault Trees And Petri
Nets To Model Safety-Critical Systems. In Society for
Computer Simulation International (S. 439--444)
Harris, S. V. (2006). Error Detection Using Model
Checking vs. Simulation. In High-Level Design
Validation and Test Workshop.
Clarke, E. M., Grumberg, O., Peled, D. A. (1999). Model
Checking. The MIT Press.
Laprie, J. C. (2001). Fundamental Concepts of
Dependability. In Technical Report Seriesuniversity of
Newcastle Upon Tyne Computing Science (S. 7-12).
Law, A. M. (2000). Simulation Modeling and Analysis.
New York: McGraw-Hill.
Lee, W. S.; Grosh, D. L.; Tillman, F. A.; Lie, C. H.; , "Fault
Tree Analysis, Methods, and Applications A Review",
IEEE Transactions on Reliability, pp.194-203
Petri, C. A. (1962). Kommunikation mit Automaten. Bonn.
Reza, H. A. (2009). A Safety Analysis Method Using
Fault Tree Analysis and Petri Nets. In Proceedings of
the 2009 Sixth International Conference on
Information Technology: New Generations (S. 1089 -
1094). Washington DC: IEEE Computer Society.
Spiegelhalter, W. G. (1995). Markov Chain Monte Carlo
in Practice. Chapman & Hall.
ObservabilityofTransportationSystems-AMethodologyforReliabilityAnalysisinLogisticsandManufacturing
551
