
Creating an Educational Roadmap for Engineering Students via
an Optimal and Iterative Yearly Regression Tree using Data Mining
Marie Khair, Chady El Moucary and Walid Zakhem
Notre Dame University – Louaize, North Lebanon Campus, Barsa, El Koura, Lebanon
Keywords: Educational Data Mining, Cart, Optimal Regression Tree, Courses Roadmap, GPA, Engineering Schools,
Splitting Criteria, Pruning Levels, Precision.
Abstract: Targeting high academic standards is required in engineering studies. Advisors usually play an important
role in helping students keeping good records and transcripts along their educational path by helping them
choose their courses and keeping track of their grades. However, performance in some courses in the
curriculum embodies determining repercussions and might inadvertently jeopardize the overall students’
Grade Point Average (GPA) in an irreversible manner. The purpose of this paper is to draw an educational
roadmap that helps advisors and students being aware of the turning points that decisively affect their
overall cumulative GPA and act upon a current outcome. This roadmap is based on Classification and
Regression Trees where nodes and branches denote the aforementioned courses and students’ performance,
respectively, with the ultimate outcome being the overall student’s GPA upon graduation. The tree is
constructed based on a relatively large number of records with 10-fold cross-validation and testing.
Moreover, the tree is produced on a yearly basis with a twofold objective. The first is to secure a high level
of precision by applying it over a short period of time and the second is to allow for injecting each-year
computed GPA with the remaining courses as to reflect the actual situation with maximum vraisemblance.
This iterative and recursive tree achieves a very close tracking of students’ performance and provide a
powerful tool to rectify courses’ track and grades for each student individually while aiming at a predefined
final GPA. Furthermore, the choice of the optimal tree was carefully examined in the light of the relatively
elevated number of attributes. In this context, diverse models were created and performance and/or
precision were computed in terms of different values of “pruning levels” and “splitting criteria”. The choice
of the best tree to be adopted for advising is thoroughly explained. Besides, it is shown, in this context, that
the structure of the tree remains highly versatile in the sense that it can be revisited at any point for further
assessment, adjustment, and expansion. Finally, yet importantly, simulation results were carried out using
Matlab CART and demonstrated high efficiency and reasonably precise results.
1 INTRODUCTION
In the last decades, data mining has become an
indispensable tool in dealing not only with large
databases; it has been adopted as a solution for
drawing pertinent information and extracting hidden
knowledge in cases where the number of attributes is
relatively comparable to the number of records as
well (Kovačić and Green, 2010), (Fayyad et al.,
1996), (Piatetsky-Shapiro, 1991), (Baker and Yacef,
2009). It is known that patterns can be drafted easier
when the number of samples is significantly large
but at the cost of computational requirements and
sophisticated data mining techniques (Thabtah,
2006). Nonetheless, it has been validated that
exercising data mining in some fields does not
require excessive amounts of data at the condition
that the data miner demonstrates an advanced level
of understanding of the figures he possesses.
Data mining finds innumerable applications in
almost all sectors and aspects of our society.
Amongst others, data mining is being extensively
such as medicine, forensics, banking, jurisdiction,
landscaping, astronomy, etc., notably when ad hoc
situations arise and when previous and lucid
practices have not yet been ruled (Silverstein et al.,
2000). Recently, Data Mining has being
interchangeably used with what it is referred to as
Knowledge Discovery in Databases or KDD
(Fayyad et al., 1996).
One interesting application of data mining is the
43
Khair M., El Moucary C. and Zakhem W..
Creating an Educational Roadmap for Engineering Students via an Optimal and Iterative Yearly Regression Tree using Data Mining.
DOI: 10.5220/0004130300430052
In Proceedings of the International Conference on Knowledge Engineering and Ontology Development (KEOD-2012), pages 43-52
ISBN: 978-989-8565-30-3
Copyright
c
2012 SCITEPRESS (Science and Technology Publications, Lda.)

field of Education. Indeed and in the last few years,
data mining has been adopted and validated as one
of the primary and foremost scientific methods used
in approaching different operational perspectives in
Colleges and Higher-Education Institution.
Furthermore, a standalone field of data mining has
emerged and is referred to as Educational Data
Mining or EDM (Sembiring et al., 2011), (Wook,
Yahaya et al., 2009), (Chadha and Kumar, 2011),
(Domingos, 2007), (hxxp://www.educationaldatami
ning.org), (Baker and Yacef, 2009). As a matter of
fact, Education has grown to such an extent where it
does not simply embrace teaching and education per
se, but it became a full-fledged business with
numerous departments requiring experts and
professionals from different disciplines to efficiently
support its operation. Additionally, data and
information that are being treated and/or processed
on daily, semestrial, and yearly basis, have
drastically increased to a point where traditional
methods and practices no more suffice. Academic
performance, students’ attrition, course offerings,
grant management, students’ behavior, etc. are
amongst many other issues and influential
parameters that necessitate innovative and potent
techniques for analysis and solutions (Al-Radaideh
et al., 2006), (Kovačić, 2010), (Portnoi et al.2011),
(Eshghi et al., 2011), (Al-Radaideh et al., 2011),
(Dekker et al., 2009), (Bardawaj and Pal, 2011).
Finally, dealing with the growth in the number of
students and the ever-changing teaching
methodologies dictate new prescription with solid
ground.
In this paper we will elaborately visit this side of
EDM by drafting an educational roadmap for both
students and advisors to help sustaining elevated
rates of success and more precisely target a desired
GPA upon graduation for engineering schools and
universities. The customary practice dictates that
academicians help their students keeping acceptable
performance by advising them during registration, in
the light of their previous achievements, on the type
and number of courses they need to enroll in (Portno
et al., 2011), (Oladokun et al., 2008), (Pal and
Baradwaj, 2011). However, performance in some
key courses proved to have irreversible
repercussions on students’ overall GPA. These
courses can be directly and/or indirectly prerequisite
for more advanced courses’ materials or refer to
some Physics and/or Math courses, or even language
courses, namely when studies are in a foreign
language. The situation relies on schools’ individual
programs and courses’ structure and thus, might
significantly vary. Consequently, advisors and
students might be misled in many cases at the
critical point of registration especially when students
advance along their curricula and the tree becomes
more complicated thus, involving more parameters
to embrace for an appropriate decision.
The purpose of the educational roadmap is to
draft a yearly decision tree that lucidly underlines
the courses that students should pay special attention
to in order to sustain a good performance.
Furthermore, the tree not only cites the courses but it
clearly indicates the grades that students’ have to
earn in order to attain their final GPA upon
graduation. In this sense, the roadmap creates a
scientific and computational direct link between the
outlines courses and a “targeted” performance for
engineering students upon graduation. The tree is
created for every year as to keep the closest possible
tracking system and the most likelihood that reflects
the actual students’ performance as well.
Additionally, two types of trees can and will be
elaborated with two different approaches. In the first
type, the tree exclusively includes the courses taken
during the current year of studies with the purpose of
emphasizing on the most important courses and their
respective grades for the targeted performance, for
that specific year. The second type of tree is
somehow recursive and individual since the
cumulative GPA of the previous year(s) will be
injected in the attributes as to indubitably reflect the
path of a given student and identify his/her current
situation and thus, derive pertinent decisions. The
roadmap is built using Data Mining Regression
Trees with a 10-fold cross validation. In this sense,
trees will be trained, validated then tested for their
efficiency.
This paper will be divided into five parts. After
the introduction, section II presents a quick
overview of data mining algorithms, approaches and
applications. In the third section, data is presented
and analysed. The innovative approach is
comprehensively outlined and explained as well.
Simulation results are shown in the frame of the
application and elaborate analysis is detailed to
demonstrate the effectiveness of the approach.
Additionally, section III includes a user manual for
the suggested educational roadmap. In section IV,
future scope of this study will be shortly presented.
Finally, conclusions and perspectives for future
work are drawn in section 5.
2 DATA MINING
There exist many definitions for data mining in
KEOD2012-InternationalConferenceonKnowledgeEngineeringandOntologyDevelopment
44

books and research papers (Witten et al., 2011),
(Han et al., 2011). They all refer to data mining as
an interdisciplinary field in computer science which
achieves interactive and iterative processes aiming at
unveiling hidden, but existing, patterns and/or
relationships amidst data using statistical and
mathematical procedures with a prime objective of
providing decision support systems with information
and knowledge. Generally, data mining can be
referred to for two different objectives. The first is
predicting future values of some variables of interest
based on a recorded database of evidences. The
second, referred to as description, focuses on finding
hidden patterns relating data features. The latter
exercise finds its application in Knowledge-
Discovery-in-Database (KDD) cases where the
former one is an objective in machine learning
applications.
2.1 CART for Data Mining
Exercising data mining requires primary steps for a
reliable outcome. The collected data is to be
subdivided for training, testing, and validation. In
our case, we used 70% of the data for training, 15%
for cross-validation and 15% for testing. During the
training stage, a temporary model is engendered and
which simulates rudimentary relationships between
the attributes and the targeted output. An important
stage follows and which is referred to as validation.
This stage reveals crucial and decisive namely when
the number of attributes is relatively elevated
compared with that of the samples. The outcome
will be a general enhancement of the model’s
accuracy where over-fitting occurrences are reduced
and non-existing patterns are avoided. Additionally,
typical glitches could be circumvented such as
undesirable memory characteristic that results in a
false generalization. For instance, assume that in the
selected data for training, all students who have
passed a certain course have obtained a GPA beyond
a certain value; we do not want the model to
remember or create this relationship (Silverstein et
al., 2000). Furthermore, an overall performance key
is the pruning level or more precisely the splitting
value. It is a number “n” such that impure nodes
must have “n” or more observations to be split.
Besides, during the cross-validation stage, the cost
of the tree is the sum over all terminal nodes of the
estimated probability of that node times the node's
cost. If “t” is a regression tree, the cost of a node is
the average squared error over the observations in
that node. The cost is a vector of cost values for each
subtree in the optimal pruning sequence for “t”. The
resubstitution cost is based on the same sample that
was used to create the original tree, so it
underestimates the likely cost of applying the tree to
new data (Thabtah, 2006). Once validation is
performed, testing is used to evaluate the validated
model. In this stage, new or untrained data is applied
with the purpose of gauging the model. Here the
expertise of the data miner plays a key role; miners
should use their savvy to assess the performance and
accuracy of the model. In some cases, using
different algorithms or revisiting the entire
procedure might reveal necessary. Finally, when the
model is satisfactory, the data miner shall transform
the outcome into information and knowledge to be
adopted for future decision-making and analysis.
2.2 Data Mining Tasks
Data mining objectives can be carried out by means
of various procedures, frequently called tasks (Wu
and Kumar, 2009). Thus a further categorization of
data mining is obtained:
Classification: The most frequently used
classifiers are Decision Trees, Bayesian and Neural
Networks, etc. and which are widely used in
Handwriting and Speech Recognition, Web Search
Engines, etc. (Quinlan, 1986).
Regression: This task aims at
forecasting/calculating the probability or the value
of a variable via an iterative minimization of some
error functions. Classification And Regression Trees
(CART) are primary procedures for this task. It is
referred to as classification or regression if the
variable to be forecasted is nominal (belongs to a
certain defined set) or continuous (assumes infinite
number of values), respectively (Quinlan, 1986).
Clustering: K-Means and Fuzzy Clustering are
well-known techniques used for this purpose with
applications found in typical unsupervised learning
cases such as in Image Analysis, Biology and
Medicine, Education, etc. (Nock and Nielsen, 2006)
Association Rule Learning or Dependency
Modelling: The “Apriori” algorithm is the most
famous procedure used to identify frequent itemsets
in a database and deriving association rules. It is
mainly used in applications involving decisions
about marketing activities such as in supermarkets as
well as in the fields of Web Mining, Bioinformatics,
etc. (Agrawal et al., 1993), (Piatetsky-Shapiro, 1991)
Deviation/Outlier Detection: This is exercised in
applications such as Data Security for Fraud and
Intrusion Detection. (Denning and Dorothy, 1986).
Link Analysis: This task is practiced when
traditional approaches reveal inefficient (Getoor,
CreatinganEducationalRoadmapforEngineeringStudentsviaanOptimalandIterativeYearlyRegressionTreeusingData
Mining
45

2003).
3 PROBLEM STATEMENT AND
EDUCATIONAL ROADMAP
As previously mentioned, targeting high academic
standards is required in engineering studies. This
requirement not only reveals necessary throughout
the curriculum but is a prerequisite to entering a
highly competitive job market. Moreover, if the
engineering curriculum involves a BS followed by a
Master degree, this requirement becomes a turning
point in a student’s academic path. Acquiring certain
grades in major and technical courses is also a
primary goal for those students and is, in most cases,
a necessary condition for graduation. As it is known,
advisors usually play an important role in helping
their students sustaining good transcripts along their
studies; they are responsible for helping them choose
their courses based on their performance in order to
avoid situations such as falling under probation or
suspension. Nonetheless, and due to the fact that
engineering curricula involves courses from
diversified disciplines, the situation becomes
intriguing and complex. More specifically,
identifying courses that are a key for success might
reveal cumbersome.
Furthermore, a vital educational aspect that
haunts the mind of colleges’ and higher-education
institutions’ academicians is the performance of
their students throughout their academic path.
Curricula have become diversified involving
numerous courses from different disciplines that
sometimes leave students and academicians not
incapable of identifying the turning points and key
courses in dealing with some situations such as
avoiding probation, suspension, or more precisely
target a desired cumulative GPA) upon graduation.
This situation becomes more critical when dealing
with certain majors such as engineering (Oladokun
et al., 2008), (Kabra and Bichkar, 2011). Indeed,
when pursuing either a five-year Bachelor-of-
Engineering program or a three-year Bachelor-of-
Science followed by a two-year Masters-of-Science
or Engineering program, high academic standards
become a must notably at early stages of studies. It
is known that students’ transcripts should
demonstrate acceptable performance in major and
technical courses and a certain GPA is required for
graduation. The merciless competition in the job
market as well as in the Higher Education sector
only adds another burden on the advisors’ shoulders
making students’ performance a vital and decisive
attribute in the final outcome and eligibility.
Additionally, different values of splitting will be
comprehensively studied with the objective of
choosing the optimal tree for each year. The splitting
value in regression trees is a determining factor in
the estimation process’ precision and efficiency.
Additionally, correlation between the actual and
estimated values of students’ GPA will be studied as
to endorse and validate this choice. The correlation
analysis will be conducted exclusively on the testing
data without involving any trained records as to
undoubtedly yield a truthful and reliable choice. The
study conducted in this paper involves a little over
one thousand samples that were scrupulously
analysed, screened and pre-processed before
application to the data mining process. Three
hundred five samples were retained (Silverstein et
al., 2000). Simulation results demonstrated a highly
efficient outcome namely in terms of the testing
phase.
The objective of our research is to provide both
students and advisors a tool that we will call
educational roadmap with the primary goal of
keeping an accurate track of their academic route.
This roadmap is based on regression trees generated
on a yearly basis and which offer a straightforward
tool for follow up regarding each individual student
in choosing a well-defined academic performance
upon graduation. More precisely, the inputs to the
tree are the grades obtained in selected courses and
the output is the estimated final cumulative GPA.
The estimated GPA is not only an output but is a
choice determined by students upon enrolling in
engineering majors. In this sense, this approach is
innovative since it does not merely estimate the
GPA based on students’ grades in early stages but it
is rather a bottom-up approach. Students start from
the bottom of the tree and draw their path upward
while identifying the criteria that should be met for
their choice. The aforesaid key courses are
determined using regression analysis performed on a
relatively large number of engineering students’
records. According to the tree, students and advisors
can identify the weaknesses and/or strengths that
hinder and/or foster their choice. Moreover, the
generated trees offer the possibility to revisit the
grades of students in each of these courses on a
yearly basis and thus, allow them to rectify their
path by not only repeating those courses, but in
determining the minimum grade they should obtain
as well.
Two types of trees are produced on a yearly
basis. The first type aims at pinpointing the most
important courses whose weights contribute the
KEOD2012-InternationalConferenceonKnowledgeEngineeringandOntologyDevelopment
46

most towards the desired GPA and irreversibly
affect their path. The second type is based on
iterative trees created with students’ previous GPA
injected in the inputs. In this sense, a student’s
current GPA becomes one of the attributes in the
dataset during training, validation and testing. This
type of feedback allows for a more precise
projection of the real status of each student and
significantly augments the precision of the final
outcome.
3.1 Data Presentation and
Pre-processing
Data was gathered from 1100 students already
graduated from the Electrical and Computer and
Communication Engineering. Should a course be
repeated, the latter grade would replace the previous
one. A course can be repeated voluntarily should a
student require or be required to raise his GPA, these
students were excluded from this study as their final
grade point average was increased voluntarily
Several screening and pre-processing stages have
been applied to cleanse the data and eliminate
extreme cases which present misleading
relationships. Finally, three hundred five records
have been retained and which represent random
situations with diversified cases embracing the most
frequently encountered in a student’s life. The table
below summarizes the samples recorded with
regards to their performance.
Table 1: Distribution of Students' Records.
Overall
Performance
Number of
Students
Cumulative
%
Relative
%
GPA ≤ 2.0 0 0.00%
0.00%
2.0 < GPA ≤ 2.7 104 34.10%
34.10%
2.7 < GPA ≤ 3.3 128 76.07%
41.97%
3.3 < GPA ≤ 4.0 73 100.00%
23.93%
Table 2: Snapshot of the Students' Records.
3.2 Identifying the Optimal Regression
Tree
70% of the dataset records were applied to Matlab
CART algorithms with an added 15% for a 10-fold
cross validation. Another innovative approach in our
research was the study of the effect of the splitting
value to the precision of the obtained trees for every
year and for every type. To this purpose, 15% of
untrained data records were used to evaluate the
precision of the trees based on different values of
splitting criteria. For each splitting value, testing was
applied and precision of the estimated GPA was
computed. It is noteworthy to mention that the
splitting value should not exceed a certain value
based on the number of records; otherwise the
precision will degrade in a drastic manner. With a
splitting value of one, the tree will be extremely
cumbersome to read or follow despite the fact that
the precision is very high (near to 99%). The
objective is to choose a compromise that yields a
readable tree or roadmap while keeping an
acceptable precision.
Additionally, correlation is computed solely
based on the testing data in order to accentuate the
credibility and reliability of our model in the choice
of an optimal splitting value for an optimal
regression tree. It will be applied on a double-
column matrix of 15% of the untrained data, thus
comparing estimated GPA with the actual values.
The most familiar measure of dependence between
two quantities is the Pearson product-moment
correlation coefficient, or Pearson's correlation. It is
obtained by dividing the covariance of the two
variables by the product of their standard deviations.
The Pearson correlation is +1 in the case of a perfect
positive (increasing) linear relationship (correlation)
and as it approaches zero there is less of a
relationship (closer to uncorrelated), (Dowdy, and
Wearden, 1983).
3.2.1 Regression Tree for the First Year of
Engineering
In this section, a regression tree was generated for
all the courses taken by engineering students during
their first year of studies. The purpose of this tree is
threefold. First it underlines the key courses that
affect students’ performance with respect to their
performance upon graduation. Second, it shows the
deciding grades that should be obtained in these
courses and which would determine the further
bifurcation and thus, trap students into a descending
subtree. Finally, it estimates their final cumulative
1111111122222222222223333333
ENL230
ENL213
PHS212
CHM211
MAT211
MAT213
MAT215
MAT224
PHS213
MAT235
MAT335
MAT326
CSC212
CSC213
CSC312
EEN201
EEN202
EEN220
EEN210
EEN203
EEN221
EEN311
EEN324
EEN340
EEN344
EEN331
EEN312
EEN325
1
1.02.72.34.01.73.03.74.01.02.01.01.73.73.32.33.74.03.32.03.33.72.03.32.31.71.72.04.0
2
2.32.71.02.71.72.32.31.71.72.71.01.01.71.73.32.71.71.71.73.32.31.72.02.01.71.72.33.3
3
2.33.01.03.01.02.73.02.32.32.71.02.03.33.02.72.01.73.71.71.72.31.72.02.32.02.72.01.7
4
3.33.02.34.03.34.03.73.72.73.73.73.71.72.73.04.04.03.03.74.04.03.03.03.02.73.04.04.0
5
2.73.33.73.02.34.01.72.73.03.02.32.73.03.33.33.34.03.33.34.03.72.33.33.33.33.33.03.3
6
2.72.73.34.02.73.31.02.02.32.73.02.33.03.72.72.33.32.03.04.03.73.03.72.72.73.04.04.0
7
3.73.73.04.04.04.04.04.04.04.04.04.04.04.04.04.03.74.04.04.04.04.04.04.04.04.04.04.0
8
3.73.73.74.04.04.04.04.04.04.04.04.04.04.04.04.04.04.04.03.74.04.04.04.04.04.03.74.0
9
3.73.73.04.04.04.04.04.04.04.04.03.74.04.04.04.04.04.04.04.04.04.04.04.04.04.04.04.0
10
3.01.74.03.73.04.04.03.73.04.04.04.04.03.34.03.73.74.03.74.04.03.73.33.73.33.34.03.0
11
2.01.73.72.03.03.73.33.31.73.73.32.74.03.04.02.73.04.03.34.04.02.34.03.02.73.04.04.0
12
3.02.03.31.73.74.04.03.74.04.01.73.72.03.33.32.33.32.73.34.04.03.03.73.33.73.74.04.0
13
3.33.73.73.33.33.03.33.73.04.04.04.03.73.74.03.73.33.33.03.73.73.74.03.33.33.73.73.7
14
1.02.01.02.73.02.02.72.32.32.33.33.73.74.02.73.01.74.02.34.03.73.02.72.32.03.33.33.3
15
2.32.02.33.02.71.71.31.02.01.31.32.31.71.72.01.72.02.72.33.33.31.71.72.01.72.03.31.7
16
1.72.71.33.02.32.03.32.01.02.32.03.73.73.32.31.73.32.02.03.33.31.71.72.32.01.72.72.7
17
2.31.71.02.31.01.02.01.01.32.72.33.03.02.72.03.31.71.72.03.03.72.01.72.02.72.32.74.0
18
1.03.02.71.03.02.32.31.31.01.71.71.72.72.02.33.03.32.72.04.03.72.32.72.72.72.04.04.0
19
3.02.02.73.03.03.33.03.33.73.74.03.33.03.03.73.03.32.33.74.04.02.73.33.03.03.03.73.3
20
3.02.31.72.32.72.72.72.72.73.04.02.02.72.73.02.02.32.72.34.03.32.74.03.03.73.03.73.3
21
3.72.72.74.03.33.03.73.03.03.04.03.03.34.03.03.03.04.03.04.04.03.03.33.03.33.34.03.7
22
3.33.32.04.04.04.02.03.32.33.03.02.73.74.03.32.01.73.33.04.04.03.34.04.03.32.34.03.0
23
3.02.71.73.33.32.73.02.72.03.03.73.03.73.34.03.03.32.33.34.04.03.33.32.32.73.04.04.0
24
3.73.04.04.04.04.04.04.04.04.04.04.03.34.03.74.04.04.04.04.04.04.03.74.04.04.03.74.0
Academic Year
Student
CreatinganEducationalRoadmapforEngineeringStudentsviaanOptimalandIterativeYearlyRegressionTreeusingData
Mining
47
GPA upon graduation based on their performance in
these courses.
It should be noted that many trees can be
produced depending on the splitting values. For a
value of one, the tree is cumbersome and contains a
very high number of nodes and branches although it
engenders a high precision. Nonetheless, and to
come up with a readable, yet acceptably reliable
tree, a study of the estimation precision error and
correlation has been conducted as shown below.
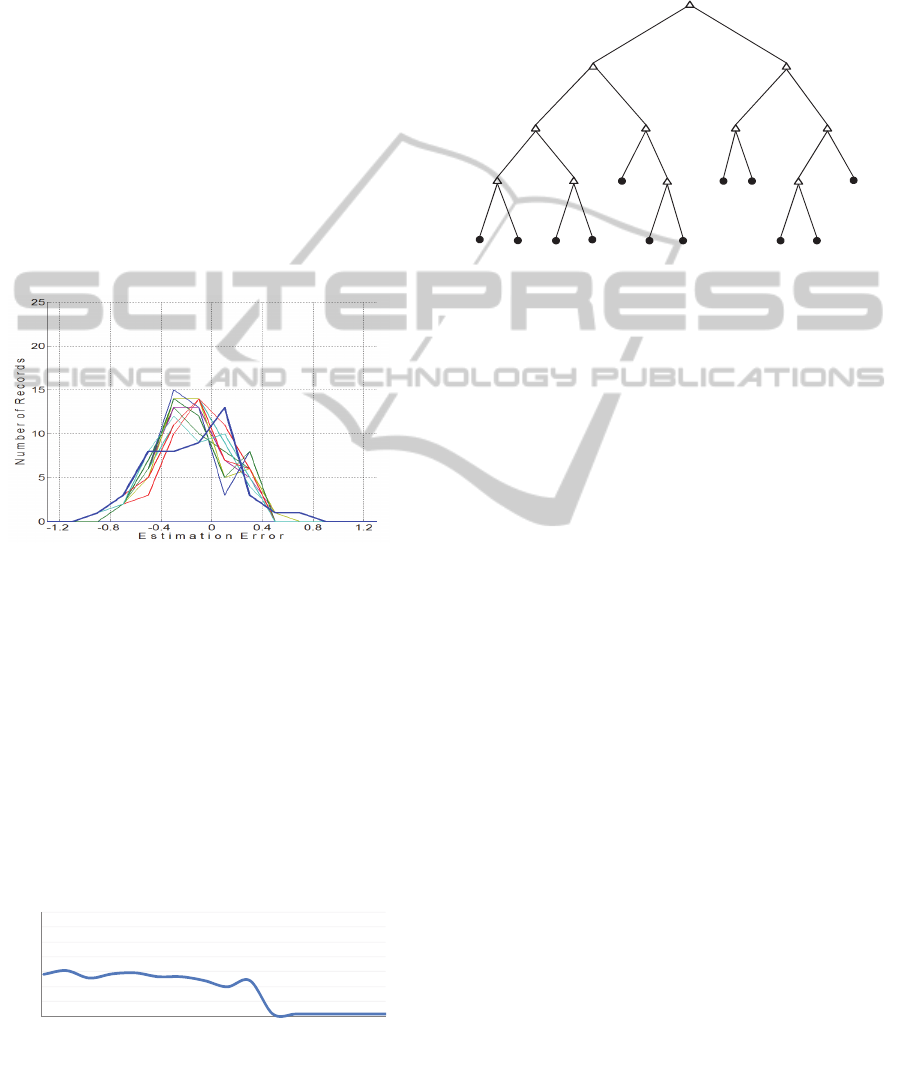
To this purpose and for each splitting value, the
difference between the estimated GPA and the actual
one are drafted as shown by figure 1 below. This
error is not calculated in the phases of training or
cross-validation but during the testing phase, i.e.
using new/untrained data. Figure 1 shows that most
of the errors are trapped between -0.3 and +0.3 for
most splitting values.
Figure 1: Estimation Error vs. Number of Students'
Records for Different Splitting Values (Year 1).
In order to endorse and have a different
perspective of this estimation error, Pearson
Correlation was applied on the set of the
aforementioned GPAs. Figure 2 shows that the
correlation is highly acceptable for splitting values
up to 50 beyond which, it starts to significantly
deteriorate. Hence, we had the choice of a splitting
value starting from 1 to 50. However, the number of
nodes and branches and thus, the shape and
readability of the tree are significantly affected
Figure 2: Correlation (Year 1): Estimated GPA vs. Actual
GPA for Different Splitting Values.
After some pertinent comparisons, it was found
that the value of 41 is the most adequate
compromise with a correlation of +0.8 or 80% and
Figure 3 below shows the regression tree obtained in
this case.
Figure 3: Regression Tree (Year 1) for Splitting Value of
41.
3.2.2 Regression Tree for Year “N”
In this section we will examine creating two types of
regression trees for the academic years following the
first year of studies. The first type of tree will
estimate students’ final cumulative GPA (upon
graduation) by exclusively encompassing the
courses taken by students during that year “n”. In the
second type, we will re-inject students’ previous
cumulative GPA in the attributes’ dataset and thus,
consider it as an additional input to the
aforementioned courses. It is understood that one
can create such types of trees of every year of
studies. Nevertheless, this process becomes useless
after the third year and this for two reasons. First,
students would have completed a relatively high
number of credits and thus, reversing or rectifying
their path would reveal impractical if not impossible.
Second, the third year is usually a turning point for
MS studies and/or for BE studies where students
would have to be screened. Therefore, we choose to
demonstrate the results for this particular year
knowing that the same procedure has been done for
the second year as well but it would not add new
information to this text.
Figures 4, 5 and 6 show the same results
obtained as for Year 1 but applied to Year 3 for the
first type of tree, i.e. without taking into account
students’ current cumulative GPA. The purpose of
the tree obtained is to pinpoint those courses taken in
Year 3 and which have greater impact on students’
later performance.
0.6 5
0.7 0
0.7 5
0.8 0
0.8 5
0.9 0
0.9 5
1.0 0
0 20406080100120140
Splitting Value s
Correlation
3.515
3.2541
3.172.9004
2.835
2.5332
2.48882.29
2.7421
2.8548
3.33
3.759
CHM211
PHS212MAT215
MAT224
MAT213MAT211MAT211
MAT224
MAT211
ENL230
ENL230
≥3.15
<3.15
<3.15 ≥3.15
≥3.15
<3.15
<2.15 ≥2.15
≥3.85
<3.85
<3.5 ≥3.5
<2.5
<2.5
<2.5 <2.5
≥2.5
≥2.5
≥2.5
≥2.5
≥2.5<2.5
KEOD2012-InternationalConferenceonKnowledgeEngineeringandOntologyDevelopment
48
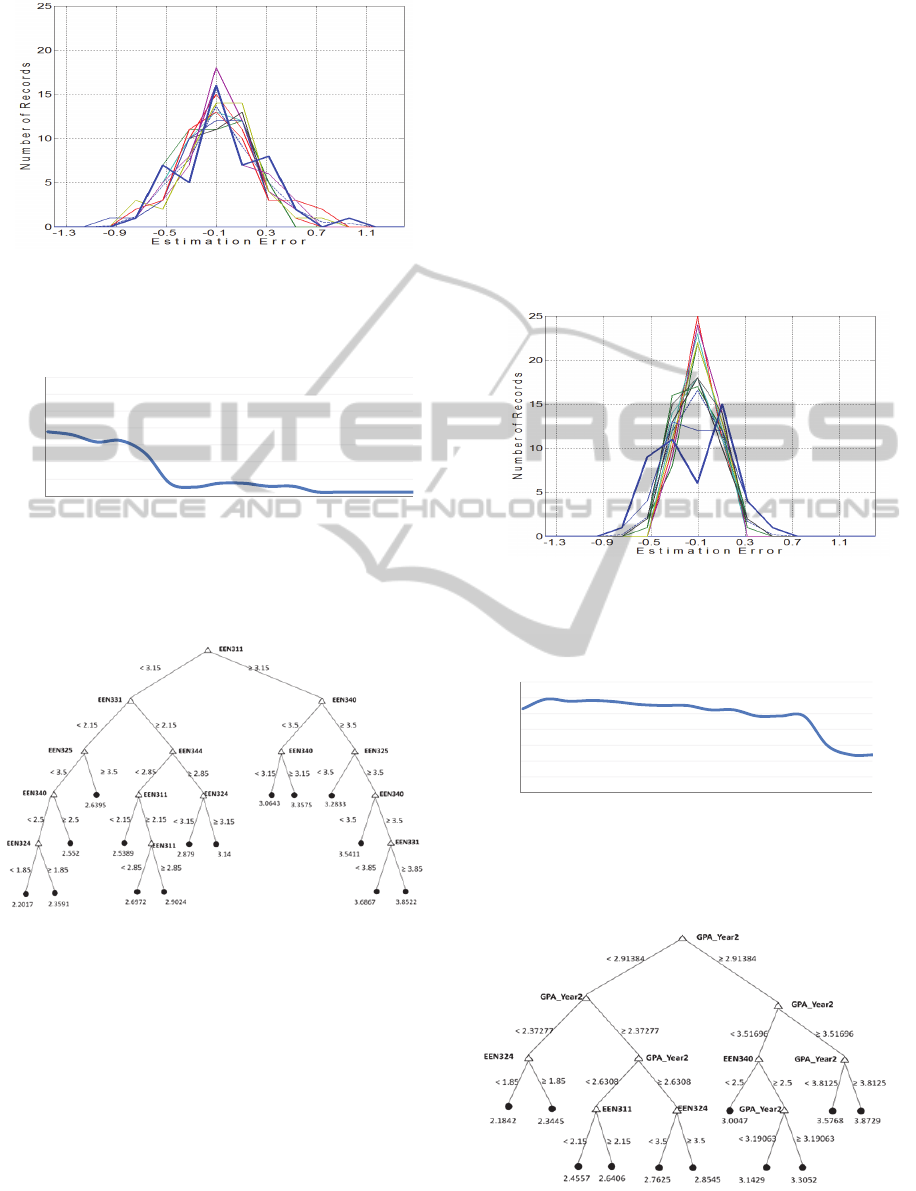
Figure 4: Estimation Error vs. Number of Students'
Records for Different Splitting Values (Year 3).
Figure 5: Correlation (Year 3): Estimated GPA vs. Actual
GPA for Different Splitting Values.
Figure 6: Regression Tree (Year 3) for Splitting Value of
41.
The figures below exhibit the iterative (second)
type of trees that take into account students’
previous cumulative GPA vs. their GPA upon
graduation. As it is expected, the most preponderant
determining factor (tree node) is the GPA computed
up to Year 2. This greatly endorses the credibility
and reliability of the study. Indeed, it clearly proves
that after two years of studies and thus, with more
than 70 credits accomplished, it would be
realistically difficult to modify a cumulative GPA in
a significant manner with new courses taken; the
GPA is a ratio with its denominator becoming
relatively bigger. Nonetheless, the obtained tree is
again a clear roadmap since it allows students and
advisors to identify which track (or subtree) they
would be following based on previous history.
Consequently, students can be advised to repeat
some courses in order to increase their current
cumulative GPA to start from a different node
according to a desired final performance upon
graduation. This is a powerful tool for advising and
follow-up on all cases.
Figure 7, 8, and 9 below show the results of
similar analysis and studies performed as above.
Figure 7: Estimation Error vs. Number of Students'
Records with Year-2 Cumulative GPA Injected (Year 3).
Figure 8: Correlation (Year 3) with Cumulative Year-2
GPA Injected.
Figure 1: Regression Tree (Year 3) for Splitting Value of
41 with Year-2 Cumulative GPA Injected.
0.6 5
0.7 0
0.7 5
0.8 0
0.8 5
0.9 0
0.9 5
1.0 0
0 20406080100120140
Splitting Values
Correlation
0.6 5
0.7 0
0.7 5
0.8 0
0.8 5
0.9 0
0.9 5
1.0 0
0 20406080100120140
SplittingValues
Correlation
CreatinganEducationalRoadmapforEngineeringStudentsviaanOptimalandIterativeYearlyRegressionTreeusingData
Mining
49

3.2.3 Result Analysis of the Educational
Roadmap – Advisors’ and Students’
Manual
Upon enrolling in engineering majors, students are
provided with a suggested or recommended first-
year curriculum to follow. Moreover, some courses
are enforced in the sense that they have to be taken
by students because either they are prerequisites for
later courses or according to each department’s
vision, students should pass these courses for
specific academic purposes. In any case,
performance in these courses will certainly have an
impact on students cumulative GPA as well on their
GPA upon graduation. Therefore, according to the
suggested tree, students and advisors can identify
those courses to be paid attention to and even
suggest a new “minimum passing grade” in order to
aim at a targeted final GPA. Moreover, the tree can
be used in a bottom-up manner in the sense that
students can start at the bottom, thus selecting a
targeted final GPA and work their way up going
through those nodes that decide of this choice and
hence, know in advance the performance required in
those powerful or key courses which have greater
impact on their target. In this manner, the suggested
trees constitute an educational roadmap and a
manual to be used by advisors and students to keep
track of their academic path.
This also applies to the remaining years of
engineering curricula. However, the second type of
trees which take into account a current cumulative
GPA injected in the attributes, allow a further and
wider look at the students’ path. It allows advisors to
rectify on a yearly basis and before “it is too late”
the courses and their respective grades students
should accomplish in order to attain their targeted
GPA upon graduation. For instance, if a second- or
third- year engineering student earn a GPA lower
than the one expected, rectifying steps can be
advised with lesser damage and efforts and namely
within shortest time. Finally, probation, suspension
or even keeping grants and scholarships can be
handled more efficiently based on enlightened
decisions.
The trees can be used in a cooperative manner
between the advisors and the students in line with
the importance given to the academic advising in the
higher educational process (Campell, 2008). As was
mentioned “academic advising supports key
institutional conditions that have been identified
with promoting student success”. In addition, as it
was noted by Titno (Titno, 2012)the five conditions
which stand out as supportive of retention were
expectation, advice, support, involvement, and
learning.
Our regression trees can be considered as a tool
used by both the academic advisor and the student to
schematize, evaluate and direct the road map of the
graduation requirements in an interactive method.
The purpose of not implementing the application as
an automated one similar to the work performed by
Werghi and Kanoun (Werghi and Kanoun, 2010) is
the importance we give to the interactive
cooperation between the advisor and the student in
order to achieve academic excellence. Consequently,
the approach presented in this paper, not only
emphasises on this trend, but offers a more
comprehensive and flexible tool as well.
4 PERSPECTIVE WORK - EVA
Earned Value Analysis (EVA) has proven to be an
extremely effective tool for project time and cost
management providing actual project completion
cost and date. One main contribution of EVA is
providing early indicators of problem areas either in
cost or in schedule so that corrective management
can be initiated (Leu and Lin, 2008), (Henderson,
2004). Other areas were tackled as well in order to
extend EVA analysis to fuzzy control or quality
evaluation (Noori et al., 2008), (Hong-yuan et al.,
2007).
EVA is used in combination with the estimation
of the cost and delivery date. In the educational
environment, the engineering degree can be
considered as a project with a specific estimated
time (measured in number of credits successfully
accomplished) and an estimated GPA upon
graduation.
In our case, the study duration is considered as
the five-year comprehensive curriculum (or 10
semesters); cumulative GPA as well as the number
of credits passed are computed at the end of each
semester. Target values of the aforementioned
parameters are specified by students at their
enrolment, and evaluation is performed to check
whether they are on the right track. In case of
deviation, the objective will be to
materialize/quantify this deviation from the targets’
starting values.
Pertinent parameters are derived in order to keep
track of students’ evolution such as Earned Values,
Credit Variance, Scheduled Variance, Performing
Index, and Schedule Index, amongst others.
The importance of the aforementioned
parameters is that they provide an accurate and
KEOD2012-InternationalConferenceonKnowledgeEngineeringandOntologyDevelopment
50

continuous evaluation of the efforts performed by
each student and a clear measure of their efficiency
in attaining the targeted starting values. More
specifically, these parameters can be appropriately
used to derive specific suggestion as rectify each
student’s path when calibration reveals necessary.
Finally, it is important to note that EVA analysis,
tools and charts would be a significant addition to
the educational roadmap developed in this paper.
5 CONCLUSIONS
In this paper we have presented an innovative
approach in using and applying Educational Data
Mining. An educational roadmap that reliably and
greatly endows both advisors and students a
straightforward manual for success. This roadmap is
built using Regression Trees with different types
elaborated in the frame of a continuous and close
follow-up of students’ performance. Correlation
Analysis and study of different splitting values of
the regression tress were extensively examined to
choose the best readable and useful tree/roadmap
while keeping a high rate of precision in the
estimation process. In this context, two types of trees
were developed and elaborately analyzed. The first
type identifies, on a yearly-basis, courses and their
respective grades which have greater impact on
students’ cumulative GPA upon graduation. The
second type is an iterative tree that re-injects the
current students’ GPA into the dataset as an
additional attribute. This proved to be a powerful
tool for decision making and endorsed the results
and the computed precision. The trees were trained,
cross-validated and tested. Calculation of the
precision and Correlation Analysis were achieved
based on untrained data to significantly enhance the
reliability of the outcome. Also a detailed
perspective of this study was presented under Earned
Value Analysis as a future scope of work and an
added tool for advising and monitoring students’
efforts, performance and evolution throughout their
engineering curricula.
REFERENCES
Kovačić, Z., Green, J., 2010, Research in Higher
Education Journal, Predictive working tool for early
identification of ‘at risk’ students, Open Polytechnic,
Wellington, New Zealand.
Sembiring, S., Zarlis, M., Hartama, D., Ramliana, S.,
Wani, E., 2011, International Conference on
Management and Artificial Intelligence, Prediction of
Student Academic Performance by an Application of
Data Mining Techniques, IACSIT Press vol. 6.
Wook, M., Yahaya, Y., Wahab, N., Isa, M., Awang, N. F.,
Seong, H. Y., 2009, In Proceedings of the Second
International Conference on Computer and Electrical
Engineering, Predicting NDUM Student’s Academic
Performance Using Data Mining Techniques, IEEE
computer society.
Al-Radaideh, Q., Al-Shawakfa, E., Al-Najjar, M. I., 2006,
The 2006 International Arab Conference on
Information Technology, ACIT'2006, Mining Student
Data Using Decision Trees.
Kovačić, Z., 2010, Proceedings of Informing Science & IT
Education Conference (InSITE). Early Prediction of
Student Success: Mining Students Enrolment Data
Portnoi, L. M., & Kwong, T. M., 2011, Journal of Student
Affairs Research and Practice, volume 48, No. 4.,
Enhancing the academic experiences of first-
generation master’s students.
Oladokun, V. O., Adebanjo, A. T., Charles-Owaba, O. E.,
2008, The Pacific Journal of Science and Technology,
Volume 9. Number 1., Predicting Students’ Academic
Performance using Artificial Neural Network: A Case
Study of an Engineering Course
Chadha, A., Kumar, V., 2011, International Journal of
Advanced Computer Science and Applications, Vol. 2,
No. 3., An Empirical Study of the Applications of Data
Mining Techniques in Higher Education
Pal, S., Baradwaj, B. K., 2011, International Journal of
Advanced Computer Science and Applications, Vol. 2,
No. 6., Mining Educational Data to Analyze Students’
Performance
Eshghi, A., Haughton, D., Li, M., Senne, L., Skaletsky M.,
Woolford, S., 2011, Journal of Institutional Research,
vol. 16, No.2., Enrolment Management in Graduate
Business Programs: Predicting Student Retention
Dowdy, S. Wearden, S., 1983, Statistics for Research,
Wiley. ISBN 0471086029 pp 230.
Domingos, P., 2007, Proceedings of Data Min. Knowledge
and Discovery, 21-28, Volume 15, Issue 1., Toward
Knowledge-Rich Data Mining
Fayyad, U. M.; Piaetsky-Shapiro, G.; Smyth, P., 1996,
Advances In Knowledge Discovery and Data Mining,
From Data Mining to Knowledge Discovery: An
Overview. AAAI/MIT press, Cambridge mass.
Witten, I. H., Frank, E., Hall, M. A., 2011, Data Mining:
Practical Machine Learning Tools and Techniques.
Morgan Kaufmann, Third Edition.
J., Han, M., Kamber, J., Pei, 2011, Data Mining: Concepts
and Techniques, Morgan Kaufmann, Third Edition.
Nock, R., Nielsen, F., 2006, IEEE Trans. on Pattern
Analysis and Machine Intelligence, Vol. 28, No. 8, On
Weighting Clustering, August 2006, p. 1–13.
Agrawal; R., Imielinski; T., Swami, A., 1993, Proceedings
of the ACM SIGMOD International Conference on
Management of Data, Mining Association Rules
between Sets of Items in Large Databases
Piatetsky-Shapiro, G., 1991, Knowledge Discovery in
Databases, Discovery, analysis, and presentation of
CreatinganEducationalRoadmapforEngineeringStudentsviaanOptimalandIterativeYearlyRegressionTreeusingData
Mining
51

strong rules, in G. Piatetsky-Shapiro & W. J. Frawley,
AAAI/MIT Press, Cambridge, MA.
Denning, D., 1986, IEEE Transactions on Software
Engineering - Special issue on computer security and
privacy, An Intrusion-Detection Model,
Getoor, L., 2003, ACM SIGKDD Explorations, Vol.5,
No.1. , Linking Mining: A New Data Mining
Challenge
Silverstein, C., Brin, S., Motwani, R., Ullman, J., 2000,
Data Mining and Knowledge Discovery, Volume 4,
Numbers 2-3, Scalable Techniques for Mining Causal
Structures
Quinlan, J. R., 1986, Machine Learning, 1:81-106,
Induction of Decision Trees
Thabtah, F., 2006, Journal of Digital Information
Management, vol. 4, no. 3, pp. 197-202., Pruning
Techniques in Associative Classification: Survey and
Comparison.
Baker, R. S. J. d., Yacef, K., 2009, Journal of Educational
Data Mining, vol. 1, issue 1, pp. 3-17., The State of
Educational Data Mining in 2009: A Review and
Future Visions
Al-Radaideh, Q., Al Ananbeh, A., Al-Shawakfa, E., 2011,
IJRAS volume 8, issue 2., A classification model for
predicting the suitable study track for school students
Dekker, G., Pechenizki, M., Vleeshouwers, J., 2009,
Proceedings of the Educational Data mining.
Predicting Students Drop Out: A Case Study
Bardawaj, B. K., Pal, S., 2011, International Journal of
Advanced Computer Science and Applications, vol 2,
issue 6. Mining Educational Data to Analyze Student’s
Performance
Kabra R., Bichkar, R., 2011, International Journal of
Computer Applications, volume 36, No 11, December.
Performance Prediction of Engineering Students using
Decision Trees
Noori, S., Bagherpour, M., Zareei, A., 2008, World
Applied Sciences Journal 3(4). Applying Fuzzy
Control Chart in Earned Value Analysis: A New
Application
Hong-yuan, F., Chuang-bin, H., Lang, Z., 2007, Journal of
Chongking University. Quality Earned Value Method
Based on Quality Evaluation
Camplell, S., 2008, Association of American Colleges and
Universities Peer Review, winter 2008, vol. 10, No 1.
Academic Advising in the new global Century:
Supporting Student Engagement and Learning
Outcomes Achievement
Tinto, V., 2012, Taking Student Retention Seriously,
retrieved from hxxp://faculty.soe.syr.edu/vtinto/
Files/Taking Student Retention Seriously.pdf, July
2012.
Werghi, N., Kamoun, F., 2010, International Journal of
Business Information Systems, Vol. 5, No. 1, pp 1-18.
A Cecision-Tree Based System for Student Academic
Advising and Planning in Information Systems
Programmes
Leu S., Lin Y., 2008, Journal of Construction Engineering
and Management. Project Performance Evaluation
Based on Statistical Process Control Techniques
Henderson K., 2004, The Measurable News. Further
Developments in Earned Schedule
Wu X., Kumar V., 2009, The Top Ten Algarithms in Data
Mining, CRC Press, Taylor & Francis Group.
KEOD2012-InternationalConferenceonKnowledgeEngineeringandOntologyDevelopment
52
