
Adaptation of the User Navigation Scheme using Clustering and
Frequent Pattern Mining Techiques for Profiling
Olatz Arbelaitz, Ibai Gurrutxaga, Aizea Lojo, Javier Muguerza, Jes´us M. P´erez and I˜nigo Perona
Dept. of Computer Architecture and Technology, University of Basque Country UPV-EHU,
M. Lardizabal, 1, 20018 Donostia, Spain
Keywords:
Adaptive Web, Link Prediction, User Profile, Collaborative Filtering, Machine Learning, Performance
Analysis.
Abstract:
There is a need to facilitate access to the required information in the web and adapting it to the users’ prefer-
ences and requirements. This paper presents a system that, based on a collaborative filtering approach, adapts
the web site to improve the browsing experience of the user: it generates automatically interesting links for
new users. The system only uses the web log files stored in any web server (common log format) and builds
user profiles from them combining machine learning techniques with a generalization process for data repre-
sentation. These profiles are later used in an exploitation stage to automatically propose links to new users.
The paper examines the effect of the parameters of the system on its final performance. Experiments show
that the designed system performs efficiently in a database accessible from the web and that the use of a gen-
eralization process, specificity in profiles and the use of frequent pattern mining techniques benefit the profile
generation phase, and, moreover, diversity seems to help in the exploitation phase.
1 INTRODUCTION
In recent decades, information in the web has in-
creased dramatically and this often makes the amount
of information intractable for users. As a result, there
is a need for easier access to the required informa-
tion and adapting it to the preferences and needs of
the users. That is, web personalization becomes es-
sential. Web personalization (Pierrakos et al., 2003)
can be defined as the set of actions that are use-
ful to dynamically adapt the presentation, the navi-
gation scheme and/or web content, based on prefer-
ences, abilities, or user requirements. Nowadays, as
described in (Brusilovsky et al., 2007), many research
projects focus on this area, especially in the context of
electronic commerce (Brusilovsky et al., 2007) and e-
learning (Garc´ıa et al., 2009).
This paper presents a step in that direction that
presents the design of a complete and generic sys-
tem to adapt web pages according to the browsing
preferences of the users and focuses on the analysis
of its performance depending on different design pa-
rameters. The proposed adaptation is to automatically
generate links to the user while she/he is navigating so
that her/his objective is reached more easily.
Adaptations of the web environments to specific
users in navigation time require a previous phase of
generating user profiles which can be explicitly pro-
vided by the user or learned using some intelligent
techniques. Although the first option might seem eas-
ier the most widely used method for obtaining infor-
mation about users is observing their actions (Schi-
affino and Amandi, 2009). User profiling implies
inferring unobservable information about users from
observable information about them, that is, their ac-
tions. In adaptive systems, the user profile is used to
perform the adaptation according to it.
Our research is contextualized in the use of web
mining (Mobasher, 2007) to build user profiles and
then propose adaptations to the website based on the
obtained profiles. This process requires a data acqui-
sition and pre-processing stage, then, in the pattern
discovery and analysis phase machine learning tech-
niques are mainly applied to find groups of web users
with common characteristics and the corresponding
patterns or user profiles. And finally, the patterns de-
tected in the previous steps are used in the operational
phase to adapt the system and make navigation more
comfortable for new users.
We have built a system based on the collaborative
filtering approach that takes as input server log files
stored in web Common Log Format (CLF) (W3C,
1995) and blends the supervised and unsupervised
machine learning techniques and pattern mining tech-
187
Arbelaitz O., Gurrutxaga I., Lojo A., Muguerza J., M. Pérez J. and Perona I..
Adaptation of the User Navigation Scheme using Clustering and Frequent Pattern Mining Techiques for Profiling.
DOI: 10.5220/0004130801870192
In Proceedings of the International Conference on Knowledge Discovery and Information Retrieval (KDIR-2012), pages 187-192
ISBN: 978-989-8565-29-7
Copyright
c
2012 SCITEPRESS (Science and Technology Publications, Lda.)

niques to build user profiles. The profiles will be used
in the future to adapt the navigation of new users pro-
viding them with links that they will probably use in
the future. The link suggestion to adapt the naviga-
tion can be done in different ways: including a float-
ing list of links, modifying the navigation bar, etc. In
this kind of systems the proposal of a large amount of
links would probably distract the user and wouldn’t
be very helpful. As a consequence, we priorize a re-
duced amount of useful links so that the user is not
confused. This means, in machine learningterms, that
high precision values will be preferable to high recall
values.
This paper is centered in evaluating how different
parameters of the system affect to its performance. To
evaluate our system we performed experiments in a
database accessible from the Internet containing web
server log information captured in NASA (Arlitt and
Williamson, 1995) (Wilson, 2010).
We developed the described system and conducted
experiments to try to answer the following research
question. Is it possible to automatically generate and
propose links to be used in the future to users? Which
is the influence of the proposed generalization proce-
dure when selecting interesting links for new users?
Does the specificity of the generated profiles affect to
the quality of the obtained profiles? Is it worth using
a frequent pattern mining algorithm to improve the
quality of the profiles instead of using a popularity
based strategy? How does the introduction of diver-
sity in the exploitation stage affect to the usefulness
of the proposed links?
The article summarizes in Section 2 the main char-
acteristics of the system we have developed and the
database used for experiments. The paper continues
in Section 3 presenting some of the results obtained
in the performed experiments. Finally, we summarize
in Section 4 the conclusions and future work.
2 PROPOSED SYSTEM
The work presented in this paper is a web usage min-
ing (Srivastava et al., 2005) application and as every
web usage mining process it can be divided into three
main stages: data acquisition and preprocessing (Coo-
ley et al., 1999), pattern discovery and analysis, and,
exploitation. Different approaches can be used to im-
plement each of these three steps; the ones we propose
and evaluate in this work are summarized in Figure 1.
The data acquisition phase has not been part of
our work. We have designed the system starting
from the data preprocessing step up to the exploita-
tion phase. The data we have used is from The In-
Generalization
Preprocess
Popularity/SPADE
Profiling:
k-NN
Predicted links
Adapted Scheme
New user
PATTERN
EXPLOITATION
PAM(K)
Clustering:
online
offline
DISCOVERY
Figure 1: Architecture of the proposed system.
ternet Traffic Archive (Danzig et al., 2008) concretely
NASA-HTTP (National Aeronautics and Space Ad-
ministration) database (Arlitt and Williamson, 1995;
Wilson, 2010). The information contained in this
database was obtained from a server located at NASA
Kennedy Space Center in Florida during two months
of the year 1995. The complete database contains
3,461,612 requests. The contained information is in
common log format (W3C, 1995) which is the mini-
mum information saved on a web server.
2.1 Data Preprocessing
The data preprocessing stage is the one that is more
tightly coupled to the concrete database. For the
rest of the phases we propose general procedures that
could be applied with little changes to any web envi-
ronment. Firstly, we filtered erroneous requests, im-
age requests, etc. that have not direct relationship
with user activity. Secondly, we performed the user
identification process based on IP addresses and fixed
the expire time of each session to 30 minutes of in-
activity (Liu, 2007). Among the obtained sessions,
we selected the ones with higher activity (6 or more
clicks). After finishing the data pre-processing phase,
the database was reduced to 346,715 requests and
31,778 sessions composed of at least 6 clicks where
a total of 1,591 different URLs are visited. We rep-
resented the information corresponding to each of the
sessions as a clickstream or sequence of clicks pre-
formed in the visited URLs.
Having too specific paths in the used data will
make complicated to draw conclusions from the out-
put of machine learning algorithms, because it is very
probable that navigation paths of different users, or
the same user in different moments, won’t be exactly
the same. In order to avoid this, we added a gener-
alization procedure to the URL representation which
aim is to represent the URLs with a higher level of
abstraction. This approach consists on erasing a frac-
tion of the segments from the right end of the path to
KDIR2012-InternationalConferenceonKnowledgeDiscoveryandInformationRetrieval
188

diminish their specificity. For each one of the visited
URLs, we obtained the length of the generalized URL
based on next expression:
max{MinNSegment, (1− α) ∗ NSegments} (1)
Where NSegments represents the number of
segments separated by ’/’ appearing in the URL.
MinNSegment represents the minimum number of
segments, starting from the root, an URL can have af-
ter the generalization step, whereas, α represents the
fraction of the URL that will be erased in the gener-
alized version. This generalization process will allow
us to work with a more general structure of the site
avoiding the confusion that too specific zones could
generate. For the NASA database we instantiated
MinNSegment to 3 and evaluated the system with a
range of values for α from 0 to 0.75. The experiments
showed that values larger than 0.5 saturated and, as a
consequence, we will show results for the following
values for α: 0 (not generalized), 0.25 and 0.5. In ad-
dition, the stages of the system where the generaliza-
tion is used can also be varied. Thus, we will evaluate
the effect of the values for α parameter as well as the
effect of using it or not in the different stages.
2.2 Pattern Discovery and Analysis
Unsupervised machine learning techniques have
shown to be adequate to discover user profiles (Pier-
rakos et al., 2003) in the pattern discovery and
analysis stage. We used PAM (Partitioning Around
Medoids) (Kaufman and Rousseeuw, 1990) clustering
algorithm and a Sequence Alignment Method, Edit
Distance (Gusfield, 1997)(Chordiaand Adhiya, 2011)
as a metric to compare sequencesand to groupinto the
same segment users that show similar navigation pat-
terns. PAM requires the K parameter to be estimated.
This parameter is related to the specificity of the gen-
erated profiles, when greater its value is more specific
the profiles will be. We didn’t have prior knowledge
of the structure of the data in NASA database and we
performed an analysis to try to find the value of K that
is enough to group the sessions with common charac-
teristics but does not force to group examples with not
similar navigation patterns in the same cluster. The
outcome of the clustering process is a set of groups of
user sessions that show similar behaviorbut we intend
to generate profiles. That is, to find the common click
sequences appearing among the sessions in a cluster.
To generate profiles or to discover the associated
navigation patterns for each one of the discovered
groups we evaluated two strategies: popularity and
frequent pattern mining. The popularity based strat-
egy selects the X most popular URLs in each cluster
as its profile. The amount of URLs to propose to the
user, X, has to be decided and the system does not
provide any kind of evidence for making this deci-
sion. The frequent pattern mining algorithm we used
to build profiles is SPADE (Sequential PAttern Dis-
covery using Equivalence classes) (Zaki, 2001) which
provides for each cluster a set of URLs that are likely
to be visited for the sessions belonging to it. The num-
ber of proposed URLs depends on parameters related
to SPADE algorithm such as minimum support and
maximum allowed number of sequences per cluster.
A fixed value for minimum support, 0.5, showed to
be a good option. With this value the designed system
becomes a self regulated system thatfinds an adequate
number of URLs to propose and achieves a balance
between precision and recall.
Although for the rest of the stages we experi-
mented with generalized and not generalized URLs,
we applied the SPADE algorithm using the original
URLs appearing in the user click sequence, because,
otherwise, the system would require an extra stage.
2.3 Exploitation
In the exploitation stage, the only part that has to be
done in real time, we propose the use of k-Nearest
Neighbor (Dasarathy, 1991) to calculate the distance
of the click sequence (average linkage distance based
on Edit distance (Gusfield, 1997)) of the new users
to the clusters generated in the previous phase. The
distance can be calculated at any stage of the naviga-
tion process, that is, from the first click of the new
user to more advanced navigation points. As a con-
sequence the system will propose to the new user the
profile corresponding to the nearest cluster. That is
the set of links that models the users in the clusters.
Those URLs are no generalized, because otherwise it
would be proposing zones of the web site, and, as a
consequence, the system would require an extra stage
in order to be useful for the final user.
At this point a question arises: will new users’ be-
havior be identical to the generated profiles or will
they have some similarities with more than one pro-
file? That is, will diversification help when generating
link proposals? To answer to the question we have an-
alyzed two options: 1-NN based approach, where just
the profile of the nearest cluster to the user is used
to make proposals, and, 2-NN based approach, which
combines two profiles, the ones belonging to the two
nearest neighbors clusters of the user.
AdaptationoftheUserNavigationSchemeusingClusteringandFrequentPatternMiningTechiquesforProfiling
189
3 EXPERIMENTS
3.1 Experimental Setup
The best validation strategy would be to perform a
controlled experiment where the users need to per-
form a concrete task and the improvement obtained
with the adaptation can be quantified. Since it is im-
possible to perform such an experiment for NASA
database, in order to perform the evaluation, we sup-
pose that if the proposed links are among the links
that the user will be using in the future, the proposal
will help her/him to achieve her/his objectives faster.
We applied the hold-out method dividing the
NASA database into two parts. One for training and
another one for testing. To simulate a real situation
we based the division of the database on temporal
criteria: we used the oldest examples (66% of the
database, 21,185 user sessions) for training and the
latest ones (33%, 10,595 user sessions), for testing.
We applied to the training data PAM clustering
algorithm with 3 different values for K parameter:
100 (P100), 200 (P200) and 500 (P500) combined
with different values for α generalization parameter:
0 (G00), 0.25 (G25), 0.5 (G50). Then, we generated
navigation profiles for each group of users using two
different approaches: one based on popularity (PP)
and another one based on SPADE (SP). To validate
the system, we used the test examples and we com-
pared the automatically generated links with the real
click sequences of the users. Note that even at this
point we are evaluating two options: the option where
each new user is modeled with a single profile (1-NN)
and the one where two profiles are used to model the
user (2-NN).
We performed the evaluation taking into account
that, when a user starts navigating, only its first few
clicks will be available to be used for deciding the cor-
responding profile and proposing new links accord-
ing to it. We have simulated this real situation using
10% (just one click out of 8; too early), 25% (S25)
and 50% (S50) of the user navigation sequence in the
test examples to select the nearest cluster or profile.
This way, we compared the number of proposed links
that are really used in the test examples (hits) and the
number of proposals that are not used (misses) and
calculated precision and F0.5-measure. Note that this
could be seen as a lower bound because, although not
appearing in the user navigation sequence, the pro-
posed links could be useful.
We calculated two values for the used statistics:
an upper bound (PrUp, FMUp) taking into account
the whole test sequence, and the values calculated us-
ing only the clicks in the test sequence that have not
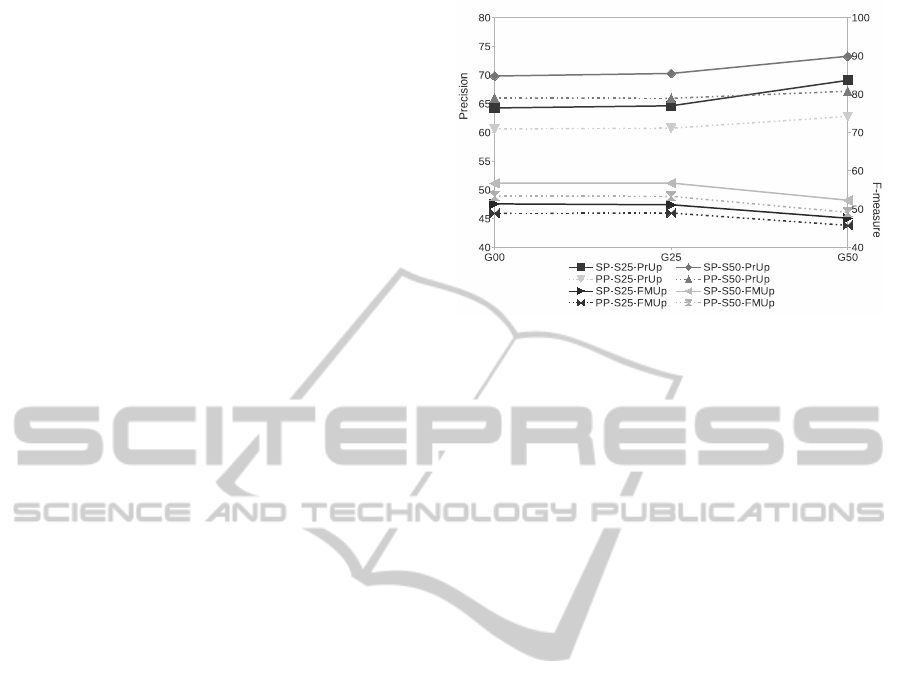
Figure 2: Precision and F-measure values achieved for
P100.
been used to select the nearest profile(Pr, FM); that is,
taking into account the remaining 90%, 75% or 50%
(for the cases 10%, 25% and 50% respectively).
3.2 Results and Analysis
We designed a wide range of experiments but due to
lack of space we will skip some results and summa-
rize some others. For example, in the exploitation
phase, the use of real URLs (G00) improves the re-
sults. Consequently, it will be done without general-
ization. On the other hand, we will show results only
for tests done at 25% and 50% of the navigation.
As a first stage to determine the best parameter
combination Figures 2, 3 and 4 summarize results for
different values of K parameter of PAM clustering
(P100, P200 and P500). The values in Axe X rep-
resent the different generalization degrees used in the
clustering (G00, G25 and G50) and the curves show
the upper bounds for precision and F-measure (PrUp
and FMUp) obtained using popularity based profiles
(PP, dashed lines) or SPADE based profiles (SP, con-
tinuous lines) and different portions of the user se-
quence for testing: 25% (S25) and 50% (S50). Every
result belongs to the 1-NN option. Although the fig-
ures only show values for PrUp and FMUp, the trends
of the graphics for Pr and FM (results obtained only
with not seen test sequence) are the same.
The first conclusion we can draw from the results
is that even if the values of the measured parameters
vary depending on the selected option, all of them are
able to predict a certain percentage of the links a new
user will be visiting. Furthermore, keeping constant
the rest of the parameters, SPADE based profiles are
more adequate than popularity based ones. Moreover,
it seems that taking into account F-measure values,
bigger K values seem to perform better. Nevertheless,
the improvement from P200 to P500 does not seem
KDIR2012-InternationalConferenceonKnowledgeDiscoveryandInformationRetrieval
190
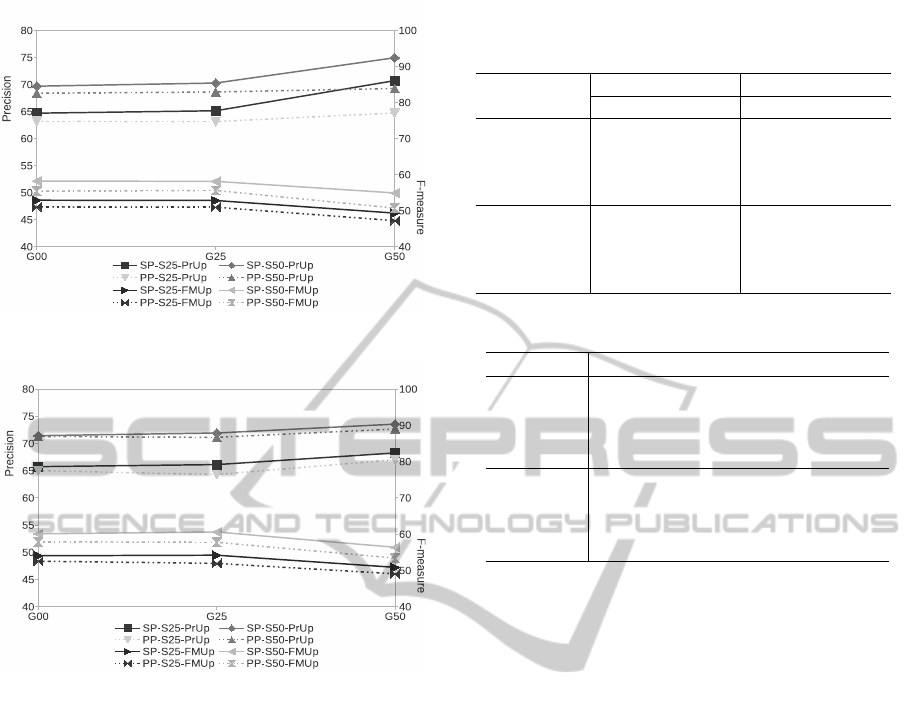
Figure 3: Precision and F-measure values achieved for
P200.
Figure 4: Precision and F-measure values achieved for
P500.
too big and, as a consequence, it does not seem that
the analysis of bigger K valueswill benefit the system.
Moreover, we can conclude that the use of a cer-
tain generalization degree in the clustering stage im-
proves the quality of the results. In addition, the
generalization procedure seems more important when
smaller the amount of generated clusters is. As a sum-
mary we could state that, when 1-NN strategy is used
in exploitation, and independently of the part of the
sequence seen for prediction (S25 or S50), the best
parameter combination is SP-P500-G25.
Next step is to analyze the effect of changing the
exploitation approach; the effect of using two pro-
files (2-NN) instead of one (1-NN). Table 1 shows
the comparison for precision and F-measure values
obtained with 1-NN and 2-NN for the configurations
showing the best performance in previous figures: SP
for profiling and P500 options.
The results show that combining two profiles to
propose links to the new user clearly benefits the per-
formance of the system. Both parameters, precision
and F-measure increase around 10 points. Another
observable effect is that, also in this case the improve-
Table 1: Results of 1-NN and 2-NN exploitation approaches
(SP-P500).
Upper bound Real
Option G00 G25 G50 G00 G25 G50
1NN-S25-Pr 65.76 66.13 68.27 41.66 42.17 45.45
1NN-S25-FM 54.08 54.23 50.88 31.63 31.89 30.71
1NN-S50-Pr
71.45 71.93 73.57 34.84 35.96 39.27
1NN-S50-FM 60.12 60.63 56.40 28.42 29.39 28.95
2NN-S25-Pr 50.97 78.43 73.49 51.03 53.49 50.23
2NN-S25-FM 48.32 65.21 55.29 35.96 37.31 32.95
2NN-S50-Pr
81.27 81.53 79.58 44.80 45.48 45.13
2NN-S50-FM 69.28 69.60 61.54 33.75 34.28 31.43
Table 2: Results of generalized profiles.
Option PP-G25 PP-G50 SP-G25 SP-G50
S25-PrUp 58.95 93.08 66.80 95.17
S25-FMUp 51.15 83.33 55.09 85.89
S50-PrUp 65.76 95.39 72.55 97.01
S50-FMUp 57.24 87.30 61.47 89.67
S25-Pr 41.39 89.13 43.36 92.20
S25-FM 31.27 76.63 33.00 79.32
S50-Pr 35.76 88.83 36.76 92.43
S50-FM 28.38 77.87 30.11 80.88
ment is greater when mid-range values for general-
ization are used (G25). Concretely the best precision
values (PrUp=81.53 and Pr=53.49)are obtained when
the 2NN-G25 is applied.
Finally, as we commented previously, we present
results achieved using generalization in the profile
generation stage. Since the data used to generate
the profiles will vary (we will be using generalized
URLs), in this case we present results for the two pro-
filing options PP and SP. Table 2 shows the precision
and F-measure values obtained for P500 and perform-
ing the test at two different stages of the navigation:
S25 and S50. The numbers in the table show again
that SP profiling option performs better than PP, so
the use of the frequent pattern mining algorithm is
again worth it. Moreover, greater generalization rates
also seem to improve results when generating those
profiles, achieving precision values up to 97.01 in the
upper bound and up to 92.43 in the real case. This
is an important outcome since it means that the pro-
posed generalized links (web site zones) are located
in interesting zones for the users in more than 90% of
the times.
Although it is not the final aim of this paper, if we
center the analysis in the 0-day problem, we realize
that the values are still acceptable in very early stages
of the navigation. When just 10% (one click in aver-
age) of the user navigation sequence is known, good
precision values (Pr = 56.41 and PrUp = 69.94) are
obtained.
AdaptationoftheUserNavigationSchemeusingClusteringandFrequentPatternMiningTechiquesforProfiling
191

4 CONCLUSIONS
We designed a generic system using machine learn-
ing techniques, that based only on web server log in-
formation, is able to propose web navigation scheme
adaptations to make easier and more efficient the nav-
igation of new users. Since at this point we haven’t
used any domain specific information, this system
would be useful for any web site collecting server log
information.
Results showed that the proposed generalization is
appropriate for the clustering stage, the specificity of
the generated profiles favors the results, it is worth us-
ing SPADE for building user profiles and, finally, the
use of diversity to select links to propose to new users
improves the obtained results. Concretely the best re-
sults for the complete system are achieved for K =
500 in the clustering algorithm, SPADE for building
the profile of each group of users, α = 0.25 for gen-
eralization and 2-NN option in the exploitation phase.
The obtained precision values are 81.53 in the upper
bound and 53.49 in the real case. Moreover, the val-
idation results showed that even when the prediction
is made at very early stages in the navigation, 10%,
the system performs satisfactorily. Furthermore, the
results using generalization in the profile generation
stage showed that the proposed links are situated in
interesting zones for the users in more than 90% of
the times. Since we achieved precision values up to
97.01 in the upper bound and up to 92.43 in the real
case.
This work addresses many future tasks such as ap-
plying it to morerecent data, improvingthe evaluation
and including web structure and content information
of the selected web page for improving the results of
the system.
ACKNOWLEDGEMENTS
This work was funded by the University of the Basque
Country, general funding for research groups, AL-
DAPA (GIU10/02); by the Science and Education
Department of the Spanish Government, ModelAc-
cess (TIN2010-15549 project); by the Diputaci´on
Foral de Gipuzkoa, Zer4You (DG10/5); and by the
Basque Government’s SAIOTEK program, Datacc
(S-PE11UN097).
REFERENCES
Arlitt, M. and Williamson, C. (1995). Http requests to the
nasa kennedy space center www server. NASA-HTTP
logs.
Brusilovsky, P., Kobsa, A., and Nejdl, W., editors (2007).
The Adaptive Web: Methods and Strategies of Web
Personalization, volume 4321 of Lecture Notes in
Computer Science. Springer, Berlin.
Chordia, B. S. and Adhiya, K. P. (2011). Grouping web
access sequences using sequence alignment method.
Indian Journal of Computer Science and Engineering
(IJCSE), 2(3):308–314.
Cooley, R., Mobasher, B., and Srivastava, J. (1999). Data
preparation for mining world wide web browsing pat-
terns. Knowledge and Information System, 1:5–32.
Danzig, P., Mogul, J., Paxson, V., and Schwartz, M. (2008).
The internet traffic archive.
Dasarathy, S. (1991). Nearest neighbor norms: NN pat-
tern classification techniques. IEEE Computer Soci-
ety Press.
Garc´ıa, E., Romero, C., Ventura, S., and Castro, C. D.
(2009). An architecture for making recommendations
to courseware authors using association rule mining
and collaborative filtering. User Modeling and User-
Adapted Interaction, 19(1-2):99–132.
Gusfield, D. (1997). Algorithms on strings, trees, and se-
quences: computer science and computational biol-
ogy. Cambridge University Press, New York.
Kaufman, L. and Rousseeuw, P. (1990). Finding Groups
in Data An Introduction to Cluster Analysis. Wiley
Interscience, New York.
Liu, B. (2007). Web Data Mining: Exploring Hyperlinks,
Contents, and Usage Data. Data-Centric Systems and
Applications. Springer.
Mobasher, B. (2007). Web Data Mining: Exploring Hyper-
links, Contents, and Usage Data, chapter Web Usage
Mining.
Pierrakos, D., Paliouras, G., Papatheodorou, C., and Spy-
ropoulos, C. D. (2003). Web usage mining as a tool for
personalization: A survey. User Modeling and User-
Adapted Interaction, 13(4):311–372.
Schiaffino, S. N. and Amandi, A. (2009). Intelligent user
profiling. 5640:193–216.
Srivastava, T., Desikan, P., and Kumar, V. (2005). Web min-
ing – concepts, applications and research directions.
pages 275–307.
W3C (1995). The world wide web consortium: The com-
mon log format.
Wilson, J. (2010). Website of national aeronautics and space
administration.
Zaki, J. M. (2001). Spade: An efficient algorithm for min-
ing frequent sequences. Mach. Learn., 42(1-2):31–60.
KDIR2012-InternationalConferenceonKnowledgeDiscoveryandInformationRetrieval
192
