
An Improvement Method of User Operations using Decision Tree
on Project Manager Skill-up Simulator
Minami Otsuki
1
, Masanori Akiyoshi
2
and Masaki Samejima
1
1
Graduate School of Information Science and Technology, Osaka University, 2-1 Yamadaoka, Suita, Osaka, Japan
2
Department of Information Systems and Management, Hiroshima Institute of Technology,
2-1-1 Miyake, Saeki-ku, Hiroshima, Japan
Keywords:
Project Management, Skill-up Simulator, Decision Tree.
Abstract:
Project managers of software development need to perform various operations such as overtime directive
or supervising action. We have developed a simulator for improving such skills, but the simulator has not
provided a feedback mechanism of evaluation of the operations to project managers yet. In order to evaluate
user operations, our proposed method generates various operations by agent programs and builds a decision
tree to judge where the user operations are classified from evaluation viewpoints. Based on the derived decision
tree, the point of improvement on user operations is induced. Our experimental result shows the proposed
method is effective.
1 INTRODUCTION
It is getting difficult to carry out projects successfully
due to complexity and diversity of system develop-
ment projects (Thomas and Mengel, 2008). Expert
project managers (PM) who manage projects success-
fully are strongly required. Novice PM learn knowl-
edge to manage projects, and have experience of
project management with the knowledge. In order to
have experience, many educational methods such as
On-the-Job Training (OJT), Project Based Learning
(PBL) (Thomas, 2000) and Role Playing (RP) (Henry
and LaFrance, 2006) have been proposed. However,
these methods have many problems: each training
takes long time and costs along with causing some
problems on the real project.
We have proposed the PM skill-up simulator that
can simulate project management in order that the
PM trainees have experiences without facing real
projects and taking long time (Iwai et al., 2011).
Trainees as users of the simulator can experience var-
ious projects, and there are no risks to take long time
and cost caused by practical projects failure. Espe-
cially in software implementation management phase,
our simulator provides an interactive learning envi-
ronment for a trainee. A trainer can set a project’s
attributes to be learned by the trainee in the imple-
mentation phase: modules to be developed, necessary
skills, and so on. Furthermore, the trainer sets events
such as occurring bugs depending on situations. By
checking delay caused by bugs, a user performs oper-
ations such as overtime directive or supervising action
to catch up the delay. At the end of the simulation of
the project, a user can grasp QCD (Quality, Cost and
Delivery) as project result. The user needs to perform
operations considering trade-off among QCD (Babu
and Suresh, 1996). However, the simulator does not
show which user operations are appropriate or not
from QCD viewpoints. So, users cannot improve their
operations by just checking QCD.
In this paper, we propose an improvement method
of user operations using “decision tree”. The pro-
posed method generates the decision tree as to vari-
ous kinds of operations. The user operations are eval-
uated by compared to each operation in the decision
tree, and the improved operations through the project
are generated.
2 PROJECT MANAGER
SKILL-UP SIMULATOR
Figure 1 shows the outline of the PM skill-up sim-
ulator. This simulator provides a set of functions to
experience software implementation process manage-
ment. At the beginning of the simulation, a project
model consisting of data of modules and members is
158
Otsuki M., Akiyoshi M. and Samejima M..
An Improvement Method of User Operations using Decision Tree on Project Manager Skill-up Simulator.
DOI: 10.5220/0004131901580163
In Proceedings of the International Conference on Knowledge Management and Information Sharing (KMIS-2012), pages 158-163
ISBN: 978-989-8565-31-0
Copyright
c
2012 SCITEPRESS (Science and Technology Publications, Lda.)
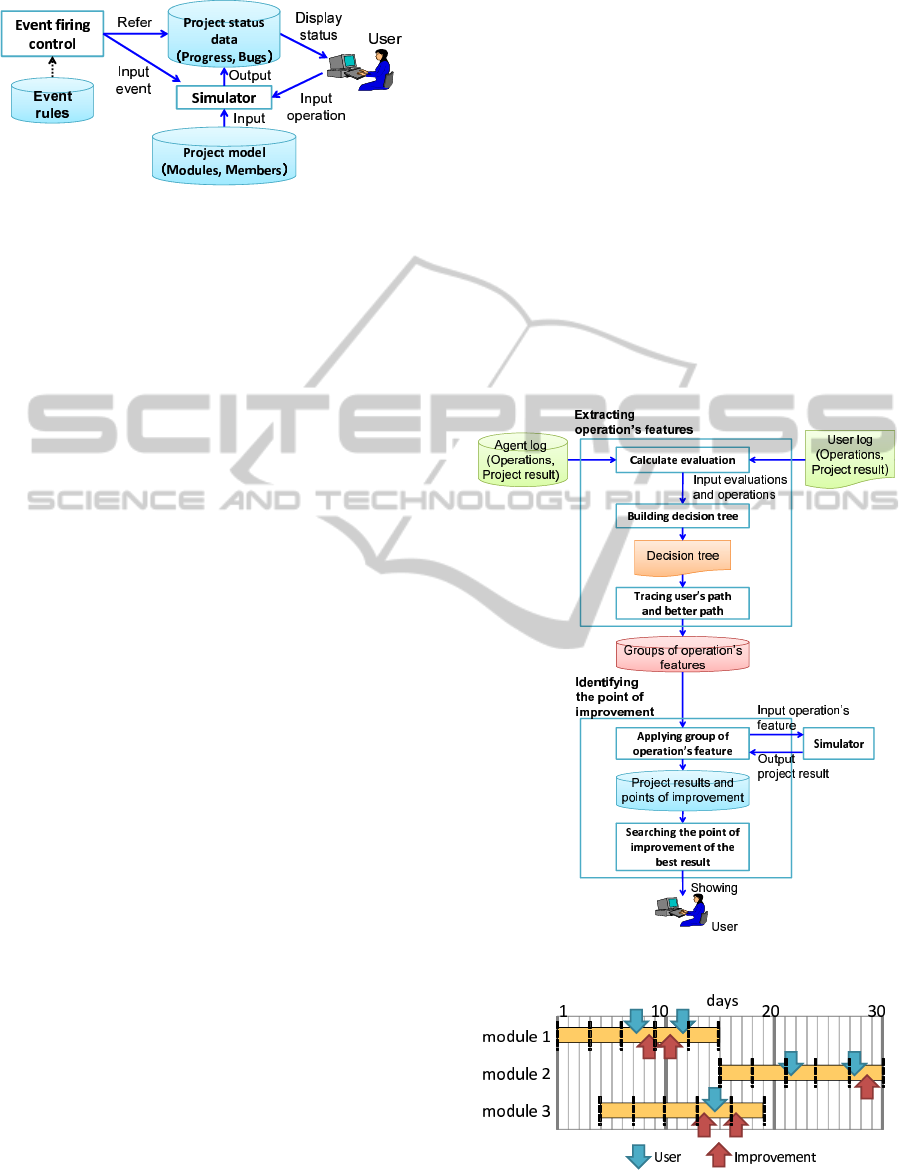
Figure 1: Outline of the PM skill-up simulator.
shown to a user. The simulator calculates progress
and bugs per day as project status. Based on a set
of event rules, events fire depending on project sta-
tus. Events mean disturbance for the project status,
e.g. occurring bugs or decreasing workload. A user
performs operations such as overtime directive or su-
pervising action. Overtime directive increases cost in
proportion to overtime hours, and supervising action
also increases cost in proportion to indicated period.
These costs are called “additional cost”. After the
project finishes, QCD as a project result is shown to a
user.
Although a user tries to obtain a good result for
a project by performing various operations during the
project simulation, the user may face undesirable re-
sults. When the user’s project result is not good, there
must be some operations that are inadequate for the
situation at a certain time.
However, this simulator is insufficient as a learn-
ing environment because a user cannot knowthe point
of improvement concerning the user operations. If
this simulator cannot give feedback, it is difficult for
the user to develop an ability to judge precisely which
operation the user should perform.
The proposed method gives a user the point of im-
provement based on the user operations as feedback.
In this paper, improvement means making a project
result better.
3 IMPROVEMENT METHOD OF
USER OPERATIONS
3.1 Outline of Improvement Method
Figure 2 shows the process flow of the proposed
method. When the simulation is finished, the simu-
lator reproduces the situation based on events and op-
erations recorded in the log. Our proposed method
evaluates the user operations by comparing to many
possible operations in the same project with the same
events. In order to generate the possible operations
automatically, we introduce agent programs that exe-
cute various operations in the project and get the re-
sults of QCD. The agent log consists of pairs of oper-
ations and the result.
Basically, as shown in Figure 3, there are many
differences between a user’s operations and better op-
erations by the agent program. Too many differences
make it difficult to identify the point of improvement.
We introduce a new index to indicate how many times
the user input each operation for each module in a cer-
tain period, which could be important to improve the
operations. So, we define “operation feature” as the
frequency of operations for each module in the period
as a part of all the period for the module, shown in as
areas between dashed lines in Figure 3. The proposed
method identifies the point of improvement using the
operation’s feature.
Figure 2: Process flow of improvement method.
Figure 3: Point of operations.
In identified points of improvement, if better re-
AnImprovementMethodofUserOperationsusingDecisionTreeonProjectManagerSkill-upSimulator
159

sults are obtained by changing operation features of
a user, improved operations are made based on better
operation’s features. Project results are also acquired
by applying the improved operations to the simulator.
If changing a user’s operation features brings the best
result, the period of the first changed operation’s fea-
ture is regarded as the point of improvement.
3.2 Extracting Operation Features
influencing Project Result
In order to classify lots of data with analyzing the fea-
ture of the data, “decision tree” is widely used. So,
we also use the decision tree in order to extract op-
eration features to classify results. The results of the
simulation are continuous value. It is difficult to build
the decision tree due to the variance of the continuous
value. To solve this problem, we classify the results to
“classes” that are discrete values from 1 to 5 to indi-
cate the results. In this tree structure, leaf nodes rep-
resent class and branches represent features that lead
to the class. Operation’s features of the user and the
better result are extracted by the decision tree.
3.2.1 Evaluation of Project Result
Evaluation criteria are total detected bugs as Q (Qual-
ity) and project period as D (Delivery). There are two
types of bugs. Ones are detected in a review, the oth-
ers are retained bugs that cannot be detected. Sum of
detected bugs and retained bugs are total bugs. Be-
cause detected bugs have a positive correlation with
total bugs, this simulator also assumes the same cor-
relation. Q is regarded to be better if detected bugs are
less. We do not use C (Cost) as the criteria because
a decision tree is built using data satisfying a lower
user’s cost in order to make operations that improve
Q and D less than or equal to the user’s cost.
Among n results derived by agent programs, min-
imum values of total detected bugs and project period
are Q
min
and D
min
, respectively. Maximum values are
Q
max
and D
max
. If we get evaluation of a project result
P
i
(i = 0, . . . , n− 1), each formula (1), (2) normalizes
total detected bugs Q
i
and project period D
i
in P
i
from
0 to 1.
Q
′
i
=
Q
i
− Q
min
Q
max
− Q
min
(1)
D
′
i
=
D
i
− D
min
D
max
− D
min
(2)
The formula (3) normalizes evaluation
i
calculated by
the formula (4) and evaluation
′
i
is obtained, where
evaluation
max
is a maximum value of evaluation
i
and evaluation
min
is a minimum value of evaluation
i
.
The formula (5) calculates fivegrade
i
as five-grade
evaluation and 5 of fivegrade
i
shows best evaluation.
evaluation
′
i
=
evaluation
i
− evaluation
min
evaluation
max
− evaluation
min
(3)
evaluation
i
= Q
′
i
+ D
′
i
(4)
fivegrade
i
=
5 (0.0 ≤ evaluation
′
i
< 0.2)
4 (0.2 ≤ evaluation
′
i
< 0.4)
3 (0.4 ≤ evaluation
′
i
< 0.6)
2 (0.6 ≤ evaluation
′
i
< 0.8)
1 (0.8 ≤ evaluation
′
i
< 1.0)
(5)
3.2.2 Building Decision Tree
Various operations are performed on each module and
there are some operation features that determine the
result of project. For identifying an operation to be
improved, it is important to know operation features
that are key factors of a user’s project result and to ob-
tain better results than the user’s one. Hence, we build
a decision tree by operation features and five-grade
evaluation calculated on the basis of project results.
Five types of agent programs that perform various
operations are used because building the decision tree
needs lots of data as input:
• Normative Agent
Performing overtime directive at delay and su-
pervising actions when difficulty of a module is
higher than person skill
• Overtime Directive-conscious Agent
Performing many overtime directives
• Supervising Actions-conscious Agent
Performing many supervising actions
• Late Operation-biased Agent
Performing few operations at the beginning of
module
• Random Performing Agent
Performing random operations
In order to get various results by operations, the
proposed method assigns a different agent program to
each module or just one agent in a project.
Operation features are set as attributes of a deci-
sion tree, which mean the frequency of performing
operations such as “overtime directive”, “supervising
action” and “no operation” in one period when each
module’s period is divided into some days. “No op-
eration” means not to perform operations in spite of
the delayed progress and more bugs than expected. A
point of improvement when a user did not perform
any operations can be identified by the frequency of
KMIS2012-InternationalConferenceonKnowledgeManagementandInformationSharing
160
no operations and performing some operations as at-
tributes. Five-grade evaluations are set as the decision
tree’s classes. Input data for building the decision tree
has a condition that its total additional cost is less than
or equal to a user’s cost, i.e. improvement of cost is
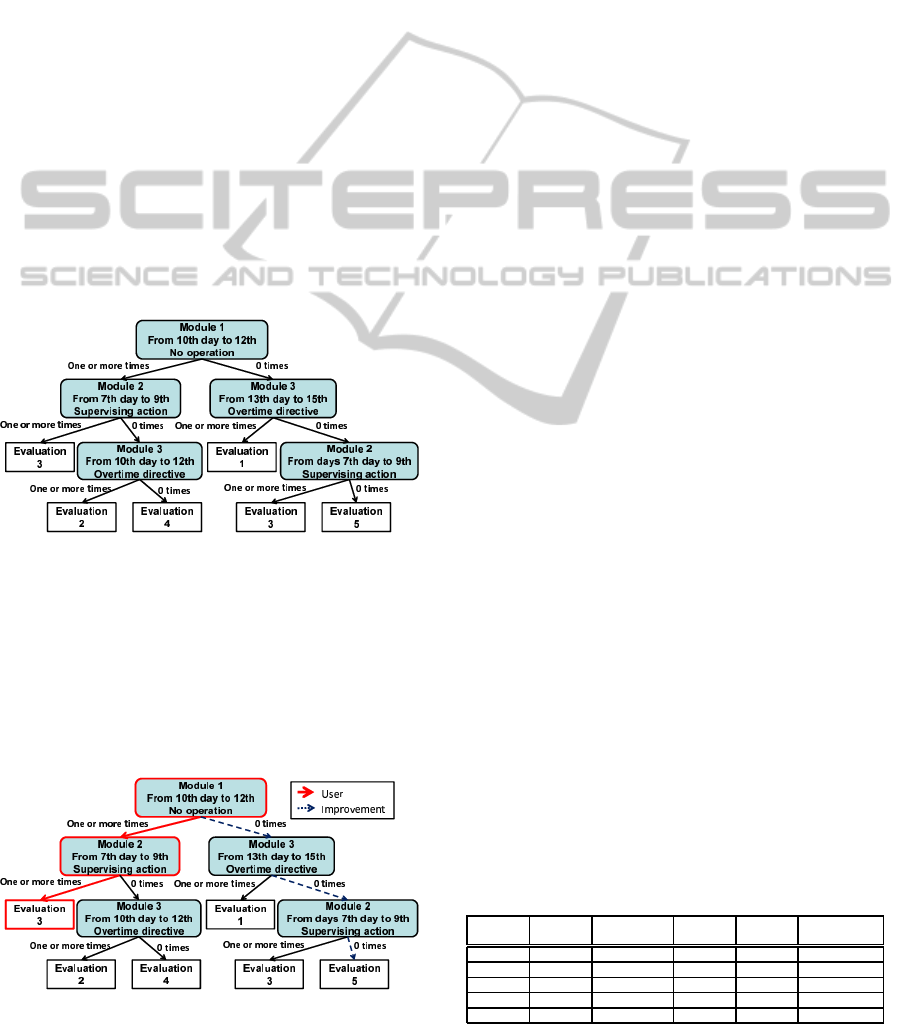
guaranteed. Figure 4 shows an example of a decision
tree, for instance, evaluation 4 has 3 operation fea-
tures: “Module 1, from 10th day to 12th, operation
was not performed”,“Module 2, from 7th day to 9th,
supervising actions was performed”, and “Module 3,
from 10th day to 12th, overtime directive was not per-
formed”.
3.2.3 Extracting Operation Features
Building a decision tree enables to associate project
results with operation features. First, a user’s evalua-
tion is shown in the leaf node that is decided by trac-
ing branches based on a user’s operations. Total op-
eration features that are traced in the above are called
a group of operation feature. There are as many op-
eration features of the user as the number of nodes
consisted of a path that leads to the leaf node.
Figure 4: Decision tree.
3.3 Identifying the Point of
Improvement
By selecting one feature in the group of operation
features and tracing different branches from a user’s
branch, we find paths that lead to better evaluation
Figure 5: Selecting a path.
than a user’s one. The above mentioned process is
repeated as to all operation features of a user, and the
point of improvement is identified in a group of opera-
tion features involved by improved operations leading
to the best result.
An example in Figure 5 shows selecting a path
for identifying the point of improvement. The root
node and its left child node are operation features of
a user. If we focus on the root node, branches in the
path described by the dashed line in Figure 5 show a
group of operation features. The group leads to better
project results than a user’s one, and improved oper-
ations are made on the basis of the path. Finally, if
the best project result is obtained by improved oper-
ations based on the path denoted by the dashed line,
“Module 1, from 10th day to 12th, operation was not
performed” is the point of improvement. The point
of improvement and examples of operations by im-
proved operations are shown to a user.
4 EVALUATION AND
DISCUSSION
4.1 Evaluation Experiment
We used a project model in Table 1 that there are de-
pendency relations among module 1, 2 and 3 and re-
lations between module 4 and 5. The path of module
1, 2 and 3 is a critical path. For the reason that low-
skilled project programmers were assigned to module
1, 3 and 4, this project was delayed. The decision
tree was build using J48 algorithm of WEKA as open-
sourced data mining tool (Witten and Frank, 2005).
Constructing decision tree needs a lot of training data
generated by agent programs. If the number of data
is too much, an amount of calculation in the subse-
quent processes will be increased. Using a minimum
number of data for decision tree is required while an
accuracy of decision tree is ensured. The accuracy
is evaluated by the accurate classification rate of the
decision tree for training data. Based on preliminary
experiments, we use 1000 training data.
We asked trainees to use the simulator and record
the log of the operations. Figure 6 shows a user’s op-
Table 1: Project model.
Difficulty
Development
period
Child
module
Parent
module
Programmer’s
skill level
Module 1 A 10 Module 2 B
Module 2 A 10 Module 1 Module 3 A
Module 3 A 10 Module 2 B
Module 4 A 10 Module 5 B
Module 5 B 10 Module 4 B
AnImprovementMethodofUserOperationsusingDecisionTreeonProjectManagerSkill-upSimulator
161
erations such as overtime directive or supervising ac-
tion.
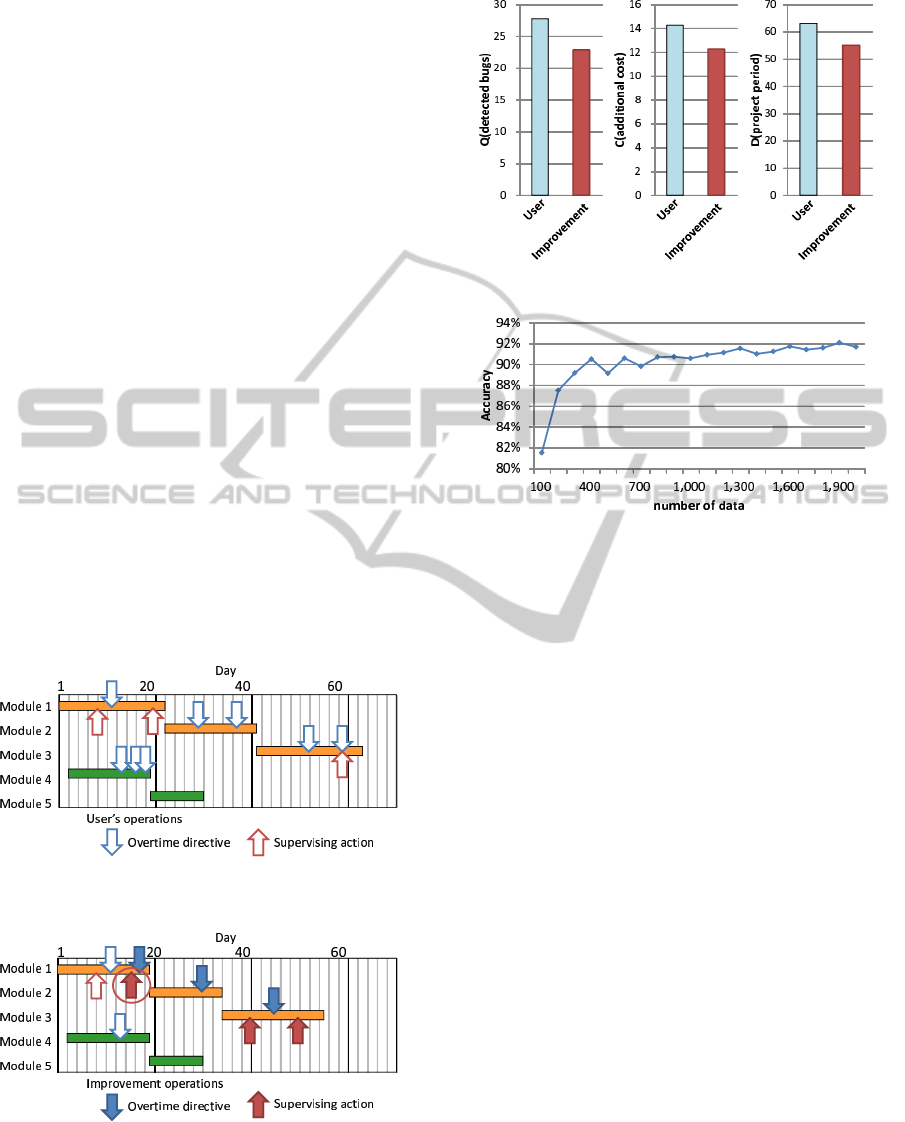
4.2 Experimental Result
Figure 7 shows the encircled point of improvement
identified by the proposed method. We can identify
the point that a user should have performed supervis-
ing action instead of performing no operations from
15th day to 18th in Module 1.
Figure 8 shows this user’s result and result by ap-
plying the improved operations. Improved operations
realized to improve Q by 17.6%, C by 14.0%, and D
by 12.7%, compared to the user’s operations.
In order to verify that the number of data for deci-
sion tree is necessary for accuracy, we measured ac-
curacy in changing the number of data, from 100 data
to 2000 data. Figure 9 indicates the accuracy of de-
cision tree. The accuracy continues to increase from
100 data to 400 and is more than 90% at 400 data. At
500 or 700 data, the accuracy is decreased. Data is
generated by agent programs that have a tendency of
operations and perform various operations in stochas-
tic manner according to the tendency. It sometimes
leads to low accuracy because of more biased opera-
tions than other data. The accuracy converges on an
average of 91% by over 1000 data. So, the number of
data is enough to ensure the accuracy.
Figure 6: User’s operations.
Figure 7: Point of improvement and improved operations.
Figure 8: Project result.
Figure 9: Accuracy of decision tree.
5 CONCLUSIONS
In this paper, we proposed an improvement method
of a user’s operations on PM skill-up simulator. In
order to identify the point of improvement in a user’s
operations, we need to take account of not only per-
formed operations but also points of unperformed
operations. Because there are many candidates of
points of improvement, identifying improvement by
hand is difficult. The proposed method identifies the
point by operation features of a user and features that
bring better results than the user’s result, and the pro-
posed method shows the point of improvement and
improved operations. From the experiment, we ver-
ified that the method can identify the point of im-
provement in which the user performed no operations
and improve the result by applying improved oper-
ations. Our future work is identifying the point of
improvement for the case of increasing kinds of oper-
ations such as changing project member assignment
and checking progress.
ACKNOWLEDGEMENTS
This work was partially supported by KAKENHI;
Grant-in-Aid for challenging Exploratory Research
(23650537).
KMIS2012-InternationalConferenceonKnowledgeManagementandInformationSharing
162

REFERENCES
Thomas, J. and Mengel, T. (2008). Preparing project
managers to deal with complexity – Advanced
project management education. International Journal
of Project Management, 26(3), 304-315.
Thomas, J.W. (2000). A Review of Research on Project-
Based Learning. San Rafael, CA: Autodesk Founda-
tion.
Henry, T.R. and LaFrance, J. (2006). Integrating role-play
into software engineering courses. J. of Computing
Sciences in Colleges, 22(2), 32–38.
Iwai, K., Akiyoshi, M., Samejima, M., and Morihisa, H.
(2011). A Situation-dependent Scenario Generation
Framework for Project Management Skill–up Simu-
lator. In Proceedings of the 6th International Confer-
ence on Software and Data Technologies, 408–412.
Babu, A. J. G. and Suresh, N. (1996). Project management
with time, cost, and quality considerations. European
Journal of Operational Research, 88(2), 320–327.
Witten, I.H., and Frank, E. (2005). Data Mining: Practi-
cal Machine Learning Tools and Techniques, Second
Edition, Morgan Kaufmann.
AnImprovementMethodofUserOperationsusingDecisionTreeonProjectManagerSkill-upSimulator
163
