
Modeling of Indicators using UTL
A Study Case with Hop3x System
Diem Pham Thi Ngoc, Sébastien Iksal and Christophe Choquet
LIUM – University of Maine, Rues Des Docteurs Calmette et Guérin, 53000 Laval, France
Keywords: Indicator, Track Analysis, Data Combination Language.
Abstract: In this paper, we present a novel approach for obtaining pedagogical indicators from tracks logged by
Technology Enhanced Learning (TEL) systems. These indicators can help teachers to improve their
pedagogical scenarios in order to making them relevant to students as well as to regulate learners’ activities.
The Usage Tracking Language (UTL) and its extension named the Data Combination Language for UTL
(DCL4UTL) were proposed to formally specify the calculation method of these indicators. A typical use of
UTL and DCL4UTL is also presented to illustrate the calculation of indicators, which are used to regulate a
learning session, from tracks generated by Hop3x system.
1 INTRODUCTION
The work presented in this paper is related to the
calculation modeling of pedagogical indicators from
raw data collected during a learning session. Our
research team has defined UTL (Choquet and Iksal,
2007) language that allows modeling indicators in
form of design patterns. Since these patterns were
designed for knowledge capitalization and sharing
and not for being computed, we have proposed the
UTL’s extension named the Data Combination
Language for UTL (DCL4UTL) (Pham-Thi et al.,
2009). This language is used to formally describe
indicators and to facilitate their automation. We
present a study case that illustrates the modeling and
the calculation of indicators from tracks generated
by Hop3x system using UTL. These indicators are
calculated and addressed to teachers in real time to
help them in the regulation learners’ activities during
the ongoing session.
The remainder of this paper is structured as
follows. The next section elaborates the UTL
language and its extension DCL4UTL. The third
section focused on the study case about UTL
language’s use. Finally, the last section concludes
this paper with an outlook on future works.
2 UTL
The Usage Tracking Language (UTL) is designed to
make easier the capitalization of data analysis
techniques and teachers' know-how in the analysis of
a learning session. It is a generic language to
describe tracks and their semantics, including the
definition of the observation needs and the means
required for data acquisition. Furthermore, it can be
used to structure tracks from raw data, which are
acquired from and provided by the learning system
during the learning session, to indicators, which are
significant for their users (teachers, tutors, learners,
curriculum managers, etc.). These data are
capitalized independently from any format of tracks
generated by learning systems.
2.1 Conceptual Model
UTL allows describing two high-level types of data:
the primary datum (PD) and the derived datum
(DD). The primary data are not calculated or
elaborated with the help of other data or knowledge.
They consist of raw-data (RD), content-data (CD)
and additional-data (AD). The derived data are
calculated or inferred from primary data and/or other
derived data. They consist of indicator and
intermediate-data (ID). Each UTL type of data is
defined according to three facets : the Defining (D)
facet defines the observation needs; the Getting (G)
facet describes the observation means to implement
for producing data and the Using (U) facet defines
the data's uses once they are calculated.
Models of different UTL data types have been
published in (Choquet and Iksal, 2007).
269
Pham Thi Ngoc D., Iksal S. and Choquet C..
Modeling of Indicators using UTL - A Study Case with Hop3x System.
DOI: 10.5220/0004132502690272
In Proceedings of the International Conference on Knowledge Management and Information Sharing (KMIS-2012), pages 269-272
ISBN: 978-989-8565-31-0
Copyright
c
2012 SCITEPRESS (Science and Technology Publications, Lda.)
2.2 DCL4UTL
Although UTL allows describing the necessary data
for formalizing the indicator (the Getting facet), its
description of the data acquisition method is
informal. Therefore it is difficult to generate the
automatic analysis tools to compute indicators. For
these reasons, we have proposed an extended part
for UTL called Data Combination Language for
UTL (DCL4UTL). The main aim of this add-on
language is to create a method allowing to combine
UTL data for producing a new one (indicator or
intermediate datum). It is a declarative language and
is able to be processed automatically by the
DCL4UTL interpreter (Pham-Thi et al., 2009).
Another research goal of this language concerns
the capitalization of these combination methods for
the re-usability of derived data. Two characteristics
of DCL4UTL facilitating the realization of this goal
are namely the possibility to integrate external
functions (Pham-Thi et al., 2010) and to create
parameterized intermediate data (Pham-Thi, 2011).
2.3 UTL Tool
This section presents tools allowing the modeling
and the calculation of indicators.
UTL Editor. To facilitate the definition and
modeling of indicators, we developed an UTL editor
based on Web. This editor helps analysts in their
tasks. It is used to describe any UTL data according
to three facets of the DGU model, especially the
calculation method of indicators using DCL4UTL. It
integrates a DCL4UTL parser verifying the
DCL4UTL syntax in the formalization and
expression of calculation methods of indicators. This
tool also allows creating a new UTL data and
modifying or deleting an existent UTL data.
UTL Indicators Calculation Tool. As we have
presented, UTL and its extension DCL4UTL are
used to describe indicators and their calculation
method in a form independent from any format of
tracks generated by learning systems and from the
architecture of databases. To validate our
propositions, we have developed a tool executing the
DCLUTL language, named UTL Indicators
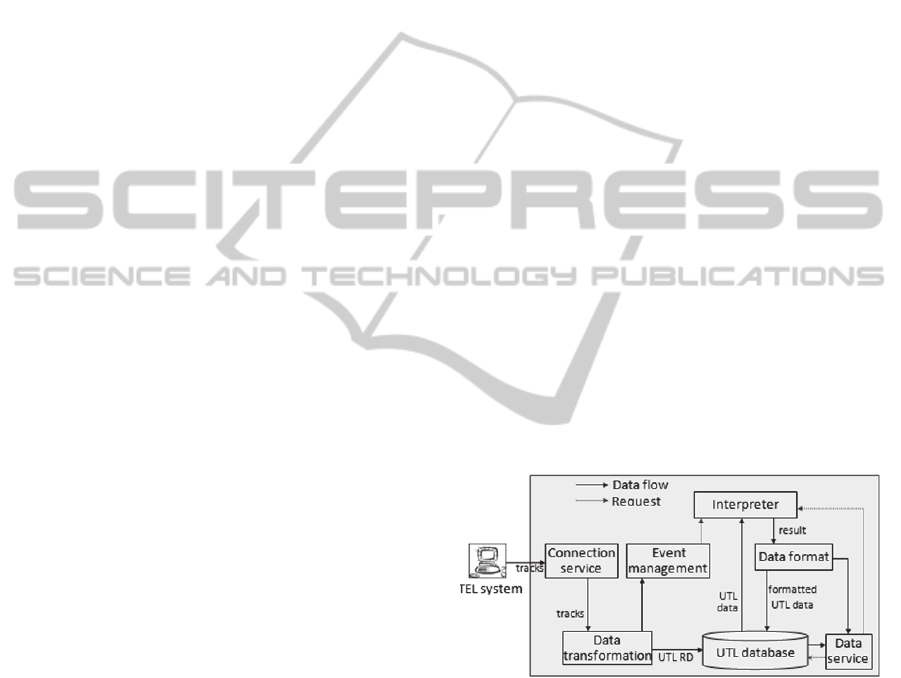
Calculation Tool (UICT). The Figure 1 presents the
proposed architecture of this tool. It is composed of
six components:
The Connection service component
communicates and connects to a TEL system to
receive tracks and provide them to Transformation
data component.
The Data transformation component transforms
all tracks collected by TEL systems into UTL
primary data (RD, CD or AD) stored into a database.
The DCL4UTL interpreter reads the DCL4UTL
source code and will execute the code if there is no
syntax error in the code. This interpreter is specially
designed to allow executing the pre-defined
functions and/or the external operators. It uses UTL
data in the database and combines them to produce a
new one formatted by the Data format component.
The Data format component whose the role is to
format the result according to the derived data
definition.
To calculate indicators in real-time, the tool
needs a component to automatically trigger the
calculation. The Event management component is
added for this purpose. It manages events that trigger
the calculation of indicators in real time. In our
context, this calculation can be started after a given
time interval, at the time of receiving a particular
data or a user's request. It connects to the Data
transformation component to verify if a special
event is generated in the track.
The Data service component provides necessary
functionalities that allow sending calculation
requests to the Interpreter and receiving the results
as well as adding new derived data modeled in the
database. It also includes services that allow
interrogating the UTL database.
Figure 1: UTL indicators calculation tool.
3 STUDY CASE WITH Hop3x
This section presents a case study using UTL to
model indicators from tracks generated by Hop3x
system. For this case, the Connection service
component was adapted for exchanging data with
Hop3x. The UICT receives tracks from Hop3x and
sends it back indicators. These indicators are
calculated in real time and used to help
teachers/tutors in their tutoring actions.
KMIS2012-InternationalConferenceonKnowledgeManagementandInformationSharing
270

3.1 Description of Hop3x
The Hop3x (Lekira et al., 2011) system is a platform
helping graduate students to learn and practice Java
object-oriented programming techniques at the
Computer Science faculty, University of Maine.
Hop3x consists of three parts. Hop3x-Student is
used by learners to create, modify, compile and
execute programs. Hop3x-Server logs all activities
of students during the session learning. These
activities are classified into types of event: text
insertion, text deletion, question selection, manual
compilation, program execution, etc. Hop3x-Teacher
is intervention tool for teachers. It allows them to
manage and regulate in real-time learners in distance
learning sessions.
3.2 Description of the Experiment
We have made several experiments with Hop3x to
verify our prototype. In these experiments, we
wanted to calculate a set of indicators concerning
learners’ activities in a practice learning session of
Java programming course. Learners were beginners
in Java object-oriented programming. One of these
experiments was carried out between May and June
2010 with six groups of first-year students, five
groups of 15 students and one group of 11 students.
Each session held in three hours. Learners had to
answer a set of 12 questions concerning to concepts
of the object-oriented programming such as
overriding, scope, data encapsulation using
accessors and mutators, etc. A set of indicators
related to these concepts were calculated and
addressed to tutors in real time to help them in the
regulation learners’ activities during the ongoing
session.
Two teachers worked remotely (in their office)
as tutors. They observed, regulated the activities of
learners and made interventions via Hop3x-Teacher.
3.3 UTL Data
Hop3x generates about 23 events. Every event
corresponds to a UTL raw data (RD). These RD
were modeled before the learning session (the Using
facet’s Data field of these data is empty). During
session, the Data transformation component
transformed all events collected by Hop3x into UTL
RD (the Using facet’s Data field is filled).
The content of Java files created by learners was
extracted by a component of the Hop3x-Server and
transformed into UTL primary data in form of
content data (CD).
All UTL data were modeled before the learning
session according to three facets of DGU model and
stored in the database. We modeled about 80
indicators. These indicators were defined by a
teacher in Computer Science faculty, University of
Maine. They were calculated from two types of UTL
primary data: raw data and content data.
The main objective of these indicators was to
verify if students respected instructions given in
questions and know how to create a class in Java.
Some of these indicators are: Detecting the existence
of a class is called “Point”, verifying if a student
often repeats the same errors or he/she assimilated
errors that he/she fixed before, etc.
In this experiment, the calculation of indicators
in real-time was started at the time of receiving a
particular event: question selection, manual
compilation or program execution. Each event
corresponds to some indicators. For example, if the
learner compiles his program, some indicators as
“the frequency of manually compilation”, “the rate
of errors correction at compilation process”, etc. are
calculated. Moreover, each question also
corresponds to some indicators. Every time the
student carries out one of three events, all indicators
concerning with this event and all indicators from
the first question to the current question are
calculated. So the more questions are carried out, the
more indicators are recalculated. The indicators are
recalculated because when the learner answers a
question, he can modify existent codes. He can then
make new mistakes. This recalculation aims to
verify whether new errors can be produced.
3.4 Results
From the experiment, we obtained in total 218773
instances of raw data (RD), 3943 instances of the
content-data (CD), 135581 instances of the
indicators calculated and stored into the database.
Indicators' instances were addressed to teachers and
displayed on the interface of Hop3x-Teacher. Based
on these results, tutors involved in the experiment
were able to evaluate the learners’ activities and
regulate them in order to improve the learning
session through interactions with students (for
example, 148 audio interventions and 154 textual
interventions were carried out).
3.5 Discussion
According to result above, on the average about 3.37
RD were produced (i.e. each student had achieved a
maximum of 3.37/11 ~ 0.3 event per second, one
ModelingofIndicatorsusingUTL-AStudyCasewithHop3xSystem
271

group with 11 students) and 2.09 indicators are
calculated per second. During the process of the
experimentation, the tool had responded well to the
calculation of indicators in real-time with a group of
15 students. In practice, there were moments where
there were no indicators calculated, but occasionally,
several indicators were calculated continuously. In
the case where several indicators are calculated
continuously, the maximum delay time between an
event generated and an indicator’s instance produced
corresponding to this event could be ten seconds.
This can be explained as follow. As we have
presented in the section 3.3, the calculation of
indicators is triggered when an event is generated
and the number of indicators to be calculated is
increased according to questions carried out by a
learner. Therefore, when this learner is in question
10, with each event generated, there are about 70
indicators to be recalculated and it then takes time if
many special events are generated continuously.
Moreover, to estimate the computational capacity
of the UICT, we performed a simulation on raw data
obtained in others experiments. This simulation was
done on the same system (software and hardware)
that the experimentation above was carried out. With
a simulation time of 4187 seconds, the UICT got
65819 RD and produced 48102 instances of
indicators. On the average, about 15.72 events were
generated and 11.49 indicators were calculated per
second. We can conclude that the UICT can meet up
with 52 students (15.72/0.3 = 52.4). However, this
capacity may be lower than this value. That depends
on several factors, for example, the computer
hardware, the learners’ knowledge, the number of
indicators to be calculated, etc. In addition, groups
with few students are recommended because a tutor
cannot observe many students at the same time.
We have proposed and used DCL4UTL because
it is independent from the architecture of databases,
from the format of any tracks and from
programming languages. It then allows reusability of
the calculation method of indicators. For example,
we now use JavaCC and eXist XML database to
implement the interpreter and DCL4UTL to describe
the acquired method of indicators. In the future, we
can modify the interpreter using other parser
generator and other database, but the indicators
modeled will be reused without modifying.
4 CONCLUSIONS
This paper introduces a case study illustrating an
UTL’s use in which UTL is used as a modeling
language to structure indicators and DCL4UTL is
employed to specify how to establish indicators from
UTL raw data and other data. Based on values of
these indicators, tutors could observe activities of
learners, therefore detect their problems and regulate
their activities.
As a perspective, we consider the indicator
visualization, for example in a graphical form.
Actually, each UTL indicator capitalizes the
teacher’s observation need and the acquired method
of data. In the context of tutoring actions, based on
the values of indicators, tutors can detect problems,
mistakes, misunderstanding, etc. of learners and
therefore make interventions to propose solutions.
We think that these (mistakes, solutions, etc.) are
important and necessary for tutors and learners.
However they are currently not capitalized in UTL.
We will then work on the capitalization and the
reuse of this knowledge. We will also improve our
prototype through more experiments in other
contexts.
REFERENCES
Choquet, C., Iksal, S., 2007. Modeling Tracks for the
Model Driven Reengineering of a TEL System. The
Journal of Interactive Learning Research (JILR), Vol.
18(2):161–184.
Lekira, A., Després, C., Jacoboni, P., 2011. Supporting the
Identification of Teachers' Intention through
Indicators. The 3rd International Conference on
Computer Supported Education (CSEDU'11),
Noordwijkerhout, Netherlands.
Pham-Thi, N.-D., Iksal, S., Choquet, C., Klinger, E., 2009.
UTL-CL: A declarative calculation language proposal
for a learning tracks analysis process. In The 9th IEEE
International Conference on Advanced Learning
Technologies (ICALT2009), Riga, Latvia.
Pham-Thi, N.-D., Iksal, S., Choquet, C., 2010. Re-
engineering of Pedagogical Scenarios Using the Data
Combination Language and Usage Tracking
Language. In The 10th IEEE International Conference
on Advanced Learning Technologies (ICALT2010),
Tunisia.
Pham-Thi, N.-D., 2011. Spécification et conception de
services d'analyse de l'utilisation d'un environnement
informatique pour l’apprentissage humain. Doctoral
thesis in Computer Science, University of Maine.
KMIS2012-InternationalConferenceonKnowledgeManagementandInformationSharing
272
