
Improving Supply-Chain-Management based on Semantically
Enriched Risk Descriptions
Sandro Emmenegger
1
, Emanuele Laurenzi
2
and Barbara Thönssen
1,2
1
Institute for Information Systems, University of Applied Sciences and Arts Northwestern Switzerland FHNW,
Riggenbachstr. 16, Olten, Switzerland
2
Dipartmento di Matematica e Informatica, University of Camerino, Via Madonna delle Carceri 9, Camerino (MC), Italy
Kewords: Supply-Chain-Management, Risk-Management, Enterprise Ontology, Semantic Technology.
Abstract: To discover risk as early as possible is a major demand of today’s supply-chain- risk-management. This
includes analysis of internal resources (e.g. ERP and CRM data) but also of external sources (e.g. entries in
the Commercial Register and newspaper reports). It is not so much the problem of getting the information as
to analyze and evaluate it near-term, cross-linked and forward-looking. In the APPRIS project an Early-
Warning-System (EWS) is developed applying semantic technologies, namely an enterprise ontology and an
inference engine, for the assessment of procurement risks. The approach allows for integrating data from
various information sources, of various information types (structured and unstructured), and information
quality (assured facts, news); automatic identification, validation and quantification of risks and aggregation
of assessment results on several granularity levels. For representation the graphical user interface of a
project partner’s commercial supply-management-system is used. Motivating scenario is derived from three
business project partners’ real requirements for an EWS with special reference to the downstream side of
supply chain models, to suppliers’ company structures and single sourcing.
1 INTRODUCTION
Globalization of the economy, on-going change of
the market situation and ever-increasing cost
pressure cause new business models to take up the
challenges. In the manufacturing industry
networked, virtual or extended enterprises have
emerged (Park and Favrel, 1999) allowing for global
sourcing without the necessity of owning all the
players of the supply chain (Chung et al., 2004).
However, transnational, inter-organizational
collaborations of enterprises are not limited to the
manufacturing sector but also of growing
importance of the tertiary and quaternary economic
sector, providing (shared) services to businesses and
consumers. Whereas that strategy brings down the
costs it increases the effort on managing business
relations, particularly with respects to the supply
chain.
In parallel dynamism of the economic
environment increases and therefore, the risk factors
that affect the performance of the supply chain, too.
Studies of Volatier et al. (2009) show, that the risk
portfolio can change significantly within a period of
three months (factor 8 more critical suppliers), and
thus greatly increase the vulnerability of the own
enterprise. The Global Risks Barometer presents an
overview of 37 risks analysed in 18 workshops by
more than 500 leading experts and decision-makers
(Emmerson, 2011). The survey not alone identified
risks and assessed the likelihood to occur in the next
10 years but also show how risks are interconnected.
To look not only at direct suppliers but on the whole
supply chain is a trend identified in the latest annual
survey by PRTM Management Consultants about
Global Supply Chain Trends 2010–2012 with 350
participating manufacturing and service companies
(Geissbauer and D’heur, 2011).
Risk management in such a complex and
dynamic environment requires a continuous tracking
of events, trends and risks, their analysis and
integration into the decision-making processes. Data
about exchange, enterprises, economy, environment
and politics, as well as country and sector analysis
are available on the Internet. However, the
exponential growth of information does not
necessarily lead to better knowledge. Without a
systematic methodology and efforts to remain
70
Emmenegger S., Laurenzini E. and Thönssen B..
Improving Supply-Chain-Management based on Semantically Enriched Risk Descriptions.
DOI: 10.5220/0004139800700080
In Proceedings of the International Conference on Knowledge Management and Information Sharing (KMIS-2012), pages 70-80
ISBN: 978-989-8565-31-0
Copyright
c
2012 SCITEPRESS (Science and Technology Publications, Lda.)
informed one drowns in the flood of information
which is also the problem of lack of selectivity
(Priddat, 2002). Albeit, today risk management in
procurement is barely supported with tools and
appropriate methods are missing. According to a
study of Wyman (2010) more than 70% of the
surveyed companies command “unstructured” (18%)
or “re-active” (55%) risk management in
procurement. A survey published in The McKinsey
Quarterly in 2006 revealed that nearly one-quarter of
the interviewees said that their company does no
formal risk assessment, and almost half lack
company-wide standards to help mitigate risk
(Pergler and Lamarre, 2009).
The APPRIS project seeks to remedy this. It
aims at integrating risk, procurement and knowledge
management into one early warning system. To do
so an enterprise ontology is used for knowledge
representation stored in a triple store, risk
assessment is implemented in Java and the graphical
user interface is realized within a project partner’s
commercial Supply-Management-System.
The paper is structured as follows: In chapter two
the APPRIS-approach is introduced. The approach
illustrates the project principles based on risks and
indicators, introduces an enterprise ontology for the
risk domain and provides an insight into
implementation details and technologies used. In
chapter three we highlight related research and we
close in chapter four with a conclusion and an
outlook.
2 THE APPRIS APPROACH
2.1 Principles
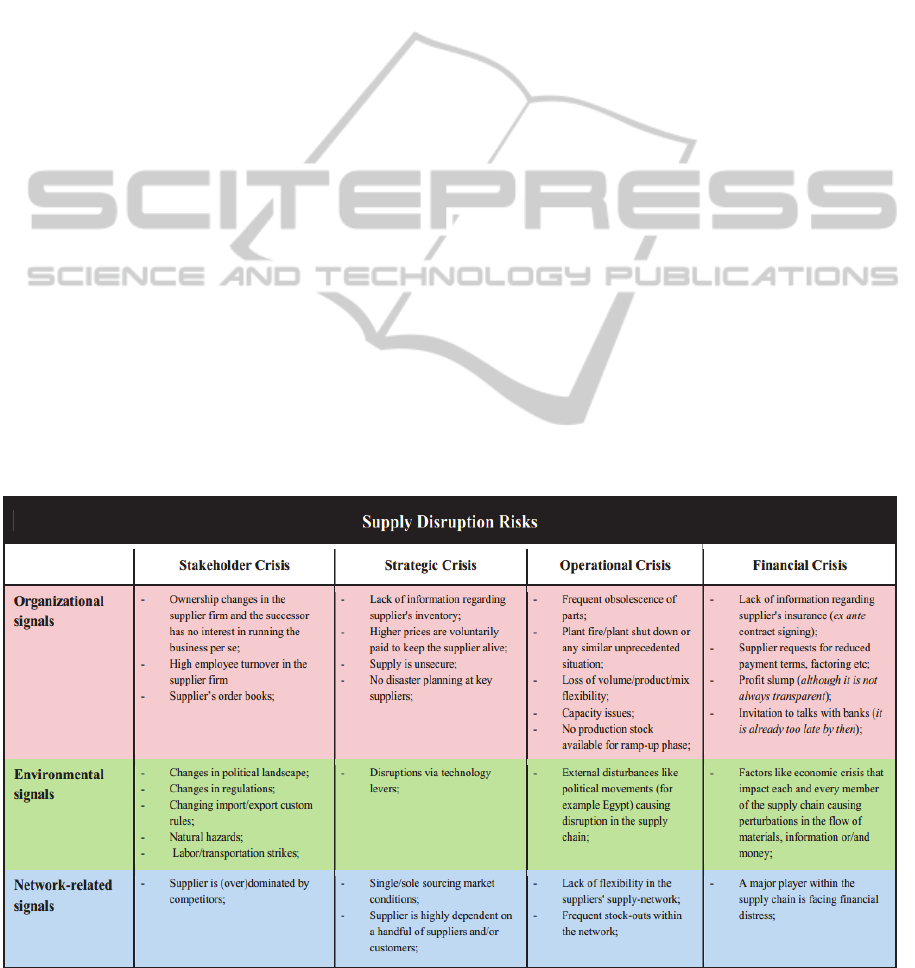
The APPRIS approach is based on a study by
Grosse-Ruyken and Wagner (2011) who identified
ten top procurement risks. Grosse-Ruyken and
Wagner (2011) developed a matrix for each of the
ten risks characterizing the sources of a risk
(organizational risk sources, environmental risk
sources and network-related risk sources) and four
crises (stakeholder crisis, strategy crisis, operational
crisis and financial crisis). Figure 1 depicts the
matrix for the Supply Disruption Risk. For each of
the top ten risks warning signals have been
identified and classified into the matrix. We took
these matrixes as starting point and determined risk
indicators for warning signals, which have been
considered most important by the project’s business
partners. For 10 out of a total of approximately 180
warning signals, risk indicators have been derived.
Risk indicators can be very different since one
can be a number (e.g. of force majeure events per
year), another one can be mode (e.g. the
transportation mode of a deliverer) and third one can
be a specific business event (e.g. the production
manager leaves the supplier). All indicators need
different scales of measure.
In order to have the best possible basis different
kind of information sources and types are
Figure 1: Supply Disruption Risks' Matrix (Grosse-Ruyken and Wagner, 2011).
ImprovingSupply-Chain-ManagementbasedonSemanticallyEnrichedRiskDescriptions
71
considered: data extracted from a company’s ERP
system, data delivered by a service provider like
Dun and Bradstreet (who is a project partner),
information allocated by a news provider like
LexisNexis (who is also a project partner),
information extracted from web-sites (e.g. company
sites or commercial registers) and user-generated
input, as some information isn’t available publicly.
Results of risk identification and assessment
must be displayed in an easy-to-understand way.
Therefore monitor suspension system is developed
enhancing the graphical user interface of a project
partner’s commercial Supply-Management-System.
2.2 Knowledge Representation
Using an ontology for enterprise modeling is a well-
known and accepted approach and several models
have been developed, for example the Toronto
Virtual Enterprise (TOVE) by Fox et al. (1996), the
Enterprise Ontology (EO) by Uschold et al. (1997),
the Core Enterprise Ontology (CEO) by Bertolazzi
et al. (2001), the Enterprise Ontology by Dietz
(2006) and more recently the ContextOntology by
Thönssen and Wolff (2010). Despite the consent
about using an ontology for describing enterprise
entities no standard or even an agreement has been
achieved yet on the appropriate representation
language for an enterprise ontology.
For the APPRIS approach we derived the
following requirements:
The enterprise ontology must
be formally represented in a language which is
understood by humans and machines alike,
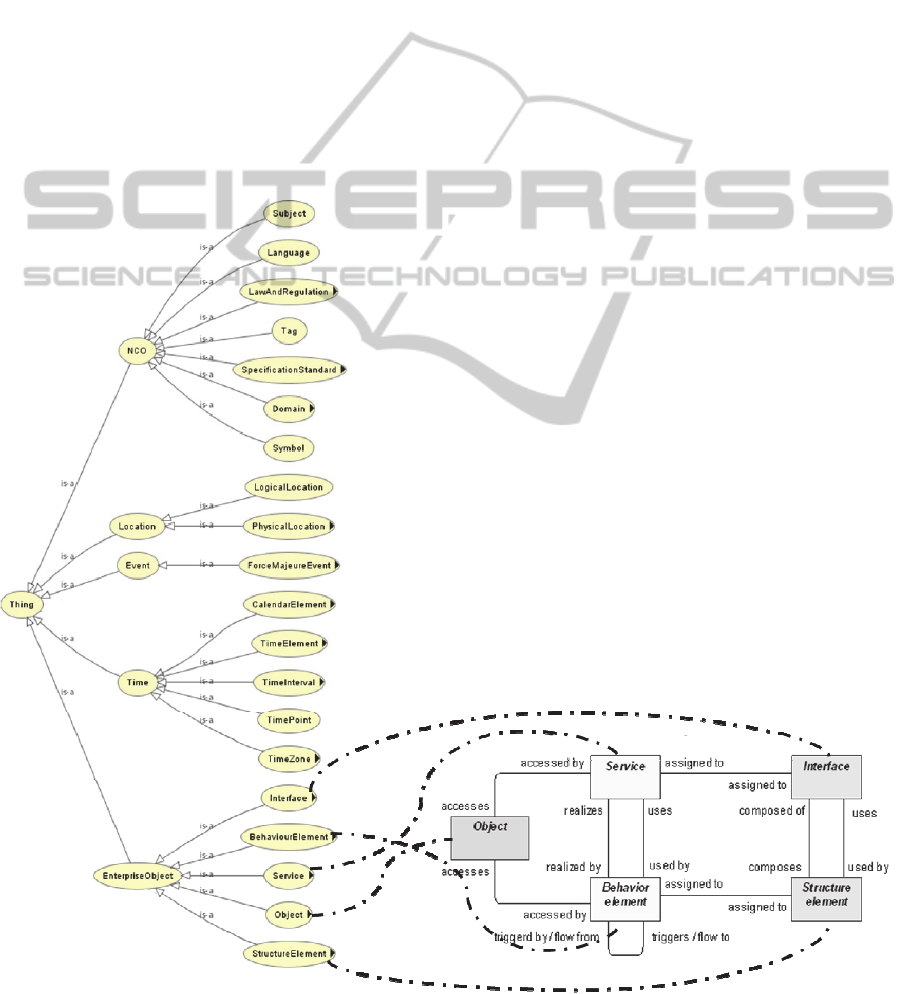
Figure 2: ArchiMEO concepts derived from the ArchiMate Standard (The Open Group, 2009).
KMIS2012-InternationalConferenceonKnowledgeManagementandInformationSharing
72

allow for operational use and thus must be
decidable,
be linked to external data sources to integrate
information of already existing applications
(e.g. ERP Systems, Supply-Chain-Management
Systems),
be based on standards to ensure
exchangeability and re-use,
be easy to use to allow enhancements and
adaptations by business users.
As none of the existing ontologies mentioned
above meets these requirements an ontology has
been developed based on the ArchiMate standard
and represented in RDFS. ArchiMate is a modeling
notation which intentionally resembles the UML
notation. It is intuitive and much lighter than
currently proposed by UML 2.0 (The Open Group,
2009). According to (Matthes, 2011), a Dutch co-
operation from government, industry and education
developed ArchiMate. Since 2008 ArchiMate has
been supported by the Open Group and V (1.0)
became a technical standard in 2009. Since
ArchiMate is not formalized enough to be machine
understandable its concepts and relations have been
transformed into an ontological representation. We
call the ontology ArchiMEO to indicate these roots.
Figure 2 depicts ArchiMEO’s top-level concepts
and its sub-concepts. As shown, the ArchiMate
concepts are all considered sub-concepts of the top-
level concept EnterpriseObject. As ArchiMate
focuses on the inter-domain relationships but risks
evolve from external events, addition top-level
concepts have been introduced, namely time, event,
location and NCO. NCO is top-level concept
introduced for ‘non-categorized objects’, i.e.
concepts of general interest. Moreover, concepts and
relations of the ArchiMate business layer have been
detailed as the granularity level of the standard was
not sufficient enough for risk modeling. Table 1
shows the enhancements which have been made to
ArchiMate for that reason.
Table 1: ArchiMate concepts and its ArchiMEO sub-
concepts.
ArchiMate ArchiMEO
BusinessObject To
p
10ProcurementRis
k
CrisisPhase
Warnin
g
Si
g
nal
R
iskIndicato
r
B
usinessEvent
R
iskEvent
BusinessActor Person
L
e
g
alEntiti
y
B
usinessCollaboration
B
usinessRelationshi
p
BusinessRole Su
pp
lie
r
Custome
r
Since demands on the expressive power are
rather low but decidability and performance is
important, the ontology RDFS is chosen as
representation language for ArchiMEO. ArchiMEO
is stored in a triple store. Since data extracted from
ERP systems is already stored in a relational
database, a direct mapping is chosen instead of
replication. Thus, a part of the A-Box is stored in the
RDBMS (Figure 3), namely instances of events. For
APPRIS we have chosen D2RQ (Cyganiak, 2012)
mainly because of its simplicity and support in an
active community.
Figure 3: Hybrid storage.
D2RQ provides a declarative mapping language
to describe the relation between the ontology and the
relational data model. The mapping file can be
generated out of the database schema. The instances
in the relational database are queried with SPARQL
(Prud’hommeaux and Seaborne, 2008) and will be
further processed for the risk assessment with Java.
For inferred knowledge resp. risks, rules are applied.
2.3 Implementation
The APPRIS approach is implemented as a
prototype of an Early Warning System (EWS). The
prototype might be evolutionary and further
integrated or transformed in a solution by one of the
technical partners of the project.
The EWS prototype is built as loosely coupled
extension to an existing Supply-Chain-Management-
System of a project partner. Hence the EWS can
draw upon complex visualisation components and
focus on functionality. Enterprise internal data, like
extracts of ERP (Enterprise-Resource-Planning)
systems, are stored in a relational database.
The prototype provides three functional modules
(Figure 4) with semantically enriched risk
management capabilities:
- Source processing engine,
- Risk assessment, and
- Risk Monitor.
ImprovingSupply-Chain-ManagementbasedonSemanticallyEnrichedRiskDescriptions
73
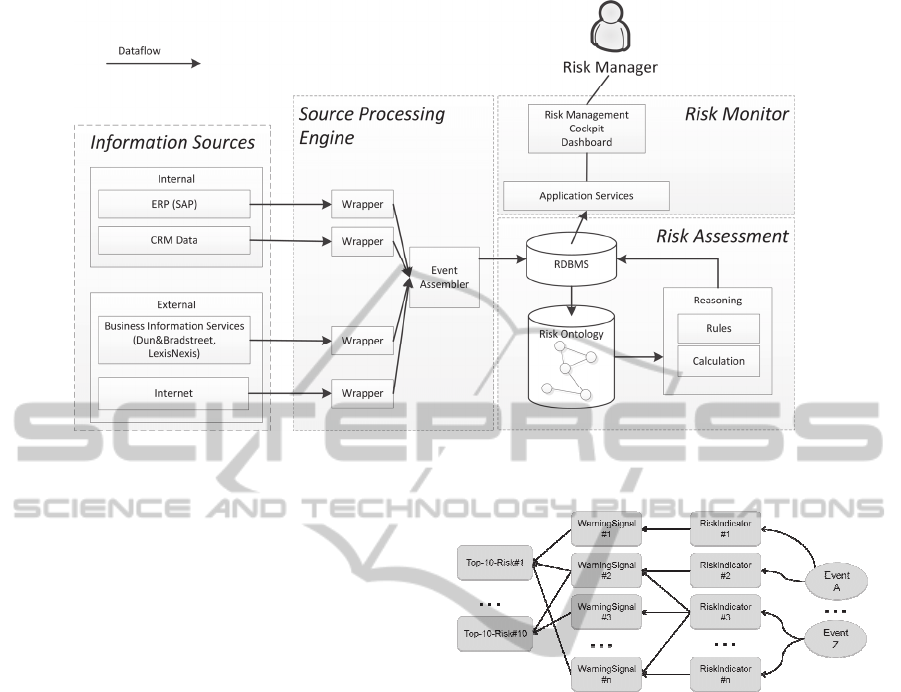
Figure 4: EWS system context diagram with functional modules.
2.3.1 Source Processing Engine
The source processing engine of the EWS monitors
internal and external information providers and
creates and assembles risk events, which are further
processed during the risk assessment.
Sources are integrated through web-services (e.g.
provided by LexisNexis, Dun&Bradstreet, Twitter),
via a batch import from an ERP (i.e. SAP) to the
relational database or via direct access of internet
resources based on HTTP.
The sources are either actively monitored or if a
notification service is available, the source
processing engine is triggered. In both cases queries
resp. filters are applied to retrieve only the
information of interest. Terms used in the filters and
queries are for example “Earthquake”,
“Bankruptcy”, “Location changes”, etc.
If notable information has been identified
relevant terms for the risk detection are extracted,
e.g. the name of a supplier, or the location of an
event. Based on this information a risk event for the
internal processing is created and stored in the
relational database. For example: A key supplier is
located in Japan and we receive the news about an
earthquake in Japan from Twitter. The source
processing engine extracts relevant information
about this disaster: Location, Magnitude, Time, etc.
and creates a specific risk event
(NaturalDisasterEvent), which will be further
processed in the risk assessment module.
Figure 5: Core risk concepts.
2.3.2 Risk Assessment
The risk assessment module can be seen as the core
part of the early warning system. This module is
based on the semantic model, the risk indication and
the risk evaluation components.
2.3.2.1 Semantic Risk Model
The semantic risk model is an extension of
ArchiMeo as described in chapter 2.2.
The integrated development environment used
for modelling the risk ontology is Protégé. The core
risk model is based on the concepts RiskEvent,
RiskIndicator, CrisisPhase, WarningSignal and
Top10ProcurementRisk. For simplification the
system is explained based on these concepts and
relationships shown in Figure 5.
Starting point is the risk event, depicted at the very
right hand side of Figure 5.
RiskEvent
A risk event in our context is either a business – or a
KMIS2012-InternationalConferenceonKnowledgeManagementandInformationSharing
74

force majeure event with a potential impact on the
company’s supply-chain risks. An example for a
business event is the information that a supplier has
financial problems and is close to go bankrupt. A
force majeure event might be a flood disaster. In our
context this can have an impact on suppliers located
in the area of this natural disaster.
A risk event has properties like temporal
information (creation time, effective date), the
source (information provider) and a reliability value.
The reliability value is determined by the reliability
of the different sources (ERP, newspapers, blog etc.)
and by time. For instance, master data provided by
the internal ERP-System has a higher reliability than
a newspaper message or even a post on a social
media platform.
The aspect of time is considered to differ
between news and facts. News are statements made
about the future, like the news that a company plans
to buy a competitor. Facts are statements provided
by official sources (company registries) or master
data systems like the internal ERP system. Since we
express this all in one reliability value, the handling
and the risk event evaluation in a risk indicator
becomes quite generic.
The reliability calculation is done with the
following formula:
Reliability
Facts
= Reliability
Source
* 1.0 (1)
Reliability
News
= Reliability
Source
* 0.7 (2)
For example: Consider an event in the future where
the information source is the newspaper X from
Table 2. Applying the formula (2) we can expect the
following result:
Reliability
News
= 0.7 * 0.7 = 0.49 (3)
Table 2: Examples for source reliabilities.
Source Reliability
ERP (ex. SAP) 1.0
Serious Newspaper X 0.7
Social Media (ex. Twitter) 0.4
Government service 1.0
The reliability values for the source can be
defined by the risk manager when setting up the
early warning system.
For each detected risk event the assigned risk
indicators are checked.
RiskIndicator
According to The Institute of Operational Risk
(2010) risk indicators are metrics used to monitor
identified risk exposures over time and these
indicators must be capable of being quantified as an
amount, percentage, ratio, number or count. In the
EWS we either count the number of events (e.g.
number of earthquakes in the last year in a certain
area) or we consider the latest event and its value
(e.g. the latest company rating delivered from Dun
& Bradstreet). In both cases, the result value is rated
based on pre-defined ranges. Table 3 gives an
example of a metric for a risk indicator, for example
to assess the number of NaturalDisasterEvent.
Table 3: RiskIndicator scores and ranges.
Score Ranges
>= <
1 0 2
2 3 3
3 4 5
4 6 -
Assume, in the last six month LexisNexis
reported four times about earthquakes in a certain
area. According to Table 3, the number of
earthquakes would be rated with score 3. The score
is a value of 1-4 (1=Low risk, 2=Medium risk,
3=High risk, 4=Extreme risk). Whereas the metric is
the same for all risk indicators boundaries differ
depending on the type of event. Scores and
boundaries of the RiskIndicators can be defined by
the risk manager, too.
Taking into account the reliability of the risk
event source, we applied the following formula:
weightedScore = score * reliability (4)
After the weighted scores are associated with the
risk indicators, a warning signal is substantiated if a
certain threshold is exceeded.
WarningSignals
Warning signals are pointers to risks. Depending on
the crisis phase they belong to, they lead to different
risk importance.
To take into account the different importance of
the crisis phases, from being only stakeholder-
related to being critical to the very survival of the
firm. (Grosse-Ruyken and Wagner, 2011), phases
are differently weighted (value 0.2 – 1). Table 4
shows the four different values the warning signals
can get.
Table 4: Crisis phase and their values.
Crisis Phase Value
Stakeholder Crisis Phase 0.2
Strategic Crisis Phase 0.5
Operational Crisis Phase 0.8
Financial Crisis Phase 1
ImprovingSupply-Chain-ManagementbasedonSemanticallyEnrichedRiskDescriptions
75

Each warning signal is assigned to one or more of
the top 10 risks according the matrix of (Grosse-
Ruyken and Wagner, 2011).
Top10Risk
(Grosse-Ruyken and Wagner, 2011) have
determined 10 procurement risks to be the most
relevant for
businesses today. These top 10 risks have been
implemented in the semantic model as instances of
Top10Risk:
- Supplier default risk
- Supply quality risk
- Contract management risk
- Pricing risk
- Logistics/transportation risk
- Supply disruption risk
- Supplier capacity risk
- Sourcing management risk
- Socio-political risk
- E-procurement technology, process, and
infrastructure risk
As more than one warning signal may trigger the
same risk, we would need a formula to somehow
aggregate the two warning signals’ values to get the
overall top ten risk value.
If we aggregated both values by means taking an
average, the final risk’s outcome would drastically
decrease its importance.
For instance let’s take “1” (warning signal
belonging to the financial crisis) and “0.2” (warning
signal belonging to the stakeholder crisis):
(1 + 0.2) / 2 = 0.6
(5)
In order to avoid this problem, a formula has
been proposed and validated by the APPRIS team as
well as their business partners. The following is the
formula:
(6)
Where “P” is the value of an early warning
signal, and “n” is the number of early warning
signals in a top ten procurement risk.
This formula is based on the independent events
in the theory of probability. It regards a rather
general and established concept which can be found
in many textbooks and paper such as the fourth
chapter of (Billinton and Allan, 1992). The formula
is appropriate for this case because it satisfies the
following conditions:
- The warning signals are independent, i.e. one
signal does not affect another one;
- The formula assigns an increasing value to
each potential warning signal based to the
crisis phase it belongs to, i.e. a warning signal
belonging to the Stakeholder Crisis phase
would get a value less than one belonging to
the Financial Crisis.
- Also the warning signals’ values that are not
triggered (with a value of “0”) can be
considered in the formula because they do not
decrease the final importance of the top ten
risks.
In the evaluation step, the formula is applied and
the respective result is then shown on the monitor
suspension system by means of a coloured flag.
2.3.2.2 Technical Implementation
To work smoothly with the risk ontology in Java, an
ontology to object mapping framework has been
evaluated. Here we had to choose between two
approaches the currently available frameworks or
the libraries support. So either we generate the
objects out of the semantic model or we use Java
Annotations. We decided to go with the annotation
approach, since this one integrates smooth in the
Java environment and provides more flexibility.
With Empire (Grove, 2012) we have even found a
JPA (Java Persistence API) implementation which
fits our requirements best. JPA is well known by
experienced Java programmers and it makes it easy
to work with the Ontology. The example shows the
class WarningSignal and it’s mapping annotations:
@Namespaces({"risk",
"http://ch.fhnw.risk#"})
@RdfsClass("risk:WarningSignal")
@Entity
public class WarningSignal{
@RdfProperty("risk:hasThreshold")
private float threshold;
@ManyToMany
@RdfProperty("risk:belongsToRisk")
Private List<Top10Risk> risks;
…
The risk calculation as described in 2.3.2.1 is
implemented in Java. More knowledge resp. risks
are inferred through SQWRL queries (O’Connor and
Das, 2011). SQWRL is an OWL query language. It
is based on the SWRL (Horrocks et al., 2004) rule
language and uses SWRL’s strong semantic
foundation. JESS (Friedman-Hill, 2008) is chosen to
execute queries written in SQWRL. This library fits
well in the Protégé development environment.
Protégé supports the creation of SQWRL queries
KMIS2012-InternationalConferenceonKnowledgeManagementandInformationSharing
76
through a plugin. SQWRL queries have still to be
defined by an expert. In the operational environment
we use the SESAME triple store.
The calculated risk value is stored in the
relational database. The customized supply-chain
management system frontend reads the risk value
and makes it available in different views and
aggregation levels to users like the management as
well as the procurement manager.
2.3.2.3 Use Case Example
To illustrate the overall approach of the risk
assessment in the following an example is given.
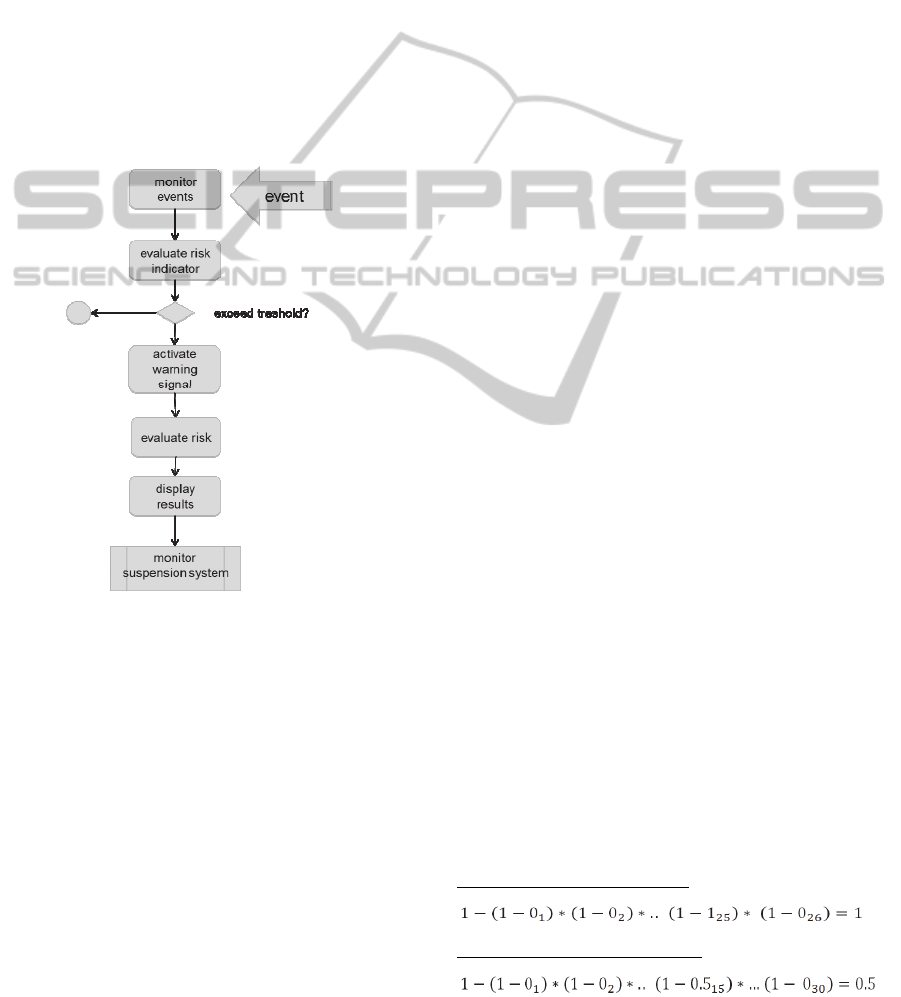
The general risk assessment procedure, depicted
in Figure 6, will underpin the use case example
along its description.
Figure 6: The risk assessment procedure.
An automaker that uses vacuum pumps for
generating negative pressure to the brake booster of
passenger cars and light trucks has two suppliers of
the pumps. Assume that one of the suppliers runs
out of business. The news of the supplier’s
bankruptcy is delivered by an information provider
electronically, and the relevant terms for risk
detection ‘SupplyAnyWhere’ (BusinessActor) and
‘Bankruptcy’ (BusinessEvent) are extracted.
After the event is detected (top of Figure 6), the
risk indicator ‘company went bankrupt’ is identified.
The risk indicator value, that comes out from the
step ‘evaluate risk indicator’ (Figure 6), exceeds the
respective threshold and thus, it triggers the warning
signal ‘A subsidiary/ sister company of the supplier
recently filed for bankruptcy or was recently
liquidated’. This warning signal belongs to the
‘Supplier Default Risk’. As this warning signal is
classified as ‘financial crises’ it is considered of high
importance (the warning signal gets the value ‘1’).
However, this is not the only risk the automaker
faces. Exploiting the backward-chaining strategy,
inter alia creating queries written in SQWRL, it
allows inferring further risk indicators’ values.
In our use case, as by now one supplier of the
vacuum pumps dropped out, the number of the left
suppliers should be checked. With the following
SQWRL query it is possible to determine the
number of the suppliers delivering vacuum pumps.
Product(?x)
∧
BusinessRelationship(?y)
∧
productIsInvolvedInBusinessRelationship(?x, ?y)
∧
LegalEntity(?z)
∧
legalEntityIsSupplierInBR(?z, ?y)
∧
OutOfBusiness(?a)
∧
legalEntityIsAssociatedWithBusinessEvent(?z, ?a) ˚
sqwrl:makeSet(?setOne, ?z) ˚
sqwrl:size(?nOne, ?setOne)
∧
LegalEntity(?b)
∧
legalEntityIsSupplierInBR(?b, ?y)
∧
sqwrl:makeSet(?setTwo, ?b)
∧
sqwrl:size(?nTwo, ?setTwo)
∧
swrlb:subtract(?c,
?nTwo, ?nOne) →
sqwrl:select(?c)
∧
sqwrl:select(?y)
Variable ‘x’ represents the product Vacuum
Pump, while variable ‘y’ represents the business
relationship in which the product as well as the
suppliers is involved.
The result of the query is then used in Java code
to give the appropriate value to the respective risk
indicator: ‘Single supplier for product’. Next, the
warning signal ‘Single/sole sourcing market Figure
6 ‘strategic crises’, and thus, the warning signal gets
the value ‘0.5’.
So far two different warning signals have been
activated which belong respectively to two top ten
risks: ‘Supplier Default Risk’ and ‘Supply
Disruption Risk’.
After that, the formula for evaluating each top
ten risk value (step ‘evaluate risk’ of Figure 6) is
applied.
In this case all the warning signals, except the
ones mentioned, have ‘0’ as they are not been
substantiated. Thus the results of the formula appear
as follows:
Supplier Default Risks Value
Supply Disruption Risks Value
ImprovingSupply-Chain-ManagementbasedonSemanticallyEnrichedRiskDescriptions
77

In the last step, the risk values are passed to the
risk monitor and the display now shows a red flag
associated to the Supplier Default Risks and a
yellow flag for the Supply Disruption Risks.
2.3.3 Risk Monitor
Detecting and assessing risks are one part of an early
warning system, the presentation of the results is
another. The calculated risk values shall be shown to
the users on an aggregation level appropriate to their
role. The management board is interested in overall
figures on the company level, whereas the individual
procurement manager is mostly interested to see the
risks of suppliers, resp. products he is responsible
for. Another view can be based on the location of
risk events and suppliers as shown in Figure 7.
Figure 7: Risk cockpit and dashboard.
In the APPRIS project we customize a solution
of one of the project partner. This system is
integrated through a relational database and allows
already viewing different aggregations levels. The
location of supplier and its risk value can be shown
on a map. The system provides also notification
service and allows sending emails triggered by risk
value changes. This alerting service might be a first
simple step towards an active monitoring system,
instead of a simple risk reporting dashboard. But
monitoring means more. Events and risks should be
integrated in the enterprise risk management
processes. An advanced system might run automated
workflow processes and support the management in
the active risk mitigation and handling.
3 RELATED RESEARCH
Tah and Carr (2001) figured out, that procurement
managing teams of an enterprise use different
terminology to describe risks, use different methods
and techniques for analyzing and managing risks and
thus produce different and contradicting results.
Furthermore, risk management is often is performed
on an ad hoc basis and is depending on individual
assessments of responsible staff members. To
address the afore mentioned issues, Tah and Carr
(2001) introduced a common language for
describing risks. Therefore they provide a
hierarchical risk breakdown structure for risk
classification quite similar to the approach chosen in
the APPRIS project by Grosse-Ruyken and Wagner
(2011). The class diagram for project risk
management suggested by Tah and Carr (2001)
provided valuable input for modelling ArchiMEO,
too. However, ArchiMEO goes beyond their
approach by formalizing the knowledge in a
machine understandable and executable way.
Xiwei et al. (2010) suggest the use of linguistic
techniques for risk evaluation. To cope with the
problem of fuzzy information about risks the authors
presented a method, based on linguistic decision
analysis to assess an overall risk value and suggest
ways of mitigating risks. Whether the approach of
Xiwei et al. (2010) could be re-used or adapted for
APPRIS will be further investigated in a later phase
of the project.
The use of ontology for modelling supply chain
(interoperability) has been investigated by Grubic
and Fan (2010). Based on literature review six
supply chain ontology models were identified.
Although the authors explain method and search
criteria, the selection seems somehow arbitrary.
Ontologies were evaluated that have not been
specifically designed for supply chain issues, for
example the Enterprise Ontology (Uschold et al.,
1997) and TOVE (Fox and Grüninger, 1998), but are
general approaches for representing enterprise
architecture (description). Other ontologies,
developed for a similar purpose but less well-known,
like REA (Geerts and McCarthy, 2000), CEO
(Bertolazzi et al., 2001), the Context-based Ontology
(Leppänen, 2005) or the Context Ontology
(Thönssen and Wolff, 2010) were not considered.
However, Grubic and Fan (2010) developed a
comparison framework to evaluate the six selected
ontologies and identified nine gaps in existing
supply chain ontology models. Five of them are
addressed by the ontology used for APPRIS
(Thönssen, 2012).
KMIS2012-InternationalConferenceonKnowledgeManagementandInformationSharing
78

However, for operational use – as APPRIS
strives for – knowledge representation is not enough
but an enterprise ontology must be enhanced to an
enterprise repository as suggested by Hinkelmann et
al. (2010), Thönssen (2011), (2010)). In our
approach we go in this direction by mapping entities
of the Supply Management System’s database to
ontological concepts.
Chi (2010) developed a rule-based ontological
knowledge base for monitoring partners across
supply network. Although Chi (2010) provides a
sound methodology for modelling the domain of the
supply network in an ontology, its content remains
application specific since no standard is considered.
Furthermore, as forward-chaining is the applied
technique for inferring new knowledge it can be
assumed that the knowledge base increases largely
over time and thus becomes unmanageable in the
end. But most important is that the approach is not
integrated in the daily operations but an isolated
task.
4 CONCLUSIONS / FURTHER
WORK
Detecting risks as early as possible is of vital interest
for all enterprises. At present risk management is
performed – if ever – on the basis of in-house
information, e.g. extracted from ERP systems like
delays in delivery. More and more information
would be available, either offered by information
providers like Dun & Bradstreet or LexisNexis or
publicly available on the web. Yet, risks are often
detected too late due to late publication, not
recognized importance or hidden impacts.
Our approach of an early warning system
addresses this problem by combining the analysis of
different information sources, types and formats in
order to early identify and assess risks in the supply-
chain. We showed how an enterprise ontology is
used to represent domain knowledge and how it is
integrated into the EWS by Direct Mapping to
entities of an RDBMS, and ontology to object
mapping based on Java annotations. The results of
our approach, i.e. of the risk evaluation, are
interpreted and displayed within a commercial
Supply-Management-System that has been enhanced
for this purpose. Our approach contributes
significantly to improving risk management in the
supply chain and thus is of considerable economic
importance.
The EWS will be formally evaluated by the
APPPRIS project’s business partners and the
technical partner will implement the prototype’s
functionality in his Supply-Management-System.
However, there are still several aspects not
considered yet, for example how the EWS could be
improved to identify not only risks but also
opportunities, how a replacement for a product
could be automated, or how supplier selection could
be supported, to name a few.
REFERENCES
Bertolazzi, P. et al., 2001. An Approach to the Definition
of a Core Enterprise Ontology : CEO. In International
Workshop on Open Enterprise Solutions: Systems,
Experiences, and Organizations - OES-SEO 2001.
Rome, pp. 104-115.
Chi, Y.-L., 2010. Rule-based ontological knowledge base
for monitoring partners across supply networks.
Expert Systems with Applications, 37(2), pp.1400-
1407. Available at: http://linkinghub.elsevier.com/
retrieve/pii/S0957417409006514 [Accessed March 6,
2012].
Chung, W. W. C., Yam, A. Y. K. & Chan, M. F. S., 2004.
Networked enterprise: A new business model for
global sourcing. International Journal of Production
Economics, 87(3), pp.267-280. Available at: http://
linkinghub.elsevier.com/retrieve/pii/S0925527303002
226 [Accessed July 12, 2011].
Cyganiak, R., 2012. The D2RQ Platform – Accessing
Relational Databases as Virtual RDF Graphs.
Available at: http://d2rq.org/.
Dietz, J. L. G., 2006. Enterprise Ontology. Theory and
Methodology, Berlin Heidelberg: Springer-Verlag.
Emmerson, C., 2011. Global Risks 2011 Sixth Edition,
Fox, M. S. & Grüninger, M., 1998. Enterprise Modeling.
AI Magazine, 19(3), pp.109-121.
Fox, M. S. et al., 1996. An Organization Ontology for
Enterprise Modelling. Simulating Organizations:
Computational Models of Institutions and Groups,
(AAAI/MIT Press), pp.131-152.
Friedman-Hill, E., 2008. Jess, the Rule Engine for the Java
Platform V7.1., pp.1-198. Available at: http://
www.jessrules.com/jess/index.shtml.
Geerts, G. L. & McCarthy, W. E., 2000. The Ontological
Foundation of REA Enterprise Information Systems,
Geissbauer, R. & D’heur, M., 2011. 2010-2012. Global
Supply Chain Trends,
Grosse-Ruyken, P. T. & Wagner, S. M., 2011. APPRIS
Project Report, Zürich.
Grubic, T. & Fan, I.-shing, 2010. Computers in Industry
Supply chain ontology : Review , analysis and
synthesis. Computers in Industry, 61(8), pp.776-786.
Available at: http://dx.doi.org/10.1016/
j.compind.2010.05.006.
Hinkelmann, K., Merelli, E. & Thönssen, B., 2010. The
Role of Content and Context in Enterprise
Repositories. In Proceedings of the 2nd International
ImprovingSupply-Chain-ManagementbasedonSemanticallyEnrichedRiskDescriptions
79

Workshop on Advanced Enterprise Architecture and
Repositories - AER 2010.
Horrocks, I. et al., 2004. SWRL : A Semantic Web Rule
Language Combining OWL and RuleML. Syntax,
(May), pp.1-31.
Leppänen, M., 2005. A Context-Based Enterprise
Ontology. In G. Guizzardi & G. Wagner, eds.
Proceedings of the EDOC International Workshop on
Vocabularies, Ontologies and Rules for the Enterprise
(VORTE’05). Enschede, Netherlands: Springer Berlin,
pp. 17-24.
O’Connor, M. & Das, A., 2011. SQWRL: a Query
Language for OWL.
Park, K. H. & Favrel, J., 1999. Virtual Enterprise -
Information System and Networking Solution.
Computers & Industrial Engineering, 37, pp.441-444.
Pergler, E. & Lamarre, M., 2009. Risk: Seeing around the
corners,
Priddat, B. P., 2002. E-Government als
Virtualisierungsstrategie des States. Demokratisierung
der Wissensgesellschaft und professioneller Staat.
TECHNIKFOLGENABSCHÄ TZUNG Theorie und
Praxis, 11(3/4).
Prud’hommeaux, E. & Seaborne, A., 2008. SPARQL
Query Language for RDF. Available at: http://
www.w3.org/TR/rdf-sparql-query/.
Tah, J. H .M. & Carr, V., 2001. Towards a framework for
project risk knowledge management in the
construction supply chain. Advances in Engineering
Software, 32(10-11), pp.835-846. Available at: http://
linkinghub.elsevier.com/retrieve/pii/S0965997801000
357.
The Institute of Operational Risk, 2010. Key Risk
Indicators,
The Open Group, 2009. ArchiMate 1.0 Specification,
Available at: http://www.ncbi.nlm.nih.gov/pubmed/
20087110.
Thönssen, B., 2010. An Enterprise Ontology Building the
Bases for Automatic Metadata Generation. In
Proceedings of the 4th International Conference on
Metadata and Semantics, MTSR1200. Madrid, pp.
195-210.
Thönssen, B., 2011. Forrmalizing low - level governance
instruments for a more holistic approach to automatic
metadata generation. In Proceedings of the 5th
International Conference on Methodologies,
Technologies and Tools enabling e-Government.
Camerino, Italy, pp. 1-12.
Thönssen, B., 2012. Turning Risks Into Opportunities.
Electronic Government, tbp. Available at: http://
www.inderscience.com/browse/index.php?journalID=
72.
Thönssen, B. & Wolff, D., 2010. A broader view on
Context Models to support Business Process Agility.
In S. Smolnik, F. Teuteberg, & O. Thomas, eds.
Semantic Technologies for Business and Information
Systems Engineering: Concepts and Applications.
Uschold, M. et al., 1997. The Enterprise Ontology,
Volatier, L., Cordon, C. & Gallery, C., 2009. Suppliers
and vendors first. International Association For
Contract & Commerical Management (IACCM).
Available at: https://www.iaccm.com.
Xiwei, W., Stöβlein, M. & Kan, W., 2010. Designing
knowledge chain networks in China — A proposal for
a risk management system using linguistic decision
making. Technological Forecasting and Social
Change, 77(6), pp.902-915. Available at: http://
linkinghub.elsevier.com/retrieve/pii/S0040162510000
03X [Accessed November 16, 2011].
KMIS2012-InternationalConferenceonKnowledgeManagementandInformationSharing
80
