
Data Mining Predictive Models for Pervasive Intelligent Decision
Support in Intensive Care Medicine
Filipe Portela, Filipe Pinto and Manuel Filipe Santos
Centro Algoritmi, Universidade do Minho, Braga, Portugal
Keywords: Data Mining, KDD, Real-time, Pervasive, Intelligent Decision Support System, Intensive Care.
Abstract: The introduction of an Intelligent Decision Support System (IDSS) in a critical area like the Intensive
Medicine is a complex and difficult process. In this area, their professionals don’t have much time to
document the cases, because the patient direct care is always first. With the objective to reduce significantly
the manual records and, enabling, at the same time, the possibility of developing an IDSS which can help in
the decision making process, all data acquisition process and knowledge discovery in database phases were
automated. From the data acquisition to the knowledge discovering, the entire process is autonomous and
executed in real-time. On-line induced data mining models were used to predict organ failure and outcome.
Preliminary results obtained with a limited population of patients showed that this approach can be applied
successfully.
1 INTRODUCTION
The most important feature for the success of an
Intelligent Decision Support System (IDSS) is its
capability to operate autonomously and in real-time,
providing the results in the right moment of the
decision maker need. IDSS operating in critical
environments must overcome the difficulty in
obtaining the data, processing and transforming
them automatically and in real-time.
INTCare is an IDSS for intensive medicine and
uses Data Mining (DM) models to predict organ
failure and outcome (Gago et al., 2006); (Vilas-Boas
et al., 2010).
In order to meet its goals, it has been necessary
to change the environment and the information
system, developing a real-time data acquisition and
processing system (Portela et al., 2012); (Filipe et
al., 2011); (Santos et al., 2009). This system can
automatically receive and process the patient data,
making it available to obtain further knowledge.
Then, it is important to explore the possibility to
obtain, clean, validate and transform the data
automatically, according to the variables in use by
data mining in an adaptive and real way. The
intensive care units are known as a place where the
patient direct care is in the first place delegating
tasks like the health recording to a secondary
importance (Lyerla et al., 2010). In the past, we have
obtained some good results by using offline data,
where it was correctly identified most of the
variables in use in this project. In an attempt to
transpose this idea to a real environment with real
data obtained in a continuous way, it was verified
that none of variables were regularly collected in an
electronic mode.
In a first step, it was implemented a solution to
obtain all the necessary data. Some changes were
performed and an Electronic Nursing Record (ENR)
has been developed to register and validate the
values. Then, it was necessary to develop a data
processing system. To automate the entire process,
in particular the processing and transformation
phases, it was necessary to deploy a set of agents
(Santos et al., 2011); (Wooldridge, 1999) which
perform some predefined tasks. These agents are
responsible to perform all the tasks which in the past
were done manually. For example, they are
responsible by data acquisition of vital signs, the
validation of the collected values, the data mining
preparation and the models induction. After all the
processes have been totally tested and prepared to be
executed automatically without manual efforts, some
data mining models were developed. The main
objective of these DM Models is the use of the
obtained results to understand the viability to
automate the data transformation process, assessing
81
Portela F., Pinto F. and Santos M..
Data Mining Predictive Models for Pervasive Intelligent Decision Support in Intensive Care Medicine.
DOI: 10.5220/0004141500810088
In Proceedings of the International Conference on Knowledge Management and Information Sharing (KMIS-2012), pages 81-88
ISBN: 978-989-8565-31-0
Copyright
c
2012 SCITEPRESS (Science and Technology Publications, Lda.)
the quality of the results. These results were
compared with the earlier obtained results. All the
tasks were carefully implemented and tested using
the real data related to the patients admitted in ICU
of Hospital Santo António, Centro Hospitalar do
Porto in Portugal. This paper will show the
procedures implemented for the data transformation
process, the first results obtained using DM
techniques and finally the analysis of these results.
The work is organized according to the
Knowledge Discovering Phases. After this
introduction, the second chapter gives an outline of
the paper and an overview of the data acquisition
system in use. The next four chapters explain the
overall KDD phase: at first, it is presented a
summary about the first two phases and then all
automation of the transformation process is exposed.
Fifth chapter introduces the data mining models and
the configurations used. The sixth and seventh
chapters are related to the evaluation of the results
obtained by DM and to the conclusions respectively.
In this last chapter, it is also presented the future
work.
2 BACKGROUND
2.1 Offline vs Online
The former results obtained using EURICUS
database (Silva et al., 2008) was the main motivation
to develop this work. In this work the variables used
were collected manually and in an offline mode:
“The data was monitored, collected and registered
manually, every hour, all ICU patient biometrics
were recorded in a standardized sheet form by the
nursing staff. The adverse events were also assigned
in a specific sheet at an hourly basis.”(Silva, et al.,
2008). The variables used were: Age, Critical
Events, Admission Variables, Outcome, and SOFA
(Vincent et al., 1998); (Vincent et al., 1996).
The objective is now to obtain all of those
variables automatically and to induce data mining
models using an online approach in order to predict
the organ failure and outcome in real time. The
greater challenge is the development of some
procedures which use all values obtained by the data
acquisition system instead of using hourly values.
This change allows for a continuous data
monitoring.
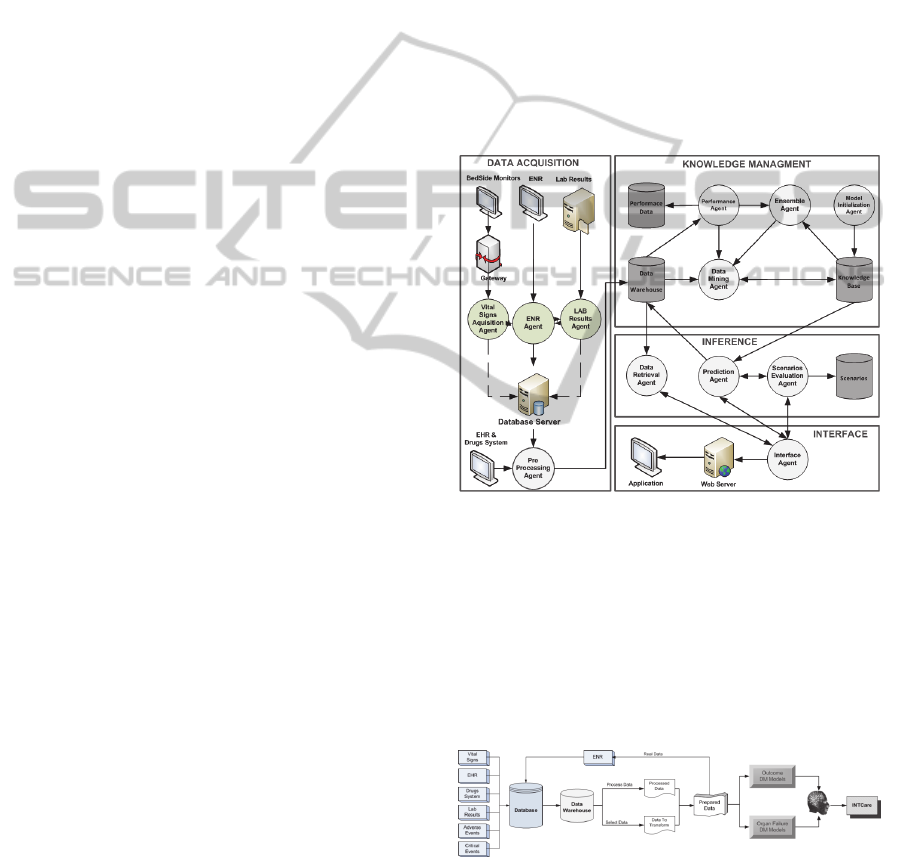
2.2 INTcare System
INTCare system is composed by four subsystems:
Data acquisition, knowledge management, Inference
and Interface. Each subsystem is autonomous and
uses intelligent agents to perform tasks. Figure 1
presents the current INTCare System and its agents.
In this work some of these Agents were used (Santos
et al., 2011). For data acquisition were used the
following agents: Gateway, Vital Signs Acquisition
agent
,
ENR agent, LR agent and AIDA.
Furthermore, it was used a pre-processing agent for
the data validation and transformation. Finally, the
induction of data mining models was assured by the
Data Mining agent. During the development of
INTCare, some features were added according to the
pervasive health care concept (Orwat et al., 2008);
(Varshney, 2007), making the system available
anywhere and anytime (Portela et al., 2011).
Figure 1: INTCare system.
2.3 Knowledge Discovery Process
Knowledge Discovery from Databases (KDD)
process is recognized as a process which can obtain
new knowledge using some data. This process is
composed by five stages: Selection, Pre-Processing,
Transformation, Data Mining and Interpretation
(Fayyad et al., 1996).
Figure 2: ICU knowledge discovery in database process.
Figure 2 shows the KDD process for the ICU
data. The database is populated with data from seven
major sources. The data are selected from the data
warehouse to be processed or transformed,
KMIS2012-InternationalConferenceonKnowledgeManagementandInformationSharing
82

depending of the goal to each variable. After this
task, the data are available to be presented by the
ENR and prepared for the creation of Data Mining
Models. Finally, all models are evaluated and the
obtained knowledge is presented in the INTCare
system.
2.4 Data Mining
The use of DM techniques in the medical arena has
been gaining an increasing interest by researchers
but despite the high expectative its application in
real world settings has been limited (Bellazzi and
Zupan, 2008). In this case, and considering the
targets, it should be treated as a classification
problem (Han and Kamber, 2006). Bearing in mind
this point and the idea of having a pervasive and
real-time IDSS, a set of DM solutions were
explored. However, most of them were discarded
due to the fact that they can’t receive data from the
database, process them and store it again into the
database tables in a continuous and quick process.
After achieving a set of evaluation and experiments,
it was decided to develop prevision models using
Oracle Data Mining system (ODM). ODM
(Concepts, 2005); (Tamayo et al., 2005) was chosen
because it gives the possibility to perform all tasks
using the database in real-time and are from the
same supplier of Hospital database. The techniques
of classification used are some of the most used in
DM (Wu et al., 2008) such as Support Vector
Machine, Decision Trees and Naïve Byes. The data
mining results obtained in the past were achieved
using other techniques and data with a semi-
automatic process and offline method.
3 DATA SELECTION &
PRE-PROCESSING
The two initial phases of KDD process (Portela et
al., 2012) use the data acquisition system presented
in the background section (Figure 1) to obtain the
data. The first phase is concerned with the data
selection from database and is in agreement with
what is necessary for the DM Models:
ICU_HL7 {Vital Signs}
ICU_HL7_T {Vital Signs auto validated (real
values)}
ICU_PARAM {ICU Limits (max, min) values}
ICU_LR {All Lab Results}
ICU_DRUGS {All Patient Drugs
administrated}
ICU_ENR {Data validated and provided
from ENR}
ICU_CEVENTS {ICU Critical Patient Events}
EHR_ADMIN {ICU Patient Admission}
EHR_OUT {ICU Patient Outcome}
The second phase is responsible for the automatic
data validation and patient identification, where it is
ensured that all data collected are valid and are
correctly identified, i.e. all values collected are
between the normal ranges of ICU values, and have
a valid patient identification (PID) (Portela et al.,
2011). At pre-processing phase, other procedures are
executed to prepare the Data Mining input table. For
example, only the first five days values collected are
used. When the patient is admitted to ICU, an agent
is responsible to prepare automatically the table
adding 120 rows for that patient. When patient goes
out, if he/she leaves before 120 hours, the rows in
excess are deleted. This table is used as a temporary
table of DM input table. In this table are stored: case
mix values for all 120 lines and the number of
critical events and SOFA (0, 1) values for each hour.
DM agent gets all variables present in temporary
tables and in addition calculates the values in fault.
4 TRANSFORMATION
The third phase of KDD process it is autonomous
and don’t requires a manual action. All tasks were
performed automatically and in real-time, by the
INTCare intelligent agents. The variables in use are:
SOFA
Cardio, Respiratory, Renal, Liver, Coagulation, neurologic
= {0,
1};
Case Mix = {Age (1-4), Admission type (U or P),
Admission from (1-6)};
Critical Events Accumulated (ACE) = {ACE of
Blood Pressure (|N), ACE of Oxygen Saturation
(|N), ACE of Heart Rate (|N), ACE of Urine Output
(|N)}
Ratios1 (R1) = {ACE of BP/elapsed time of stay
(Q+), ACE of SO2/elapsed time of stay (Q+), ACE
of HR/elapsed time of stay (Q+), ACE of Ur/elapsed
time of stay (Q+), Total of ACE / elapsed time of
stay (Q+)}}.
Ratios2 (R2) = {ACE of BP / max number of ACE
of BP (Q+), ACE of SO2/ max number of ACE of
SO2 (Q+), ACE of HR / max number of ACE of HR
(Q+) , ACE of Ur / max number of ACE of Ur (Q+),
Total of ACE (Q+), Total of ACE / Total ACE max
(Q+)}.
DataMiningPredictiveModelsforPervasiveIntelligentDecisionSupportinIntensiveCareMedicine
83

Ratios (R) = R1 U R2
ACE of HR: Sum of values hour by hour for each
event type. Example if in first hour has 1 event and
in the second hour 2, the ACE of second hour is 3.
Total of ACE is the sum of all ACE of the hour.
Max Number of ACE is the number max of each
variable present in Table 4.
Elapsed Time of Stay: Number of hours elapsed
since patient admission in the moment of ratio is
calculated.
Total ACE Max is always 33 (10+10+6+7) (Table
4).
Outcome = {0, 1}
Table 2 presents the values considered.
Table 1: Variables transforming (example).
ID Variable Min Max Value
Age
- 18 46 1
- 47 65 2
- 66 75 3
- 76 130 4
Admission Type
Urgent - - u
Programed - - p
Admission From
Chirurgic - - 1
Observation - - 2
Emergency - - 3
Other ICU - - 4
Other Hospital - - 5
Other Situation - - 6 or 7
SOFA
Cardio
BP (mean) 0 70 1
Dopamine 0,01 - 1
Dobutamine 0,01 - 1
Epi / Norepi 0,01 - 1
Renal Creatinine 1.2 - 1
Resp Po2/Fio2 0 400 1
Hepatic Bilirubin 1.2 - 1
Coagul Platelets 0 150 1
Neuro Glasgow 3 14 1
The first transformation process is a simple task
for analysing the values collected and for
transforming them according to some rules (if then
else). This process is applied to the variables
presented in Table 2. When there is a case mix, all
variables are inserted in database. When a patient
comes into the ICU, a procedure is executed.
Regarding to the age parameter, the procedure
verifies the patient age. For the admission type and
origin, the admission form is consulted in the EHR.
In all the cases the values are processed and the
value is inserted into DM_INPUT table.
In the case of the SOFA, the approach is a little
different. The values are collected in real-time and in
a continuous way. The data mining models only use
one value per hour. All collected values are
considered and the final value is assigned. If more
than one result by hour is verified, only the worst
value of the hour is considered. For example, in the
cardiovascular system, there are five different
possibilities (BP, Dopamine, Dobutamine, Epi and
Norepi) and it is sufficient if one of them is 1. The
SOFA values are then transformed in binary
variables, where 0 describes normality and 1
describes dysfunction/failure and comprises the
original SOFA. By default the sofa value variable is
0 and, if some condition is verified (eg. for
coagulation, platelets <=150) the values are update
to 1. This update has effect in the starting date which
the value was measured. The outcome value (live or
died) is updated according to the patient final state.
The value in the table is always 0 (live) except if the
patient dies. In this case all of the values in the input
table are updated to 1.
The second transformation phase uses critical
events. Firstly, a set of procedures are executed in
order to understand if a value is critical and if the
event is adverse.
Table 2: presents the variables in study and the
min and max values for each case.
Table 2: Data ranges.
EvId Descr
Min
EC
Max
EC
Min
Val
Max
Val
Min
Any
Max
Any
1011 BP 90 180 0 300 60
3000 O2 90 100 0 100 80
2009 HR 60 120 0 300 30 180
DIU UR 30 1000 0 1000 10
At first, it is verified if a value is valid, then it is
analysed if that value is critical and how critical is it.
According to the Table 3, a value can be considered
normal (0), critical (1) or too critical (2). In the case
of the value is critical (1), the event will be only
considered critical if the values collected are verified
during some certain time. If the value is spontaneous
and is too bad (2), the event will be always critical
during the time of the event. This process is
presented in the following pseudocode:
IF VALUE >= MIN_VAL AND <= MAX_VAL
THEN
IF VALUE >= MIN_EC AND <= MIN_EC
THEN
SET EVENT_TYPE TO 1
ELSEIF VALUE <= MIN_ANY OR VALUE >=
MAX_ANY
SET EVENT_TYPE TO 2
ELSE SET EVENT_TYPE TO 0
ENDIF
ENDIF
Then each collected value will be inserted in the
KMIS2012-InternationalConferenceonKnowledgeManagementandInformationSharing
84

events table according to the event type and if the
predecessor event is or not the same. To know if this
event type is of same type a flag will be used.
After know the importance of the values, another
procedure starts. This procedure is used to
understand if the critical values collected may or
may not represent a critical event. To this end, Table
3 is used. To consider an event as a critical event it
is necessary to achieve one of the two
characteristics. For example, in the case of SpO2 it
is necessary to have values <= 90 and >=80 for more
than one hour, or <=80 during all the period.
Table 3: The protocol for the out of range physiologic
measurements (adapted by Álvaro (Silva et al., 2008)).
BP
(mmHg)
SpO2
(%)
HR
(bpm)
UR
(ml/h)
Normal range 90 - 180 >= 90 60 - 120
>= 30
Critical event
a
>= 1h >= 1h >= 1h >= 2h
Critical event
b
< 60 <80 <30 V> 180 <= 10
a Defined when continuously out of range.
b Defined anytime.
After all values are correctly inserted in patient
events table, a procedure is executed. This procedure
is responsible for reviewing the values according to
the event time and type; if a critical event is verified,
the event will be inserted in critical events table.
Then, and after have the events are stored in
critical events table, an hourly procedure is
executed. This procedure calculates the
Accumulated Critical Events (ACE) – to reflect the
patients’ clinical evolution/severity of illness by
hour. The next step is the obtaining of the ratios.
This process was one of the most difficult to
implement due to the need of a real-time
calculations in the exact moment when the value is
collected. This process requires much memory and
processing time and can delay other procedures. For
the ratios which use the number of maximum critical
events by hour, it is used the maximum number of
occurrences verified in the past (Table 4). The max
values are updated in the future according to the
number max of events verified by a patient for each
variable.
Table 4: Critical Events daily number (adapted from
(Silva, et al., 2008)).
Variables Min Max
Daily number of critical blood pressure events 0 10
Daily number of critical heart rate events 0 10
Daily number of critical oxygen events 0 6
Daily number of critical urine events 0 7
The next procedure is a selection of the code to
calculate the ACE and all ratios to DM model.
During all the processes described above, a
procedure is responsible to get all data generated and
store them in a specific table for the DM task.
Finally, and after having all values correctly inserted
in DM input table, another procedure runs to clean
the bad values. This procedure is responsible to
delete all rows which have null / incorrect values.
5 REAL-TIME DATA MINING
After all data have been processed, some models
were developed and induced. Only in this step,
appears the first manual operation, i.e., the data
mining models must be manually configured. 108
models were developed (6 targets x 6 models x 3
techniques). The data mining models were induced
in two steps: the first is responsible to prepare the
final data to be used by the prediction models; in the
second, the data obtained by the first stage are used
by DM techniques to predict the probability of
failure of each organ and patient outcome.
In the first step, the data stored in the DM input
table is loaded. The numbers (ACE and ratios) are
distributed using the Bin Top 7 method. The other
values are maintained as they are, and a final table is
generated. This table are then used to predict the
targets and six models M1 to M6 are induced for
each target (renal, hepatic, coagulation,
cardiovascular, respiratory and outcome) by each
technique (DT, NB, SVM):
M1 CM + ACE
M2 CM + ACE + R
M3 CM + ACE + R1
M4 CM + ACE + SOFA
M5 CM + ACE + SOFA + R
M6 CM + ACE + SOFA + R2
M7 CM + ACE + SOFA + R1
M7 NOT CONSIDERED (RESULTS = M5)
During the modulation of DM, the neurologic
system was not considered due to the high number
of data in fault.
Figure 3 provides an overview of Data Mining
modulation. In this figure it can be observed that the
data preparation module is executed using the data
stored in database. After the transformation phase,
the data are stored in DM_INPUT_DB table. This
table is then used to predict the value of six target
variables. Afterwards, the obtained results are
applied into the prediction table of the patients
admitted in ICU (UCI_PATIENT_5DAYS_AG).
Then, six new columns are added containing the
DataMiningPredictiveModelsforPervasiveIntelligentDecisionSupportinIntensiveCareMedicine
85
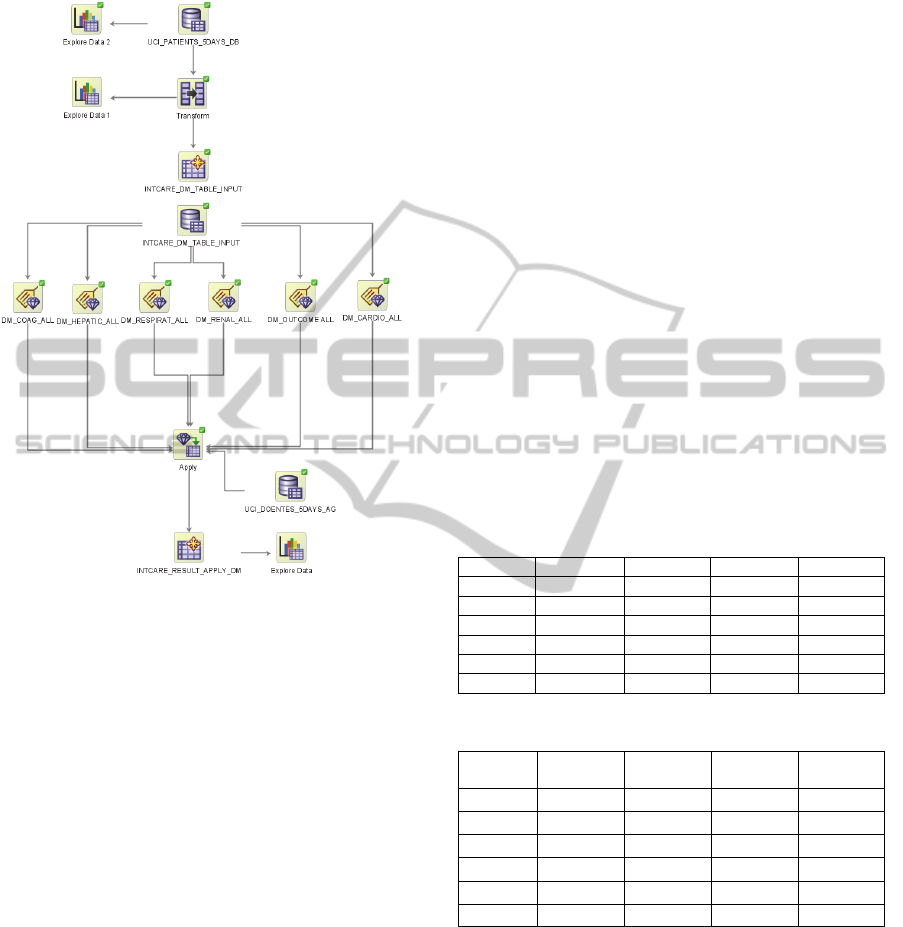
prediction of happen 1 for each target. In the data
mining engine, each target is an individual process.
Figure 3: ODM model.
In order to also automate this process, some
researche has been done to find how to induce DM
models automatically. As result it was possible to
develop a procedure to execute the DM engine in
real time. The DM agent is responsible to run the
engine whenever a request is made. This procedure
gets the data stored in UCI_PATIENT_5DAYS_AG
table and stores them into a new table
(INTCARE_RESULTS_APPLY) combinded with
the probability to be 1 for each target.
6 EVALUATION
In order to evaluate the models, a test phase using
online learning was performed. The Data Mining
techniques were applied in the following dataset:
Data Description:
Collection Time: 89 days
Patients Number: 109
Data Considered: Values of five first days
Exclusion criterion I: Patient with data collecting intermittent, i.e.,
the collection system failed at least more
than one hour in a continuous way;
Exclusion criterion II: Existence of null values;
Data Input Distribution of the Inputs and
Targets:
NULL RECORDS: 0,00%
AGE = 1:
AGE = 2:
AGE = 3:
AGE = 4:
ADMIN FROM = 1:
ADMIN FROM = 2:
ADMIN FROM = 3:
ADMIN FROM = 4:
ADMIN FROM = 5:
ADMIN FROM = 6:
ADMIN FROM = 7:
ADMIN TYPE = U:
ADMIN TYPE = P:
0,00%
39,64%
22,85%
37,51%
50,45%
0,00%
9,51%
3,79%
2,64%
21,01%
40,06%
59,94%
40,06%
OUTCOME = 1: 12,58%
SOFA COAG = 1: 9,22%
SOFA HEPATIC = 1: 9,85%
SOFA RENAL = 1: 5,16%
SOFA RESPIRATORY = 1: 3,45%
SOFA CARDIO = 1: 27,37%
After the DM engine has been run, the best results
obtained for each target are presented in Table 5.
Table 5: Results by organ systems and outcome (%).
Target Technique Scenario Sensibility Accuracy
Cardio SVM M6 67.0 87.3
Respirat SVM M4 99.8 91.5
Renal DT M5 96.4 99.3
Liver SVM M2 100 100
Coag SVM M6 97.5 92.6
Out SVM M4 100 99.5
Table 6: Variation of the obtained results.
Target
SENS
OLD
ACC
OLD
SENS
VAR
ACC
VAR
Cardio
93.4 92.7 - 26.4 -5.4
Respirat
96.2 98.1 3.6 -6.6
Renal
98.1 96.9 -1.7 2.4
Liver
98.3 98.1 1.7 1.9
Coag
97.5 98.2 0 -5.6
Out
98.3 97.4 1.7 2.1
Comparing the results (Table 6) obtained
previously (Filipe Portela et al., 2010) and those
observed in this study (table 5) it is possible to
conclude that some targets (respiratory, liver,
coagulation and outcome) present better results. In
the opposite direction the cardiovascular target
worsened. The models will be used according to the
results obtained in terms of sensibility. In a general
way, the results are widely satisfactory. Due to the
limited dataset (89 patients), we believe that it is
KMIS2012-InternationalConferenceonKnowledgeManagementandInformationSharing
86

possible to improve the results in the future. Duo to
the frequency of admissions in the ICU, a more
comprehensive study may require at least one year
of continuous data acquisition.
7 CONCLUSIONS
The process of development of an IDSS which can
be autonomous and able to operate in real-time is a
big challenge. In this work, the most difficult task
has been the transformation of the data process, and
the process to obtain critical events and their ratios.
The results proved that it is possible to
implement an IDSS in critical health environments
minimizing the human intervention.
The greatest contribution of this work is the
automation of the entire KDD process, in particular,
the data transformation and the data mining
processes. INTCare become an autonomous system
and is able to, in a automatically and in real-time
way, predict the organ failure and outcome for the
next 24 hours for the patients admitted in ICU. The
DM engine operates autonomously. This engine runs
the models and makes the probability results
available through the INTCare system.
Experimental work has been conducted in order
to compare the sensibility and accuracy values
attained using online DM models with those
obtained in offline.
In the work has been considered data from a
limited number of patients. The obtained results
were very good and, in general, similar to the values
obtained in the past, using a semi-autonomous
process. The doctors can now access to patient data
anywhere and anytime, through the electronic
nursing record, and they can consult the probability
of organ failure and the outcome in an intuitive,
quick and easy way. A questionnaire has been
prepared in order to understand the level of
acceptance of the system. The answers provided by
the doctors and by the nurses were very satisfactory
and motivating.
Further work will include more data to optimize
the DM models. Complementarily, it will be
considered the development of an ensemble.
ACKNOWLEDGEMENTS
The authors would like to thank FCT (Foundation of
Science and Technology, Portugal) for the financial
support through the contract PTDC/EIA/72819/
2006. The work of Filipe Portela was supported by
the grant SFRH/BD/70156/2010 from FCT.
REFERENCES
Bellazzi, R., & Zupan, B., (2008). Predictive data mining
in clinical medicine: current issues and guidelines.
International journal of medical informatics, 77(2),
81-97.
Concepts, O. D. M., (2005). 11g Release 1 (11.1). Oracle
Corp, 2007.
Fayyad, U. M., Piatetsky-Shapiro, G., & Smyth, P. (1996).
From data mining to knowledge discovery: an
overview.
Gago, P., Santos, M. F., Silva, Á., Cortez, P., Neves, J., &
Gomes, L., (2006). INTCare: a knowledge discovery
based intelligent decision support system for intensive
care medicine. Journal of Decision Systems.
Han, J., & Kamber, M., (2006). Data mining: concepts
and techniques: Morgan Kaufmann.
Lyerla, F., LeRouge, C., Cooke, D. A., Turpin, D., &
Wilson, L., (2010). A Nursing Clinical Decision
Support System and potential predictors of Head-of-
Bed position for patients receiving Mechanical
Ventilation. American Journal of Critical Care, 19(1),
39-47.
Orwat, C., Graefe, A., & Faulwasser, T., (2008). Towards
pervasive computing in health care - A literature
review. [10.1186/1472-6947-8-26]. BMC Medical
Informatics and Decision Making, 8(1), 26.
Portela, F., Santos, M., Vilas-Boas, M., Rua, F., Silva, Á.,
& Neves, J., (2010). Real-time Intelligent decision
support in intensive medicine. Paper presented at the
KMIS 2010- International Conference on Knowledge
Management and Information Sharing.
Portela, F., Santos, M. F., Gago, P., Silva, Á., Rua, F.,
Abelha, A., et al., (2011). Enabling real-time
intelligent decision support in intensive care. Paper
presented at the 25th European Simulation and
Modelling Conference- ESM'2011, Guimarães,
Portugal.
Portela, F., Santos, M. F., Silva, Á., Machado, J., &
Abelha, A., (2011). Enabling a Pervasive approach
for Intelligent Decision Support in Critical Health
Care. Paper presented at the HCist 2011 –
International Workshop on Health and Social Care
Information Systems and Technologies.
Portela, F., Santos, M. F., & Vilas-Boas, M., (2012). A
Pervasive Approach to a Real-Time Intelligent
Decision Support System in Intensive Medicine. In
Springer (Ed.), Communications in Computer and
Information Science (Vol. 0272, pp. 14).
Santos, M. F., Portela, F., Vilas-Boas, M., Machado, J.,
Abelha, A., & Neves, J., (2011). INTCARE - Multi-
agent approach for real-time Intelligent Decision
Support in Intensive Medicine. Paper presented at the
3rd International Conference on Agents and Artificial
Intelligence (ICAART), Rome, Italy.
DataMiningPredictiveModelsforPervasiveIntelligentDecisionSupportinIntensiveCareMedicine
87

Santos, M. F., Portela, F., Vilas-Boas, M., Machado, J.,
Abelha, A., Neves, J., et al., (2009). Information
Modeling for Real-Time Decision Support in Intensive
Medicine. In S. Y. Chen & Q. Li (Eds.), Proceedings
of the 8th Wseas International Conference on Applied
Computer and Applied Computational Science -
Applied Computer and Applied Computational Science
(pp. 360-365). Athens: World Scientific and
Engineering Acad and Soc.
Silva, Á., Cortez, P., Santos, M. F., Gomes, L., & Neves,
J., (2008). Rating organ failure via adverse events
using data mining in the intensive care unit. Artificial
Intelligence in Medicine, 43(3), 179-193.
Tamayo, P., Berger, C., Campos, M., Yarmus, J.,
Milenova, B., Mozes, A., et al., (2005). Oracle Data
Mining. Data Mining and Knowledge Discovery
Handbook, 1315-1329.
Varshney, U., (2007). Pervasive healthcare and wireless
health monitoring. Mobile Networks and Applications,
12(2-3), 113-127.
Vilas-Boas, M., Santos, M. F., Portela, F., Silva, Á., &
Rua, F., (2010). Hourly prediction of organ failure
and outcome in intensive care based on data mining
techniques. Paper presented at the 12th International
Conference on Enterprise Information Systems.
Vincent, J., Mendonça, A., Cantraine, F., Moreno, R.,
Takala, J., Suter, P., et al., (1998). Use of the SOFA
score to assess the incidence of organ
dysfunction/failure in intensive care units : Results of
a multicenter, prospective study. Critical care
medicine, 26, 1793-1800.
Vincent, J. L., Moreno, R., Takala, J., Willatts, S., De
Mendonca, A., Bruining, H., et al., (1996). The SOFA
(Sepsis-related Organ Failure Assessment) score to
describe organ dysfunction/failure. Intensive care
medicine, 22(7), 707-710.
Wooldridge, M., (1999). Intelligent agents Multiagent
systems: a modern approach to distributed artificial
intelligence (pp. 27-77): MIT Press.
Wu, X., Kumar, V., Ross Quinlan, J., Ghosh, J., Yang, Q.,
Motoda, H., et al., (2008). Top 10 algorithms in data
mining. Knowledge and Information Systems, 14(1), 1-
37.
KMIS2012-InternationalConferenceonKnowledgeManagementandInformationSharing
88
