
Sign Recognition with HMM/SVM Hybrid
for the Visually-handicapped in Subway Stations
Dong-jin Lee
1
and Ho-sub Yoon
2
1
University of Science and Technology/ Department of Computer Software and Engineering, Daejeon, Republic of Korea
2
Electronics and Telecommunications Research Institute,
Robot and Cognition System Research Department, Daejeon, Republic of Korea
Keywords: Sign Recognition, Character Recognition, Hybrid HMM/SVM, Feature Extraction, Natural Scene Images.
Abstract: In this paper, we propose a sign classification system to recognize exit number and arrow signs in natural
scene images. The purpose of the sign classification system is to provide assistance to a visually-
handicapped person in subway stations. For automatically extracting sign candidate regions, we use
Adaboost algorithm, however, our detector not only extracts sign regions, but also non-sign (noise) regions
in natural scene images. Thus, we suggest a verification technique to discriminate sign regions from non-
sign regions. In addition, we suggest a novel feature extraction algorithm cooperated with Hidden Markov
Model. To evaluate the system, we tested a total of 20,177 sign candidate regions including the number of
8,414 non-sign regions on the captured images under several real environments in Daejeon in South Korea.
We achieved an exit number and arrow sign recognition rate of each 99.5% and 99.8% and a false positive
rate (FPR) of 0.3% to discriminate between sign regions and non-sign regions.
1 INTRODUCTION
The number of visually-handicapped people in
South Korea increased up to 249,000 in 2010
compared to 136,000 in 2002, an increase of 83 per
cent over the past 8 years. Only approximately the
number of ten dogs in South Korea, however, has
completed the whole course of training to become a
guide dog every year. The shortage of guiding dogs
calls for other guiding aids to be developed. As a
means of guiding the handicapped, we propose a
sign classification system to recognize exit numbers
and arrow signs in subway stations.
Several researches on aiding systems for
assisting visually impaired individuals have been
recently studied. Chen suggested an algorithm for
detecting and reading text in natural scenes (Chen et
al., 2004). The algorithm intends to help visually-
impaired people when they are walking around the
city. The main topic of such studies is how to detect
text and sign regions correctly.
For this reason, many approaches to the
detection of text and sign from natural scene images
have been developed. However, most suggested
detectors not only extract sign and text regions, but
also some of rest, i.e., noise regions. One remedy to
this problem is to employ a recognition verification
strategy.
Consequently, in this paper, we suggest a
verification technique to discriminate sign regions
from non-sign regions. In addition, we suggest a
novel feature extraction algorithm cooperated with
Hidden Markov Model.
2 SYSTEM OVERVIEW
2.1 Detection and Preprocessing
Sign Sign regions are predicted by the MCT-
AdaBoost technique, which is used for face detection
(Froba et al., 2004). After our detector extracts sign
candidate regions, a preprocessing is done in the
next step. It consists of three stages: Binarization,
Segmentation and Normalization.
First, we experimented with two different types
of binarization methods: Otsu and Niblack (Otsu,
1979; Niblack, 1986). As a result, Otsu algorithm is
better in performance for our system as shown in fig.
1(c) compared to in fig. 1(b). Thus, we adopted the
Otsu algorithm; however, we have discovered some
631
Lee D. and Yoon H..
Sign Recognition with HMM/SVM Hybrid for the Visually-handicapped in Subway Stations.
DOI: 10.5220/0004155006310634
In Proceedings of the 4th International Joint Conference on Computational Intelligence (NCTA-2012), pages 631-634
ISBN: 978-989-8565-33-4
Copyright
c
2012 SCITEPRESS (Science and Technology Publications, Lda.)
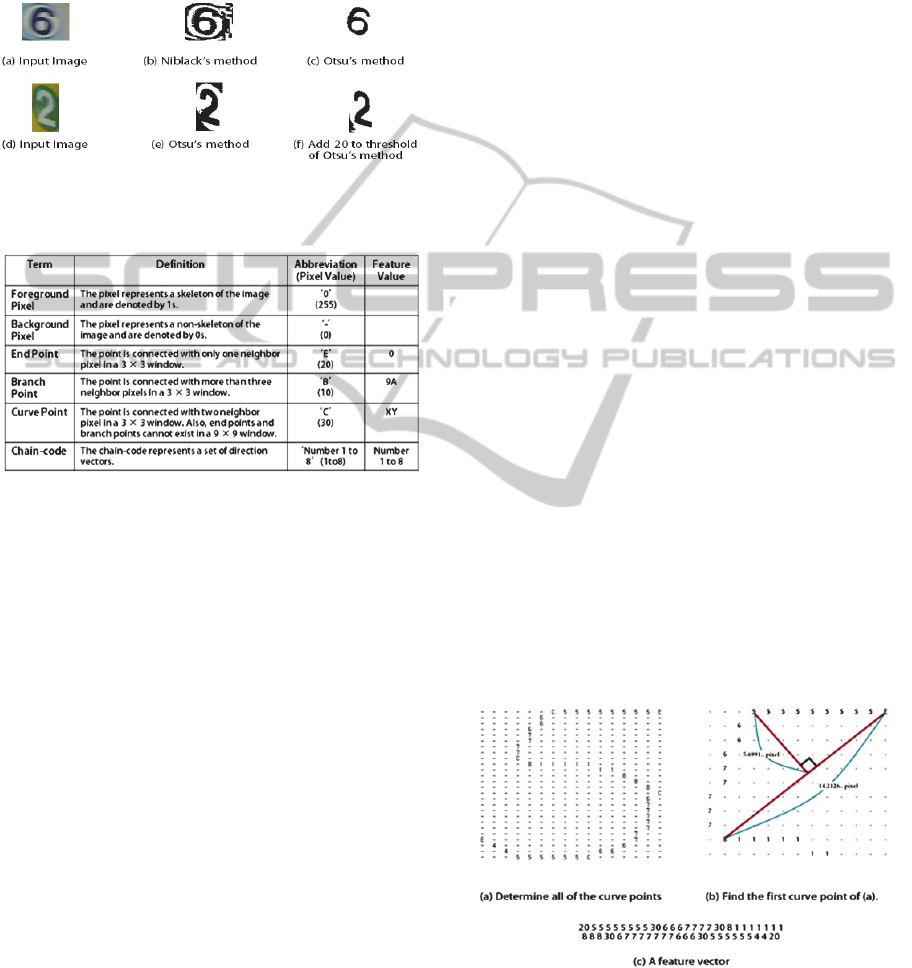
binarization errors in fig. 1(e). In order to obtain a
better binary image, we add 20 to the threshold of
the Otsu’s method if the candidate sign is white,
otherwise, we minus 7 to the threshold if the
candidate sign is black. It achieves good result as
shown in fig. 1(f).
Figure 1: Comparison of the binarizations.
Table 1: The definition of each pixel.
At the segmentation stage, we perform the blob
analysis (Yoon et al., 2011). This algorithm is
simple but useful method to inspect all labeled blobs
to exclude non-sign blobs.
In the next stage, we normalized the size of the
selected blob by 24 × 24 pixels, then performed a
median filter to make the selected blob more
smoothly.
2.2 Feature Extraction and
Recognition using SVM
We adopted 8-direction gradient features prosed by
Liu (Liu et al., 2008). In the feature extraction, each
pixel calculates a weighted vote in a normalized
image image using the Sobel operator, which is used
to calculate approximations of the horizontal and
vertical derivatives. Then, the votes are accumulated
into 8 orientation bins over in 0˚-360˚. After that,
each pixel of the 8 orientation bins merged into N ×
N blocks in the image to reduce the dimensionality.
Also, we employed library for Support Vector
Machines (LIBSVM), and performed multiclass
classification using SVM (Chang et al., 2001). In
this work, we trained 8,500 sample images including
500 non-sign (noise) images, which are selected
randomly from natural scene images in the subway
station. Then, we tested 2550 samples with 150 non-
sign sample images to check the performance of the
trained classifier and gained 99.96% of recognition
accuracy.
2.3 Feature Extraction and
Recognition using HMM
In this section, we define the term of the important
pixels as shown in our previous research in table 1
and explain about how to make our feature vectors
(Kim et al., 2011).
In the first step, we adopted Ahmed’s thinning
algorithms (Ahmed et al., 2002). Because this
algorithm preserves the shape of the binary image.
Also, it means that the method is rotation invariant.
After the thinning algorithm is performed, the
skeleton of the binary image is extracted.
In the second step, we easily find the end points
and branch points by convolving the image with a 3 ×
3 window. After that, we determine the starting point
of the skeleton tracing by the following priority.
1) A Top-left End point.
2) A Top-Left Branch point.
3) A Top-Left foreground pixel.
Next, we have visited all of the foreground pixels
from the starting point and store the tracking
information into a vector space called Vec at the
same time. As a result, we completed a chain code
in fig. 2(a). After that, we modify a pixel value of
the chain code in order to make it more smoothly
like a median filter. (Kim
et al
., 2011).
Figure 2: Sequence of feature extraction.
In the third step, we find curve points by the
certain condition as mentioned in table 1 and then
we delete curve points that are not met the specific
IJCCI2012-InternationalJointConferenceonComputationalIntelligence
632

condition in fig. 2(b). The algorithm is as follows:
Algorithm 1 Delete curve points
Begin
A = point (only for Curve Point)
B = point on line CD orthogonal with A
Line CD = A line from Point to Vec[i]
Point = the x and y coordinates of the starting point
Vec = vector space excluding candidate curve points
Vec2 = vector space including candidate curve points
nMinimum = 9 pixel
dThreshold = 4.95 pixel
nIndex = 0
For(i=3 to vec.size -1)
Line CD = distance from Point to Vec2[i]
If (Vec2[i] == Branch Point && Vec2[i] == End point)
Point = Vec2[i+1]
nIndex = i + 1
If (line CD > nMinimum)
For(j=nIndex to i)
If (Vec2[j] == Curve Point)
A = Vec2[j]
nIndex = Find the maximum distance from A to
B longer Than dThreshold
If (success to find the curve point)
Update (Vec)
i = nIndex
Point = the x, y coordinates of the Vec2[nIndex]
End
Here, to find the maximum distance from A to B, we
first calculate the angle θ between Line CD and x-
axis, then we rotated the points between Point and
Vec2[i] as angle θ in a clockwise direction. The
following equation is used:
′
sin
cos (1)
Where point(x, y) are the coordinates of A and
point(a, b) are the coordinates of Point. After that, the
absolute value of y´ is the distance between A and B.
In the fourth step, we generate our novel feature
vector using a set of pixel values as shown in fig. 2
(c). To demonstrate the advantage of this feature
extraction algorithm, we trained 8,000 sample images
(500 sample images for each class) using HMM and
tested 2,400 another sample images. As a result, we
achieve an overall accuracy of 98.29% with HMM
(Rabiner, 1989).
2.4 Verification
In this section, we propose a verification technique to
discriminate sign regions from non-sign regions.
Before the verification technique is applied, we
combined the recognition results from two different
types of classifiers: SVM and HMM. Because, when
we only get a result using SVM, true positive rate
(TPR) is low, although the recognition result is
reasonable in table 2. For this work, we estimated
probabilities for multi-class classification based on
Wu’s method using the SVM (Wu et al., 2004). After
that, if the result is noise, not exit numbers and arrows
and the probability is less than a certain threshold, we
would select the result from the HMM. Otherwise, the
result from the SVM is selected.
In the next step, a verification technique is
performed. The decision of acceptance or rejection is
taken by comparing with the HMM’s log-likelihood
to a threshold (Van et al., 2004). To find the optimal
threshold, we investigated the number of 40000
images (2500 per each class).
3 EXPERIMENTAL RESULTS
In our research, the code to implement an algorithm
was C++ and we achieved the processing time of our
system was about 5-15 fps on a 3.4-GHz Pentium
IV PC with high resolution images (1280 × 480
pixels).
For evaluating the performance of our proposed
system, we went to City Hall subway station where
we tested the system in Daejeon. Our detector
extracted a total of 20,178 sign-candidate regions
including the number of 8,414 non-sign regions for
10 minutes while walking around on the sidewalk
for blind people in the subway station. We achieved
an exit number and arrow sign recognition rate of
each 99.5% and 99.8% in table 2. However, there is
none of Down, Down-Left, Down-Right arrow and
exit number 9 signs At the City Hall subway station
as shown in fig. 3. Then, the true positive rate (TPR)
and false positive rate (FPR) are shown in table 2.
Figure 3: The recognition result of the different
combinations.
SignRecognitionwithHMM/SVMHybridfortheVisually-handicappedinSubwayStations
633

Finally, we compared three different
combinations: our proposal system and our novel
feature vector with HMM and other feature vector
with SVM. Also, we tested these combinations with
verification techniques as shown in table 2. As a
result, HMM+SVM with a verification technique is
better than the others.
Table 2: Comparison of the different combinations.
4 CONCLUSIONS
We have proposed a sign classification system,
focusing on 16 classes of exit number and arrow
signs. The main contribution of this paper is that we
suggest two methods: a novel feature extraction
algorithm and a verification technique. The main
advantage of our feature extraction algorithm is that it
is robust to various types and styles of signs. Also, a
false positive rate of 0.3% has demonstrated that
combining the verification technique is a reliable
method for discriminating sign regions from non-sign
regions.
However, some improvements remain as for the
system to be applied in the subway station. First, it is
necessary to develop a sign tracking algorithm to
verify the sign detection results. This sign tracking
algorithm would be a help improve TPR. Secondly,
the system must be operated in real time. Currently, in
our research, the processing time of our system is
about 5-15 fps dependent on how many signs are
detected. Thus, these improvements will be the future
work.
ACKNOWLEDGEMENTS
This research was supported by the Converging
Research Center Program funded by the Ministry of
Education, Science and Technology (No.
2011K000655).
REFERENCES
Ahmed, M., Ward, R., 2002. “A Rotation Invariant Rule-
Based Thinning Algorithm for Character Recognition,”
IEEE Transactions on Pattern Analysis and Machine
Intelligence, vol. 24, pp. 1672-1678.
Chang, C. C., Lin, C. J, 2001. “LIBSVM: a library for
support vector machines,” ACM Transactions on
Intelligent System and Technology, 2:27:1—27:27.
Chen, X., Yuille, A. L., 2004. “Detecting and reading text
in antural scenes,” Computer Vision and Pattern
Recognition (CVPR), vol. 2, pp. 366-373.
Froba, B., Ernst, A., 2004. “Face Detection with the
Modified Census Transform,” IEEE Conf. on
Automatic Face and Gesture Recognition, pp.91-96.
Kim, J. E., Yoon, H. S., 2011. “Graph Matching Method
for Character Recognition in Natural Scene Images,”
Conf. on Intelligent Engineering Systems (INES), pp.
347-350.
Liu, C. L., 2008. “Handwritten Chinese character
recognition: effects of shape normalization and feature
extraction,” Lecture Notes in Computer Science, vol.
4768/2008, pp.104-128.
Niblack, W., 1986. “An Introduction to Image
Processing,” Prentice-Hall, Englewood Cliffs, pp. 115-
116.
Otsu, N., 1979. “A threshoild selection method from gray-
level histogram,” IEEE Trans. Syst. Man Cybern., vol.
9, pp. 62-66.
Rabiner, L. R., 1989. “A tutorial on hidden Markov
models and selected applications in speech
recognition,” Proc. of the IEEE, vol.77, pp. 257-286.
Van, B. L., Garcia-Salicetti, S., Dorizzi, B., 2004. “Fusion
of HMM’s likelihood and Viterbi path for on-line
signature verification,” Proc. of Lecture Notes in
Computer Science, vol. 3072. Berlin, Germany:
Springer-Verlag, pp. 16-22.
Wu, T. F., Lin, C. J., Weng, R. C., 2004. “Probability
Estimates for Multi-class Classification by Pairwise
Coupling,” The Journal of Machine Learning
Research, vol. 5, pp. 975-1005.
Yoon, Y. W., Ban, K. D., Yoon, H. S., Kim, J. H., 2011.
“Blob Extraction based Character Segmentation
Method for Automatic License Plate Recognition
System,” Conf. on Systems, Man, and Cybernetics
(SMC), pp. 2192-2196.
IJCCI2012-InternationalJointConferenceonComputationalIntelligence
634
