
A Neural Network Model of Cortical Auditory-visual Interactions
A Neurocomputational Analysis of the Shams-Illusion
Cristiano Cuppini, Elisa Magosso and Mauro Ursino
Department of Electronics, Computer sciences and Systems - DEIS, University of Bologna, Bologna, Italy
Keywords: Multisensory Integration, Neural Networks, Visual Illusion.
Abstract: The perception of the external world is based on the integration of data from different sensory modalities.
Recent theories and experimental findings have suggested that this phenomenon is present since the early
low-level cortical areas. The mechanisms underlying these early processes and the organization of the
underlying circuitries is still a matter of debate. Here, by using a simple neural network to reproduce and
analyse a well-known cross-modal illusion occurring in the visual cortex, we suggest that a fundamental
role is played by direct excitatory synapses between visual and auditory regions.
1 INTRODUCTION
The ability of the brain to integrate information from
different sensory channels is fundamental to
perception of the external world (Stein and Meredith,
1993). The classical idea of independent sensory
processing streams in the brain is challenged by
several recent evidences, which support models of
brain organization with multisensory interactions
occurring since early processing stages in primary
cortices (for a review, see Schroeder and Foxe, 2005).
Recent studies have revealed that even the visual
modality can be affected by signals of other sensory
modalities: as an example, sound can affect the
visual percept qualitatively, even when there is no
apparent ambiguity in the visual stimulus (Shams et
al., 2002). Several experimental works used a well-
known auditory-visual illusion to analyse the
mechanisms underlying multisensory interactions in
the brain. This is known as the sound-induced flash
illusion (or Shams illusion), in which sound alters
visual perception: a single flash, accompanied by
two auditory beeps, is mis-perceived as two flashes
(Shams et al., 2002). Several psychophysical and
neuroimaging results indicate that the illusion
reflects a perceptual phenomenon, and the auditory
interaction corresponding with the visual perceptive
illusion is associated with a modulation of the
activity in the visual cortex (Watkins et al., 2006).
The mechanisms subtending this phenomenon
can be better understood through mathematical
models, the use of which allows to put the mass of
data accumulated about this phenomenon and its
underlying circuitry into a coherent theoretical
structure. The objective of the present endeavour
was to develop a neural network model that suggests
a possible circuitry underlying cortical multisensory
integration, able to explain some audio-visual
illusions.
2 METHOD
The model consists of two arrays of N auditory and
N visual neurons, (Figure 1), topologically aligned
(i.e., proximal neurons in the array code for
proximal positions in space).
Figure 1: Schematic diagram of the neural network. Each
grey circle represents a neuron. Each line represents a
synaptic connection: lines ending with an arrow indicate
excitatory connections; lines ending with a solid point
indicate inhibitory connections.
We assumed a distance of 1° between adjacent
neurons and used N = 180, so that each layer covers
an area of 180° in the visual and acoustic space.
639
Cuppini C., Magosso E. and Ursino M..
A Neural Network Model of Cortical Auditory-visual Interactions - A Neurocomputational Analysis of the Shams-Illusion.
DOI: 10.5220/0004155306390642
In Proceedings of the 4th International Joint Conference on Computational Intelligence (NCTA-2012), pages 639-642
ISBN: 978-989-8565-33-4
Copyright
c
2012 SCITEPRESS (Science and Technology Publications, Lda.)
Neuron response is described with a first order
differential equation, and a steady-state sigmoidal
relationship, that simulates the presence of a lower
threshold and an upper saturation for neural
activation. In the following each element will be
denoted with a superscript, m, referred to a specific
cortical area (m = a or v, where a is referred to the
auditory area and v to the visual), and a subscript, j,
which indicates the spatial position within that area.
u(t) and y(t) are used to represent the net input and
output of a given neuron at time t, respectively.
Thus,
)(ty
m
j
represents the output of a unit at
position j with modality m, described by the
following differential equation:
)()(
)(
tuFty
dt
tdy
m
j
m
j
m
j
(1)
where
is the time constant and F(u) represents a
sigmoidal relationship:
)(
1
1
)(
m
j
us
m
j
e
uF
(2)
s and θ are parameters which establish the slope and
the central position of the sigmoidal relationship,
respectively. The saturation value is set at 1, i.e., all
activities are normalized to the maximum.
For the sake of simplicity, in this work the
neurons belonging to both areas are described by
using the same parameters and the same time
constant.
The net input that reaches a neuron (i.e., the
quantity
)(tu
m
j
in Eq. 1) is the sum of an external
input, the contribution of lateral synapses from other
neurons in the same area, and an input from the area
processing the other sensory modality.
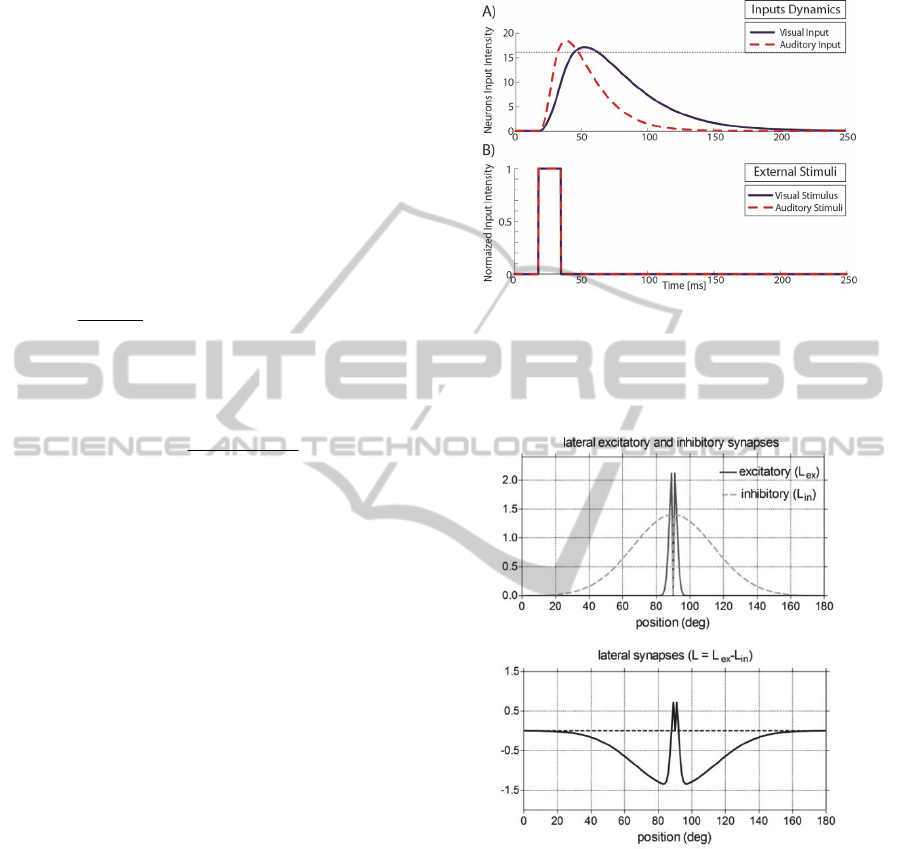
The external inputs are simulated by means of a
spatial Gaussian function, to mimic the sensory
receptive fields, and a second order differential
equation, to mimic the temporal evolution of the
stimuli on the cortex, as shown in Figure 2.
A fundamental point in the model is that the visual
neurons exhibit a smaller spatial receptive field
compared with the auditory ones (i.e., better spatial
resolution) but a slower time constant (i.e., less
accurate temporal precision), as shown in Figure 2.
This is the only difference between the two areas.
To simulate the lateral input, neurons within each
area interact via excitatory and inhibitory lateral
synapses, following a classical Mexican-hat
disposition (a central excitatory zone surrounded by
an inhibitory annulus, see Fig. 3). Thus, each neuron
excites (and is excited by) its proximal neurons, and
inhibits (and is inhibited by) more distal neurons.
Figure 2: Panel A) reports the temporal evolution of the
overall visual (blue line) and auditory (red line) input
targeting a neuron, generated respectively by a single
visual flash (blue line, panel B) and a single auditory beep
(red line) filtered by a second order differential equation.
Figure 3: Pattern of the lateral synapses targeting (or
emerging from) an exemplary neuron.
Finally, the cross-modal input is obtained
assuming that each neuron receives an excitation
from the neuron of the other modality placed at the
same spatial position (i.e., we have a one-to-one
reciprocal connection). The weight of this reciprocal
excitation is the same for all neurons.
3 RESULTS
Simulations were performed to study cortical
IJCCI2012-InternationalJointConferenceonComputationalIntelligence
640
multisensory interactions, and to elucidate the
mechanisms responsible for the visual illusion.
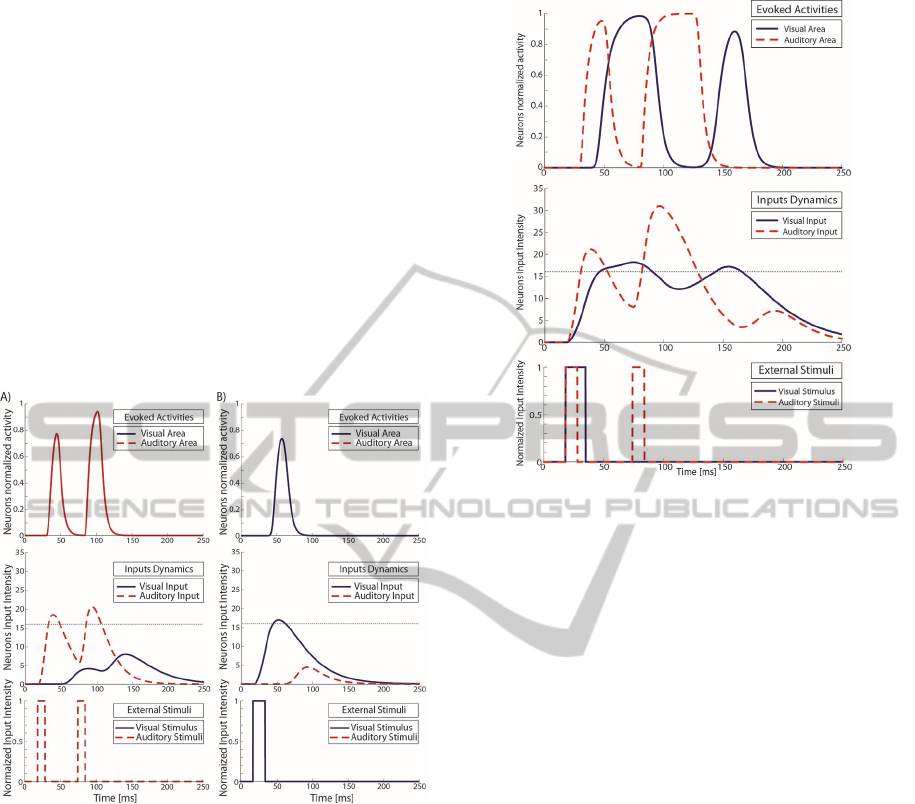
In a first set of trials, we simulated the case of
unisensory stimulation, to check that stimuli of one
modality do not evoke any activity in the other
modality. Since the Shams illusion is tested by
applying two beeps and a single flash, we first
mimicked the case of two beeps only (Figure 4a),
then the case of a single flash (Figure 4b). The upper
panels in these figures represent the evoked activity
in the visual and auditory areas, the middle panel
represents the net inputs to the corresponding
neurons (i.e., the quantity
)(tu
m
j
in Eq. 1), and the
bottom panels the position and amplitude of the
stimuli.
Figure 4: The upper panels show the evoked activities in
the auditory (red line) and in the visual (blue line) areas of
the model, respectively, in case of a double auditory
stimulus (two beeps) and in case of a single visual
stimulus (one flash) presented to the network, as depicted
in the lower panels. In the middle panels, the temporal
dynamics of the overall inputs targeting the visual and the
auditory neurons, filtered by a second order differential
equation, are compared with the level of the neurons
activation threshold (black dotted line).
These figures show that unisensory stimulation
does not evoke any cross-modal activity, since the
input targeting neurons of the other modality do not
reach the threshold for activation (which has the
value 16 in our model).
Subsequently, we simulated the conditions leading
to a Sham illusion, by applying two auditory beeps
and a visual flash, as shown in Figure 5.
In this simulation as a result of the external flash,
Figure 5: The evoked activities and inputs dynamics in the
visual (blue line) and in the auditory (red line) areas of the
model, in case of a cross-modal stimulation (a single flash
and two beeps presented to the network, as depicted in the
lower panel) which caused the Shams illusion.
a peak of activity is elicited in the visual area (at
50ms). This is followed by a second activation (at
150ms) that leads to the illusory perception of a
second visual flash.
This second peak is induced by the activity present
in the auditory area, as a result of the second beep,
and transmitted to the visual area by the excitatory
inter-area synapses. As shown by the second panel
of Figure 5, describing the temporal profiles of the
overall inputs reaching the auditory (red lines) and
the visual (blue lines) neurons, the effect of the
second beep on the visual area is to strengthen the
visual excitatory input, and to push the stimulus
targeting the visual neuron over its activation
threshold. This leads to the emergence of the second
peak of activity in the visual area, associated with
the visual illusion.
It is worth noting that the activity in the two
cortical areas (upper panel in Figures 4 and 5)
depend on the input received by the neurons (middle
panels in the same figures) in a complex way: the
input is passed through a sharp sigmoidal
relationship (Eq. 2) and a low pass filter (Eq. 1) to
obtain the activity. Consequently, neural activity
depends both on crossing the threshold of the
sigmoid, and on the time elapsed above threshold.
Finally, we performed a further simulation (Figure
ANeuralNetworkModelofCorticalAuditory-visualInteractions-ANeurocomputationalAnalysisoftheShams-Illusion
641

Figure 6: The evoked activities and inputs dynamics in the
visual (blue line) and in the auditory (red line) areas of the
model, in case of a cross-modal stimulation (a single flash
and two beeps presented to the network, as depicted in the
lower panel B) but without the visual illusion.
6), in which the network was stimulated with the
same pattern of external stimuli, but we used
auditory stimuli slightly weaker.
In this case, the second beep is not able to enhance
the visual input enough to overcome the visual
threshold, and to elicit a sufficient activity to
produce the perceptual visual illusion.
4 CONCLUSIONS
The present results match with the neuroimaging and
psychophysical findings present in literature about
the Shams illusion (Watkins et al., 2006, 2007).
These works have studied this phenomenon by using
the same cross-modal stimulation (one flash, two
beeps), and comparing the evoked potentials in the
visual area in case of perception of the visual
illusion, and in case the illusion was not present
(subjects correctly perceived just one flash). The
interesting finding was that only in the first case the
illusory perception was paired with an increase of
the visual cortex activity, in agreement with the
results in Fig. 5 and 6. In our model the fundamental
point that can lead to the illusory perception is the
ability of the auditory activity to enhance the visual
input over the activation threshold, to drive an
additional peak of activity in the cortex.
Moreover, by comparing these results it is worth
to note that the illusory activity in the visual area is
comparable, in terms of strength and duration, with
the activity evoked by a real visual stimulus. This
result supports the idea this illusion is a perceptual
phenomenon involving the primary visual areas.
The model suggests that the mechanisms
underlying multisensory interactions in early cortical
areas are based on direct excitatory synapses among
these regions, and do not need feedback projections
from higher-order integrative regions.
Furthermore, model ascribes the Shams illusion to
the better temporal resolution of the auditory
processing compared with the visual one. Similarly,
the better spatial resolution of visual processing can
explain the ventriloquism effect (not shown here for
briefness), with the same model structure and the
same parameter values. Future works will be
devoted to analyse if the same neural mechanisms
can explain further auditory-visual interactions too,
such as the fusion effect and the temporal
ventriloquism. Moreover, future model versions may
include a more precise characterization of the time
delays involved in the visual and auditory pathways,
in order to provide an accurate simulation of
electrophysiological data.
REFERENCES
Schroeder, C. E., Foxe, J., 2005. Multisensory
contributions to low-level ‘unisensory’ processing.
Curr. Opin. Neurobiol. 15, 454– 458.
Shams, L., Kamitani, Y., Shimojo, S. 2002. Visual
illusion induced by sound. Cogn. Brain Res. Vol. 14,
pp. 147–152.
Stein, B. E., Meredith, M. A., 1993. The merging of the
senses, The MIT Press. Cambridge MA.
Watkins, S., Shams, L., Tanaka, S., Haynes, J.D., Rees,
G., 2006. Sound alters activity in human V1 in
association with illusory visual perception.
NeuroImage 31, 1247–1256.
Watkins, S., Shams, L., Josephs, O., Rees, G., 2007.
Activity in human V1 follows multisensory
perception. NeuroImage 37, 572–578.
IJCCI2012-InternationalJointConferenceonComputationalIntelligence
642
