
Neutrality through Transcription & Translation
in Genetic Algorithm Representation
Seamus Hill and Colm O’Riordan
Discipline of Information Technology, College of Engineering and Informatics, National University of Ireland Galway,
Galway, Ireland
Keywords:
Genetic Algorithms, Representation, Neutrality, Genotype-phenotype Mapping, Transcription, Translation.
Abstract:
This paper examines the use of the biological concepts of transcription and translation, to introduce neutrality
into the representation of a genetic algorithm (GA). The aim of the paper is to attempt to identify problem
characteristics which may benefit from the inclusion of neutrality, through a basic adaptation of the concepts
of transcription and translation, to create a genotype-phenotype map (GP-map) which introduces phenotypic
variability. Neutrality can be viewed as a situation where a number of different genotypes represent the same
phenotype. A modification of De Jong’s classic test suite was used to compare the performance of a simple
generic algorithm (SGA) and a multi layered mapping genetic algorithm (MMGA), which incorporates the
concepts of transcription and translation into its GP-map. The modified De Jong test suite was chosen as it is
well understood and has been used in numerous comparisons over the years, thus allowing us to contrast the
performance of the MMGA against other GA variations as well as attempting to identify problem character-
istics in isolation. Initial results indicate that the neutrality introduced through the multi-layered mapping can
prove beneficial for problems containing certain characteristics, in particular multidimensional, multimodal,
continuous and deterministic.
1 INTRODUCTION
Genetic Algorithms (GAs) as outlined by (Holland,
1975) are optimisation techniques based on Dar-
winian survival of the fittest. In GAs the genotype
space can be defined using distance metrics based on
an operator (i.e. single bit-flip for binary spaces) to
define a neighbourhood structure over the population
of solutions. The phenotype on the other hand can be
viewed as the final result, or a search space based on
distance metrics between solutions. The neighbour-
hood structure contained within this space may bear
little relationship to the neighbourhood found in the
genotype space and is directly related to the complex-
ity of the mapping from the representation to the so-
lution (Eiben and Smith, 2003). The multi-layered
mapping GA (MMGA), builds upon this and intro-
duces complexity into the mapping between the geno-
type and phenotype through a simplified adaptation of
the biological processes of transcription and transla-
tion. The motivation for using a multi-layered GA,
is to further investigate possible advantages in using
a fixed non-trivial GP-map, which introduces a more
flexible phenotypic structure and a higher degree of
phenotypic variability through the use of neutrality
(Hill and O’Riordan, 2011). In order to achieve this
we have chosen a modified version of De Jong’s test
suite (De Jong, 1975), as it was originally designed
to examine the performance of algorithms over var-
ious characteristics, measured in isolation and com-
monly found in many problem domains. The contri-
bution of this paper is to obtain a better understanding
of how the inclusion of neutrality associated with the
complexity of the mapping, which develops a more
flexible phenotypic structure, impacts on the algo-
rithms search capabilities for each of the character-
istics, viewed in isolation. The aim is to build on pre-
vious research and identify which characteristics may
be most likely to benefit from the inclusion of neu-
trality and developing a better understanding of the
types of problems where increased phenotypic vari-
ability may be advantageous.
The paper is laid out as follows; Section 2 intro-
duces related work, Section 3 outlines the adaptation
of the biological processes of transcription and trans-
lation. Section 4 describes the test suite chosen. With
Section 5 outlining the experiments and Section 6 the
conclusion.
220
Hill S. and O’Riordan C..
Neutrality through Transcription & Translation in Genetic Algorithm Representation.
DOI: 10.5220/0004156702200225
In Proceedings of the 4th International Joint Conference on Computational Intelligence (ECTA-2012), pages 220-225
ISBN: 978-989-8565-33-4
Copyright
c
2012 SCITEPRESS (Science and Technology Publications, Lda.)

2 RELATED WORK
Neutrality can be defined as a situation where fol-
lowing a mutation one genotype changes to another
genotype, but both genotypes represent the same phe-
notype (Kimura, 1968). This implies that as neutral-
ity is introduced, the solution space increases with-
out increasing the genotype space. Neutral represen-
tations have appeared in a number of genetic algo-
rithms (GAs) over the past number of years. As a gen-
eral rule, the introduction of neutrality into GAs can
be divided into two categories, fitness landscapes and
the focus of this paper,genotype-phenotypemappings
(GP-map). Shipman (Shipman, 1999) found neutral-
ity to be advantageous where neutral networks, intro-
duced by Harvey and Thompson (Harveyand Thomp-
son, 1996) - meaning points in a search space of equal
fitness, are distributed over the search space with a
high degree of connectivity between them.
Shakelton (Shackleton et al., 2000) and Shipman
(Shipman et al., 2000) showed that neutrality could be
introduced through the use of GP-maps. They used
five different mappings to illustrate this, static ran-
dom mapping, trivial voting mapping, standard vot-
ing mappings, cellular automata mapping and a ran-
dom Boolean network (RBN). The results obtained in-
dicated that the amount of redundancy present was
significant in relation to evolution. This approach of
using mappings was extended by Ebner et al. (Ebner
et al., 2001), who took two of the mappings, cellu-
lar automata and RBN with what they referred to as
phenotype-species mapping. They outlined how high
levels of mutation could be sustained by having neu-
tral networks present. They also identified that neutral
networks assist in maintaining diversityin the popula-
tion, which may be advantageous in a changing envi-
ronment. Similar conclusions were obtained in (Hill
and O’Riordan, 2010) where the MMGA was applied
to changing environments. Neutrality has also been
introduced through the use of an adaptation of a trans-
lation table (Ashlock et al., 2011).
3 MULTI-LAYERED MAPPING
GENETIC ALGORITHMS
(MMGA)
The primary inspiration for the MMGA comes from
the biological idea of transcription and translation.
At a very basic level, the biological process of tran-
scription involves the copying of information stored
in DNA into an RNA molecule, which is comple-
mentary to one strand of the DNA. The process of
translation then converts the RNA, using a predefined
translation table, to manufacture proteins by joining
amino acids. These proteins can be viewed as a
manifestation of the genetic code contained within
DNA and act as organic catalysts in anatomy. The
MMGA includes a multi-layered genotype-phenotype
map which adopts a basic interpretation of the tran-
scription and translation processes. The genotype of
the MMGA representation is represented as a binary
string which allows for the use of standard operators.
The genotypeis then convertedinto a string of charac-
ters from the alphabet A, C, G,and T (which attempts
to represent the template strand), with “00” represent-
ing A, “01” representing C, “10” representing G and
“11” representing T. The mapping moves onto the
next layer which creates a coding strand from the tem-
plate strand using the four letter alphabet A, C, G, U
(see Table 1). This final phase of the transcription
stage creates the RNA sequence which is complemen-
tary to that of the DNA template strand and therefore
is the same sequence as the DNA coding strand, with
U in place of T. Following the transcription stage,
Table 1: Transcription Stage consisting of Template Map,
Coding Map & RNA Map.
Transcription Stage
Template Strand Map Coding Strand Map RNA Map
00 → A A → T T → U
01 → C C → G G → G
10 → G G → C C → C
11 → T T → A A → A
the translation stage compares the RNA sequence to a
translation table which is generated at initialisation to
create a mapping from the RNA sequence into a series
of phenes which are then combined to create the phe-
notype. A neighbourhood equivalence examination is
used by the MMGA to create a phene. In this pa-
per we use two phenes, “0” and “1”, with each phene
being represented by a combination of four charac-
ters from the alphabet A, C, G, U (see Tables 2 and 3).
The outcome of this interpretation of transcription and
translation introducesa level of neutrality into the GP-
map.
4 TEST SUITE
The DeJong (De Jong, 1975) test suite was created as
a test environment containing five minimising prob-
lems. The functions were chosen by De Jong because
they represented many common difficulties found in
optimisation problems.
NeutralitythroughTranscription&TranslationinGeneticAlgorithmRepresentation
221
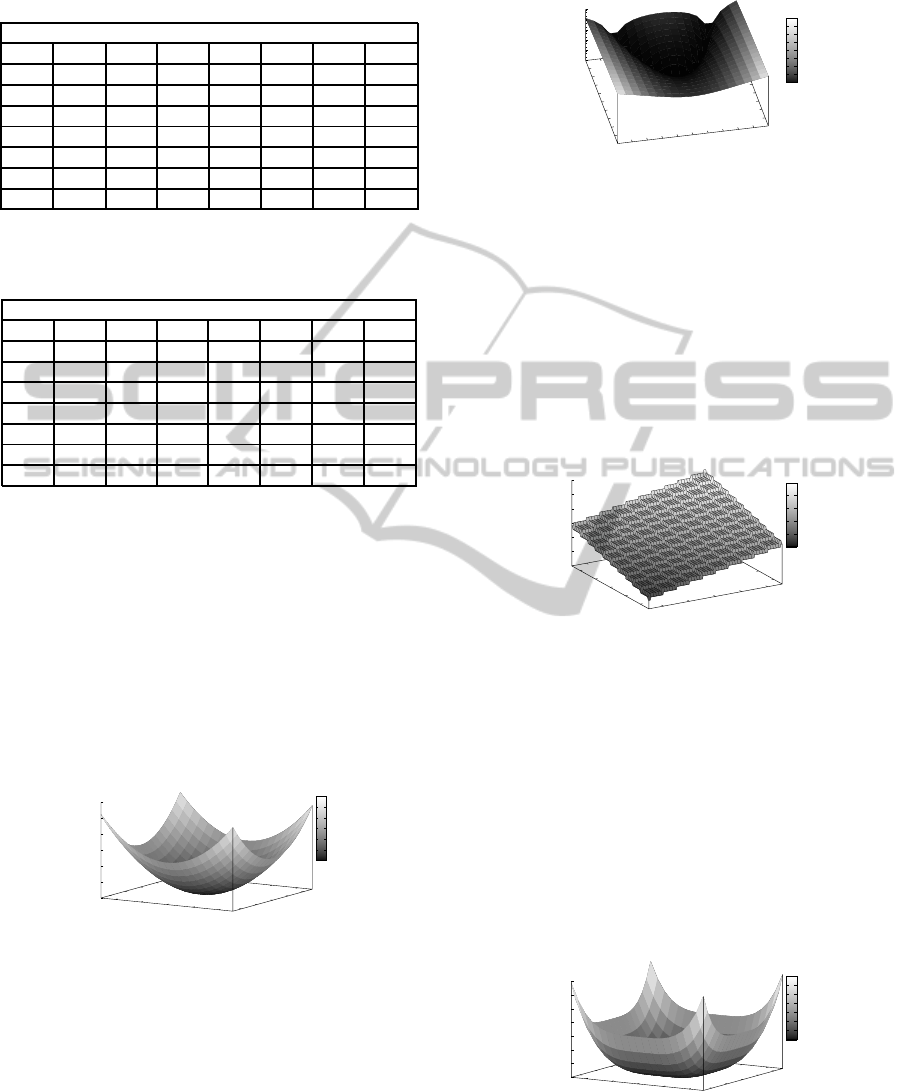
Table 2: Extract of Translation Table for the combining of
amino acids to create Phene 0.
Extract of Translation Table for Creating Phene ‘0’
AAAA AAAG AACA AACG AAGA AAGG AAUA AAUG
ACAA ACAG ACCA ACCG ACGA ACGG ACUA ACUG
AGAA AGAG AGCA AGCG AGGA AGGG AGUA AGUG
AUAA AUAG AUCA AUCG AUGA AUGG AUUA AUUG
CAAA CAAG CACA CACG CAGA CAGG CAUA CAUG
CCAA CCAG CCCA CCCG CCGA CCGG CCUA CCUG
CGAA CGAG CGCA CGCG CGGA CGGG CGUA CGUG
CUAA CUAG CUCA CUCG CUGA CUGG CUUA CUUG
Table 3: Extract of Translation Table for the combining of
amino acids to create Phene 1.
Extract of Translation Table for Creating Phene ‘1’
AAAC AAAU AACC AACU AAGC AAGU AAUC AAUU
ACAC ACAU ACCC ACCU ACGC ACGU ACUC ACUU
AGAC AGAU AGCC AGCU AGGC AGGU AGUC AGUU
AUAC AUAU AUCC AUCU AUGC AUGU AUUC AUUU
CAAC CAAU CACC CACU CAGC CAGU CAUC CAUU
CCAC CCAU CCCC CCCU CCGC CCGU CCUC CCUU
CGAC CGAU CGCC CGCU CGGC CGGU CGUC CGUU
CUAC CUAU CUCC CUCU CUGC CUGU CUUC CUUU
4.1 The Sphere Function
The first function (f
1
) is relatively easy to optimise as
it is smooth, convex and unimodal. This function is
normally used to measure the efficiency of a particu-
lar algorithm. A graphical representation of the gen-
eralised Sphere function is shown in Figure 1 and the
function has the following definition: f
1
=
∑
2
i=1
x
2
i
,
where −5.12 ≤ x
i
≤ 5.12.
Sphere Model
-4
-2
0
2
4
-4
-2
0
2
4
0
10
20
30
40
50
60
0
10
20
30
40
50
60
Figure 1: The Sphere Model.
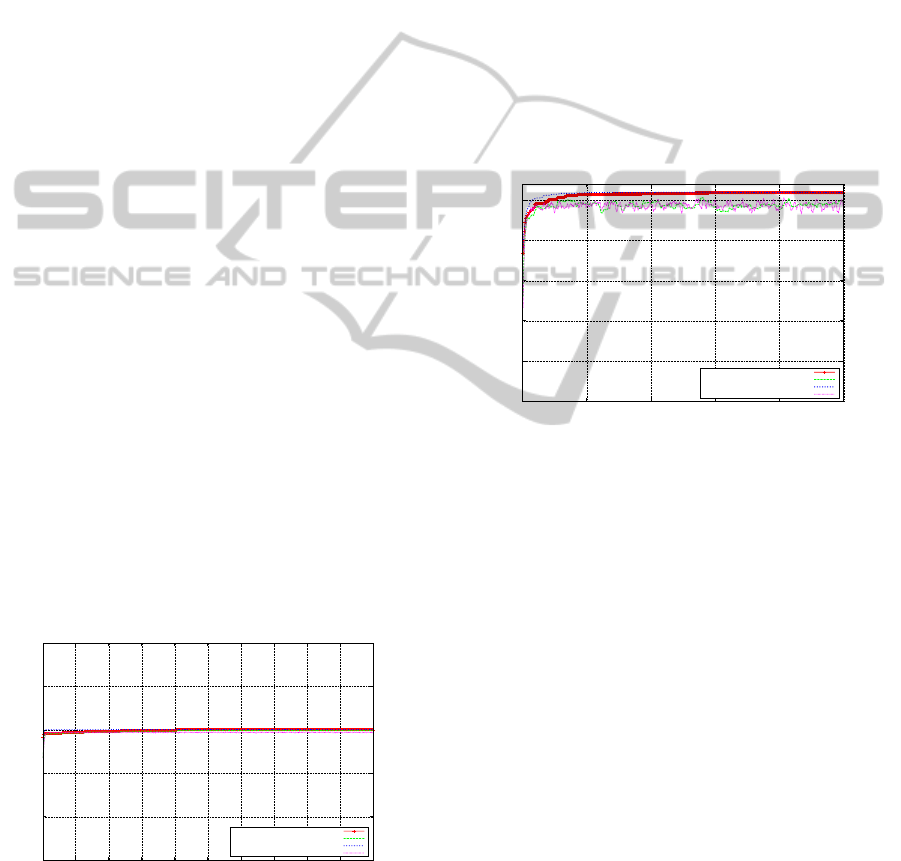
4.2 Rosenbrock’s Function
The second function (f
2
), Rosenbrock’s function, is
a frequently used optimisation problem. It is a two-
dimensional function containing a deep valley, shaped
like a parabola. Figure 2, illustrates Rosenbrock’s
function and the function has the following definition:
f
2
= 100(x
2
1
− x
2
)
2
+ (1− x
1
)
2
, where −2.048 ≤ x
i
≤
2.048.
Rosenbrock Function
-2
-1.5
-1
-0.5
0
0.5
1
1.5
2
-2
-1.5
-1
-0.5
0
0.5
1
1.5
2
0.1
1
10
100
1000
10000
0
1000
2000
3000
4000
5000
6000
7000
8000
Figure 2: Rosenbrock’s Function.
4.3 The Step Function
The third function (f
3
), the Step function, represents
problems with flat surfaces, which prove difficult for
many algorithms as they don’t provide information as
to the most advantageous direction. Figure 3 shows
a plot for the Step function. The Step function has
the following definition:f
3
=
∑
5
i=1
floor(x
i
), where
−5.12 ≤ x
i
≤ 5.12.
-4
-2
0
2
4
-4
-2
0
2
4
-15
-10
-5
0
5
10
15
Step Function
-15
-10
-5
0
5
10
Figure 3: Step Function.
4.4 Quadratic Function with Noise
The fourth function (f
4
) is a quadratic function which
includes gaussian noise. For these experiments we are
using a 30-dimensional function which contains noise
to ensure that points return a different value each time
they are evaluated. The plot for the Quadratic func-
tion without noise is illustrated in Figure 4. The
Quadratic function with noise is defined as follows:
f
4
=
∑
30
i=1
(ix
4
i
+ Gauss(0, 1)), where −1.28 ≤ x
i
1.28
Quadratic Function
-4
-2
0
2
4
-4
-2
0
2
4
0
200
400
600
800
1000
1200
1400
0
200
400
600
800
1000
1200
1400
Figure 4: Quadratic Function.
IJCCI2012-InternationalJointConferenceonComputationalIntelligence
222
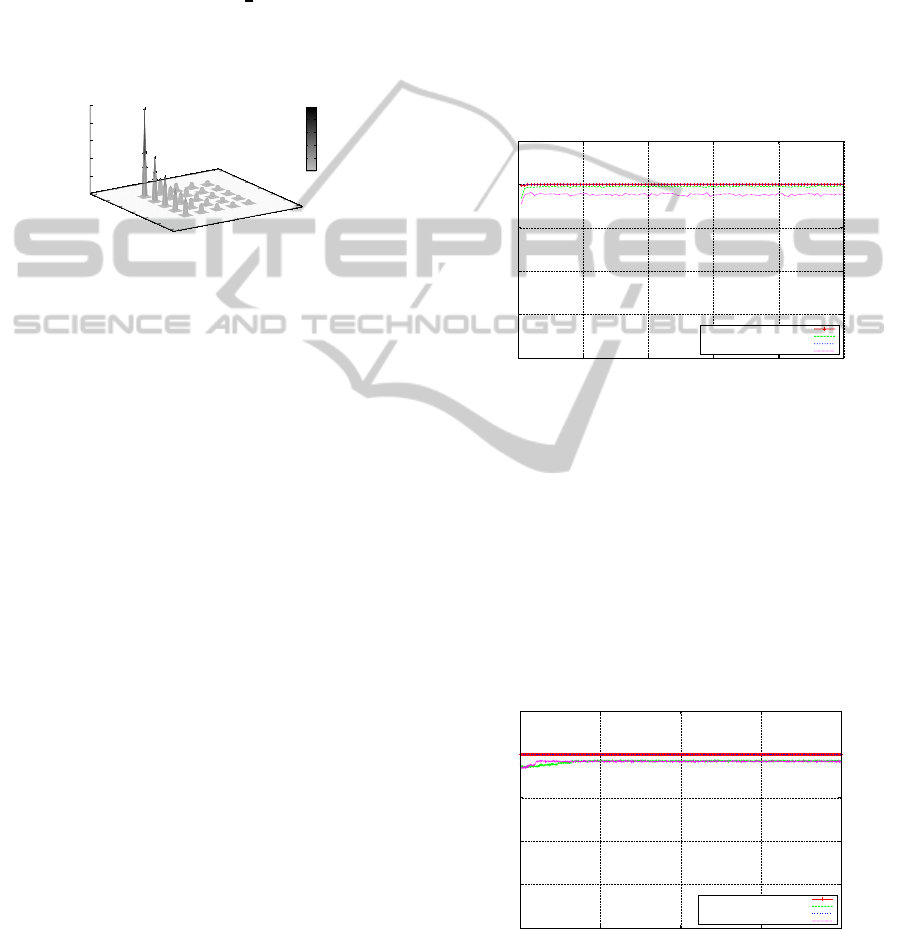
4.5 Shekel’s Foxhole Function
The fifth and final function (f
5
), Sheckel’s Foxhole,
contains many local optima. This 2-dimensional
function contains 25 different foxholes, each vary-
ing in depth, surrounded by relatively flat surfaces.
Shekel’s Foxhole function has the following defi-
nition: f
5
(x
i
) = 0.002+
∑
25
j=1
1
j
+
∑
2
i=1
(x
i
− a
ij
)
6
,
where −65.536 ≤ x
i
≤ 65.536
Inverted Shekel’s Foxhole
-60
-40
-20
0
20
40
60
-60
-40
-20
0
20
40
60
0
0.2
0.4
0.6
0.8
1
0
0.2
0.4
0.6
0.8
1
Figure 5: Shekel’s Foxholes.
5 EXPERIMENT RESULTS
The results of the experiments conducted in this pa-
per are each averaged over 50 runs. We have taken
De Jong’s test suite which was originally designed as
a minimising problem and changed them to maximis-
ing problems. The results outline both the on-line per-
formance, that is the measure of the average fitness of
all members of the population, and the off-line per-
formance, that is maximum fitness of the population.
The parameters used for the experiments are as fol-
lows; Crossover rate 0.70, Mutation rate 0.001, Pop-
ulation size 200. The number of generations varied
for each set of experiments and are as follows; the
Sphere Model ran for 100 generations, Rosenbrock’s
function for 2000 generations, the Step function for
500 generations, the Quadratic function with noise for
500 generations and finally Shekel’s function for 500
generations.
5.1 The Sphere Model
The results of the Sphere model experiments are
shown in Figure 6, which illustrates the findings for
both the SGA and the MMGA, showing the off-line
performance and on-line performance for each gener-
ation. The problem is three dimensional and the opti-
mum is achieved where x
1
= 0, x
2
= 0 and x
3
= 0.
In the experiments conducted, both the SGA and
the MMGA locate the global optimum (i.e. f
x
=
(0), x(i) = 0, i = 1 : n, where n = 3) very quickly.
Both the off-line and the on-line performance for the
SGA are very similar, indicating that with the SGA, as
the population converges towards the fittest individ-
ual the average is also converging towards the fittest
level. The MMGA’s off-line performance is similar to
that of the SGA, however its on-line performance falls
short of that of the SGA, due to the level of neutral-
ity present in the MMGA’s representation. Although
not visible in the figures, the earliest on average lo-
cation of the optimum for the SGA is during gener-
ation 83, while the global optimum for the MMGA
is located much sooner,on average during generation
25. Overall, the differences between the SGA and
MMGA over this problem are negligible.
0
20
40
60
80
100
0 20 40 60 80 100
Fitness
Generations
The Sphere Model Performance Analysis - SGA & MMGA
Off-line Performance SGA
On-line Performance SGA
Off-line Performance MMGA
On-line Performance MMGA
Figure 6: The Sphere Model - SGA & MMGA.
5.2 Rosenbrock’s Function
The second set of experiments were carried out over
Rosenbrock’s function, with the intention of testing
the performance of the algorithms in dealing with
the repeatedly changing direction of the search. The
global optimum for this two dimensional problems is
where x
1
= 1 and x
2
= 1 (or when f(x) = 0, x(i) =
1, i− 1 : n, where n = 2). Figure 7 illustrates the per-
formance of both GAs. The global optimum is lo-
0
1000
2000
3000
4000
5000
0 500 1000 1500 2000
Fitness
Generations
Rosenrbock’s Function Performance Analysis - SGA & MMGA
Off-line Performance SGA
On-line Performance SGA
Off-line Performance MMGA
On-line Performance MMGA
Figure 7: Rosenbrock’s Saddle - SGA & MMGA
cated by the SGA, on average over the 50 runs, at
generation 249 as the ridge is relatively easy to locate.
The difficulty associated with this function lies in its
NeutralitythroughTranscription&TranslationinGeneticAlgorithmRepresentation
223
ability to converge. The on-line performance of the
population indicates the level of convergence. As was
the case with the Sphere Model experiments, the off-
line and on-line performance moves closer together
to as the search progresses. Looking at the off-line
performance of the MMGA, it has located the global
optimum quite quickly (on average during generation
99). This compares favourably with the SGA, indi-
cating far fewer function evaluations for the MMGA
in locating the optimum. Although both the on-line
and off-line performances are close, it is interesting to
note that the on-line performances appear quite sim-
ilar for both the SGA and the MMGA. One possible
reason for this is that due to the nature of the search
space, convergence is not as easy to obtain as was the
case with the Sphere function, and both the SGA and
the MMGA experience similar difficulties. Overall,
the off-line and on-line performance for both the SGA
and the MMGA are relatively similar over this space.
5.3 Step Function
This function highlights an algorithms ability not to
get trapped on a plateau of local optima. From Fig-
ure 8 we see that the SGA performs well and discov-
ers the global optimum (with a fitness level of 30) on
average at generation 203, indicating the SGA’s off-
line performance over the space. Also both the off-
line and on-line performances for the SGA are almost
identical at an early stage in the search. However,
the MMGA discovers the global optimum, on aver-
age, during generation 4, which is a significant im-
provement over the off-line performance of the SGA.
With regard to the on-line performance, there is little
difference between both algorithms over this problem
domain.
0
10
20
30
40
50
50 100 150 200 250 300 350 400 450 500
Fitness
Generations
Step Function Performance Analysis - SGA & MMGA
Off-line Performance SGA
On-line Performance SGA
Off-line Performance MMGA
On-line Performance MMGA
Figure 8: Step Function - SGA & MMGA.
5.4 Quadratic Function with Noise
The quadratic function with noise was designed to al-
low the evaluation of the performance of an algorithm
over a landscape which is continuously altering due
to the presence of noise. The results of the experi-
ments are shown in Figure 9. The SGA’s best off-line
performance occurs on average at generation 492, il-
lustrating the difficulty associated with noise in the
search space. Also when we view the on-line perfor-
mance we can see that it varies per generation again
due to the presence of noise. The performances both
off-line and on-line for the MMGA look quite simi-
lar to that of the SGA, with the best off-line perfor-
mance for the MMGA occurred on average at gener-
ation 440. However, the MMGA recorded a higher
off-line performance, which may indicate that in the
presence of noise, there may be a benefit associated
with the inclusion of the type of neutrality introduced
by the MMGA.
1000
1050
1100
1150
1200
1250
0 100 200 300 400 500
Fitness
Generations
Quadratic Function with Noise Performance Analysis - SGA & MMGA
Off-line Performance SGA
On-line Performance SGA
Off-line Performance MMGA
On-line Performance MMGA
Figure 9: Quadratic Function with Noise - SGA & MMGA.
5.5 Shekel’s Foxhole’s Function
The final set of experiments compare both algorithms
over Shekel’s Foxhole’s function, with the results il-
lustrated in Figure 10. Although both the SGA and the
MMGA solved the problem, what is interesting is the
way in which they achieved this. The SGA locates the
global optimum, on average, during generation 266.
The MMGA, on the other hand, locates the global
optimum on average at approximately generation 50.
The results indicate that there is a significant improve-
ment in performance over the multi-modal landscape
of Shekel’s Foxholes by including an element of neu-
trality into the representation. One possible reason for
this could be that the neutrality introduced through the
multi-layered mapping, reduces the impact of opera-
tors such as mutation and crossover and proves ben-
eficial in avoiding getting stuck in a local optima as
the search progresses. By partially insulating from
the effect of the operators the translation table as-
sists in maintaining a level of knowledge of the do-
main developed as the search progresses. Overall, the
MMGA has both a better off-line and on-line perfor-
mance over the SGA for the type of search space pro-
IJCCI2012-InternationalJointConferenceonComputationalIntelligence
224
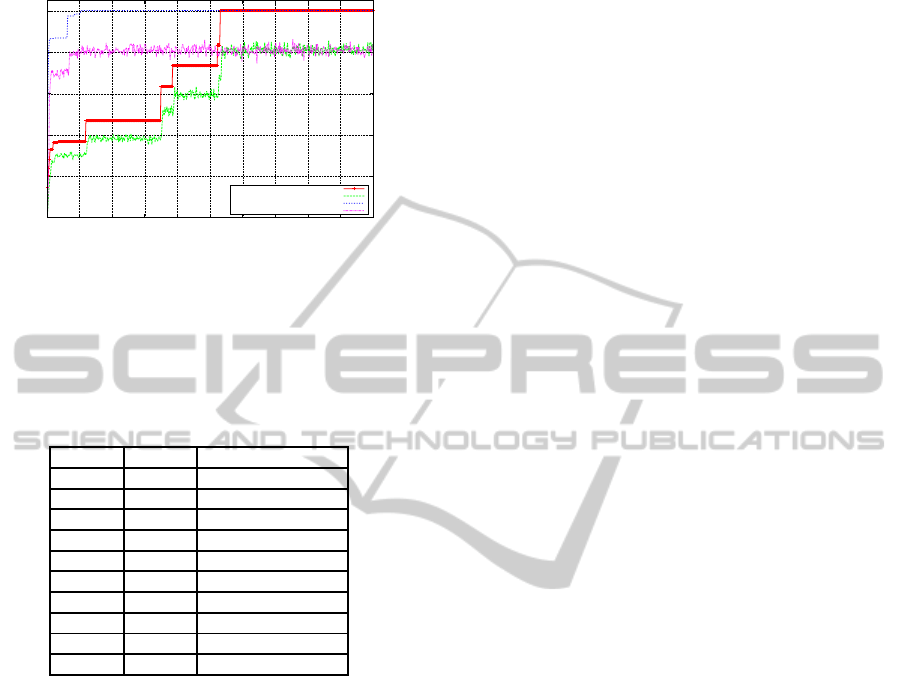
duced by Shekel’s function.
0
0.2
0.4
0.6
0.8
1
50 100 150 200 250 300 350 400 450 500
Fitness
Generations
Shekle’s Foxholes Performance Analysis - SGA & MMGA
Off-line Performance SGA
On-line Performance SGA
Off-line Performance MMGA
On-line Performance MMGA
Figure 10: Shekel’s Foxholes - SGA & MMGA.
5.6 Statistical Results
A Wilcoxon rank sum test was used to test for statis-
tically significant between the SGA and MMGA and
the results are outlined in Table 4.
Table 4: Wilcoxon Ranksum Test Results.
Function Results Statistical Significance
f
1
Off-Line Highly Significant
f
1
On-Line Highly Significant
f
2
Off-Line Highly Significant
f
2
On-Line Highly Significant
f
3
Off-Line Highly Significant
f
3
On-Line Highly Significant
f
4
Off-Line Highly Significant
f
4
On-Line Not Significant
f
5
Off-Line Highly Significant
f
5
On-Line Highly Significant
6 CONCLUSIONS
Overall the experiments conducted show that for
the characteristics present in the Sphere function,
the Rosenbrock function, the Step function and the
Quadratic function, the benefit of neutrality is not ap-
parent at first sight and for many it is negligible. How-
ever, this is not the case for the Sheckel’s Foxholes
experiments, where the introduction of neutrality into
the GP-map has been shown to be beneficial. By in-
cluding an adaptation of the biological concepts of
transcription and translation into a GA to introduce
neutrality into the GP-map, the results of the exper-
iments over the modified De Jong test suite, indicate
classes of problemswhich could possibly benefit from
the inclusion of a multi-layered GP-map. The results
appear to suggest that the problems most likely to
benefit would contain a combination of characteris-
tics such as, low-dimensionality,multi-modality, non-
separable, continuous and deterministic.
ACKNOWLEDGEMENTS
The authors would like to acknowledge the support of
NUI Galway’s Millennium Fund.
REFERENCES
Ashlock, D., Schonfeld, J., and McNicholas, P. D. (2011).
Translation tables: A genetic code in a evolutionary
algorithm. In IEEE Congress on Evolutionary Com-
putation, pages 2685–2692.
De Jong, K. A. (1975). An analysis of the behavior of a
class of genetic adaptive systems. PhD thesis, Univer-
sity of Michigan, Ann Arbor. Dissertation Abstracts
International 36(10), 5140B; UMI 76-9381.
Ebner, M., Shackleton, M., and Shipman, R. (2001). How
neutral networks influence evolvability. Complex.,
7(2):19–33.
Eiben, A. E. and Smith, J. E. (2003). Introduction to Evolu-
tionary Computing. Springer.
Harvey, I. and Thompson, A. (1996). Through the labyrinth
evolution finds a way: A silicon ridge. In Proceed-
ings of the First International Conference on Evolv-
able Systems: From Biology to Hardware, volume
1259, pages 406–422. Springer Verlag.
Hill, S. and O’Riordan, C. (2010). Solving fully deceptive
problems in changing environments. In Artificial In-
telligence Cognative Studies (AICS), pages 87–95.
Hill, S. and O’Riordan, C. (2011). Examining the use of a
non-trivial fixed genotype-phenotype mapping in ge-
netic algorithms to induce phenotypic variability over
deceptive uncertain landscapes. In Proceedings of the
2011 Congress of Evolutionary Computation (CEC
2011). New Orleans, USA.
Holland, J. H. (1975). Adaptation in natural artificial sys-
tems. University of Michigan Press, Ann Arbor.
Kimura, M. (1968). Evolutionary Rate at the Molecular
Level. Nature, 217(1):624–626.
Shackleton, M. A., Shipman, R., and Ebner, M. (2000). An
investigation of redundant genotype-phenotype map-
pings and their role in evolutionary search. In Pro-
ceedings of the International Congress on Evolution-
ary Computation (CEC 2000), pages 493–500. IEEE
Press.
Shipman, R. (1999). Genetic Redundancy: Desirable or
Problematic for Evolutionary Adaption. In Dobnikar,
A., Steele, N., Pearson, D. W., and Albrecht, R. F., ed-
itors, Proceedings of the 4th international Conference
on Artificial Neural Networks and Genetic Algorithms
(ICANNGA ’99), pages 337–344, Berlin. Springer.
Shipman, R., Shackleton, M., and Harvey, I. (2000). The
use of neutral genotype-phenotype mappings for im-
proved evolutionary search. BT Technology Journal,
18:103–111.
NeutralitythroughTranscription&TranslationinGeneticAlgorithmRepresentation
225
