
Pherogenic Drawings
Generating Colored 2-dimensional Abstract Representations of Sleep EEG with the
KANTS Algorithm
Carlos M. Fernandes, Antonio Mora and Juan Julián Merelo
Department of Computer Architecture and Technology, University of Granada, Granada, Spain
Agostinho C. Rosa
Department of Electrotechnics, Technical University of Lisbon, Lisbon, Portugal
Keywords: Swarm Art, Generative Art, Ant Algorithms, Stigmergy, Pherogenic Drawings.
Abstract: Social insects and stigmergy have been inspiring several significant artworks and artistic concepts that
question the borders and nature of creativity. Such artworks, which are usually based on emergent properties
of autonomous systems and go beyond a centralized human authorship, are a part of a contemporary trend
known as generative art. This paper addresses generative art and presents a set of images generated by an
ant-based clustering algorithm that uses data samples as artificial ants. These ants interact via the
environment and generate abstract paintings. The algorithm, called KANTS, consists in a simple set of
equations that model the local behavior of the ants (data samples) in a way that, when travelling on a
heterogeneous 2-dimensional lattice of vectors, they tend to form clusters according to the class of each
sample. The algorithm was previously proposed for clustering and classification. In this paper, KANTS is
used outside a purely scientific framework and it is applied to data extracted from sleep-
Electroencephalogram (EEG) signals. With such data sets, the lattice vectors have three variables, which are
used for generating the RGB values of a colored image. Therefore, from the actions of the swarm on the
environment, we get 2-dimensional colored abstract sketches of human sleep. We call these images
pherogenic drawings, since the data used for creating the images are actually the pheromone maps of the ant
algorithm. As a creative tool, the method is contextualized within the swarm art field.
1 INTRODUCTION
Generative art is a contemporary trend that uses
autonomous systems for generating artworks or
ornamental objects. There may be more or less
human interaction with the process, but, in general,
the core of a generative artwork is the result of a
computational and sometimes emergent procedure.
Swarm Intelligence (SI) (Bonabeau et al., 1999) is
one of the techniques used in this field, whether as
computational simulations for creating digital art
that can be later translated to a physical medium, or
as guiding rules for groups of agents (robots, for
instance) that act directly (i.e., physically) on a
canvas. Within SI, social insects and the concept of
stigmergy have inspired significant artworks that
question the borders and nature of creativity. This
paper focuses on a digital approach and describes a
SI algorithm called KohonAnts (or simply KANTS),
used here for generating 2-dimensional non-
figurative images of correlated data sets of human
sleep.
KANTS is an ant-based algorithm proposed by
Mora et al. (2008) for data clustering and
classification. The method is loosely inspired by
Chialvo and Millonas’ Ant System (AS) (Chialvo
and Millonas, 1995), which is modeled by a set
equations and parameters that, when properly tuned,
guide the swarm to a self-organized state in which
complex patterns of global behavior emerge. Instead
of the 2-dimensional homogeneous lattice used in
(Chialvo and Milonas, 1995) as a habitat for the
swarm, KANTS evolve on a 2-dimensional lattice
with one vector of real-valued variables mapped to
each cell. The agents also differ from Chialvo and
72
M. Fernandes C., Mora A., Merelo J. and C. Rosa A..
Pherogenic Drawings - Generating Colored 2-dimensional Abstract Representations of Sleep EEG with the KANTS Algorithm.
DOI: 10.5220/0004158800720080
In Proceedings of the 4th International Joint Conference on Computational Intelligence (ECTA-2012), pages 72-80
ISBN: 978-989-8565-33-4
Copyright
c
2012 SCITEPRESS (Science and Technology Publications, Lda.)

Millonas model, since KANTS uses data samples
(with the same size as the environmental vectors) of
different classes as artificial ants. These ants travel
trough the grid, changing the values of the variables
so that they tend to be closer to their own values. At
the same time, the ants are attracted to the sections
of the habitat where the Euclidean distance between
the ant’s vector and the sections’ vectors is
minimized, i.e, the ants communicate via the
environment, an ability that is a fundamental part of
a process known as stigmergy (Grassé, 1959):
communication via the environment, with
modification of that same environment. The model’s
simple set of rules leads to a global behavior in
which clusters of ants/samples belonging to the same
class tend to emerge.
As stated above, the ants act upon the
environmental lattice, changing the vectors’ values.
Therefore, this array of vectors acts as a kind of
pheromone map that is shaped by the ants. The maps
are used in this paper for generating 2-dimensional
RGB colored images. The vectors’ values are
directly translated into the R, G, and B values (three-
variable sleep data set with is used here). Since the
ants tend to cluster, thus changing the values in that
region, it is expected that the pheromone map, after
a certain number of iterations, shows non-random
patterns, like a kind of a fuzzy patchwork. In
addition, the stochastic nature of the process and the
size and range of the data samples, make these sleep
signatures unique, not only for each patient, but also
for each night’s sleep. We believe that these
pherogenic drawings not only represent an
interesting imagery related to human sleep, but
could also be a basis for a conceptual framework for
artists and scientists to work with.
The paper is organized as follows. Section 2
discusses generative art and swarm art. Section 3
describes the KANTS algorithm used for generating
the EEG sleep images. In Section 4 the signals and
the sleep staging problem is introduced. Section 5
shows the images generated by the algorithm with a
set of sleep data recorded from sane adults. Finally,
Section 6 concludes the paper and outlines future
lines of work.
2 SWARM ART
Generative art is a term used to classify artistic
creations that, with more or less human intervention,
are mainly generated by artificial intelligence
systems or other computational models. There is an
enormous amount of work in the area, and
generative art is even gradually dividing itself into
subfields, such as artificial music, and evolutionary
art. From the large number of work created in the
last decades, we will describe just a few, more
related to the pherogenic drawings, technically or
metaphorically.
Like KANTS, Leonel Moura’s swarm paintings
(Moura, 2001) are also based on Chialvo and
Millona’s swarm model. The author started by
experimenting on-screen computer drawings, using
the ant system described in (Chialvo and Millonas,
1995). However, the results were disappointing until
he used a CAD machine and a brush to create
physical objects. Since then, Moura has been
experimenting with swarms, self-organization and
robotics (Moura, 2009).
Like Moura, Monmarché et al. (2007) also use
ants for their research on the potentialities of swarms
as “non-human artists”. The authors discuss the ant
paradigm as a tool for generating music and
painting.
Using a common terminology in the History of
Art, Moura and Monmarché’s swarm paintings may
be categorized as abstract, while the proposal by
Collomosse (2007), for instance, which uses
Evolutionary Computation to evolve aesthetically
appealing techniques for photo rendering, is more
related to figurative art. Semet et al. (2004) also
investigated the automatic generation of rendering.
The authors propose a method for non-photorealistic
rendering based on artificial ants. The ants move and
sense the environment (image) and deposit “ink” on
an output image, according to their location and the
state of a short term memory. The user interacts with
the ant colony, by choosing the parameters, defining
“importance maps” and deciding when the rendering
is finished.
In 2001, Ramos and Almeida (2001) proposed a
modification of the Chialvo and Millonas ant
systems in which the ants evolve on a grayscale
image (i.e., the 2-dimensional lattice stores the
pixels’ values of the picture) and detect the edges of
that image, generating pheromone maps that are
sketches of the environmental grayscale images.
Later, Fernandes et al. (2005) described an
evolutionary extension to the model that radically
changes the aspect of the pheromone maps. In 2010,
Fernandes (2010) proposed the term pherographia
(meaning drawing with pheromones) as a
designation for the resulting pheromone maps of the
system, and projected a line of creative work based
on pherographia that resulted in several artworks.
These artworks have been exhibited to an
heterogeneous audience — see (Moura, 2009) and
PherogenicDrawings-GeneratingColored2-dimensionalAbstractRepresentationsofSleepEEGwiththeKANTS
Algorithm
73

(Courchesne et al., 2009). In a sense, the pherogenic
drawings described in this paper are also
pherographs, since KANTS comes from the same
base-system, and the images are actually the
pheromone maps of the algorithm. However, we use
here the term pherogenic drawings in order to
differentiate from the images in (Ramos &Almeida,
2001) and (Fernandes et al., 2005), which are closely
related to photographia, the inspiration of the term
pherographia.
In fact, pherographia, as used by Fernandes,
results in typical figurative artworks, while the
swarm paintings presented in this paper are purely
abstract. The pherographs are created using a
photograph as a base-image; KANTS uses correlatd
data, which interacts in a heterogeneous
environment, “shaping” that same environment. Of
course, pherographia, since it imitates the base-
image, may also be used for creating non-figurative
works, as long as such kind of image is chosen as a
base-image. That is, pherographia relies much more
on the human decision, while the results given by
KANTS, as shown in Section 5, are more
unpredictable, since they depend on large quantities
of data, gathered from natural phenomena.
Pherographia and the above referred works do
not rely on an explicit objective function to guide the
exploration of the environment, but other approaches
require a fitness functions that must be optimized.
These approaches, usually termed as evolutionary
art, may be divided in two classes: automated and
interactive evolutionary art. Interactive evolutionary
art is based on interactive Evolutionary Algorithms
(EA) (Takagi, 2001). Interactive EAs use human
evaluation for determining the quality of the
solutions described by the population: i.e., one or
more humans evaluate the solution and provide the
algorithm with some measure of quality of the
individual or guide the search by interacting with the
reproduction process (human-guided EAs).
Interactive evolutionary art is based on
interactive and human-guided EAs. Karl Sims
(1991), for instance, used a human-guided EA for
generating 2-dimensional abstract forms. Sims has
an extensive body-of-work on artificial and
evolutionary art that has been exhibited in art
galleries and art festivals. Another important author
in this field is William Latham. Like Sims, he used
evolutionary algorithms and computer graphics in
the early 1990s to generate digital images (Todd and
Latham, 1992). Since then, several researchers and
artists have been working on interactive
evolutionary art, which has also been used in
combination with swarm art.
Aupetit et al. (2003), for instance, use an
interactive EA for evolving the parameters of a
swarm of artificial ants that interacts with the
environment (canvas). Each ant competes with the
other ants for color placement. Given a set of
parameters, the ants are able to draw complex
images, and they can even paint for several hours,
giving a different painting in each moment. The
sensory mechanism of the ants in (Aupetit et al.,
2003) was modeled in such a way that they are
responsive only to the luminance values of the
colors.
Greenfield (2005) follows a different approach
and uses ants that are responsive to tristimulus color
values. Furthermore, he uses a non-interactive EA
by designing fitness functions for evolving ant
behavior. Later, the author increased the complexity
of his model and designed ants that are responsive to
both environmental stimulus and other ants’ direct
stimulus, thus increasing the role of stigmergy in the
model (Greenfield, 2006).
These are just a few examples of swarm and
evolutionary art, more related to the work described
in this paper. There are many variants of generative
art and other authors have been providing interesting
compilations and state-of-the art reviews. Romero
and Machado (2007), for instance, edited a book on
evolutionary and artificial art that gathers some of
the most relevant proposals in the field. Lewis
(2007) gives an exhaustive review on the state of the
art, not only on interactive and human-guided
evolutionary art, but also on other types of artificial
art. In this paper, we aim at contributing to a
motivating field that blends art and science by using
the KANTS clustering algorithm as a swarm-art
creative tool. For that purpose, we use a simplified
version of the algorithm that is described in the
following section.
3 KANTS
The KANTS algorithm is an ant-based method for
data clustering and classification. The term KANTS
derives from Kohonen Ants, since the algorithm was
partially inspired by Kohonen’s Self-Organizing
Maps (Kohonen, 2001). However, KANTS is also
based on AS and its working mechanisms are very
similar to the algorithms in (Chialvo and Millonas,
1995) and (Ramos and Almeida, 2001). The way the
concept of pheromone is implemented is the main
difference when comparing KANTS with AS.
In this section, a simplified version of KANTS is
described. Since performance is not an issue here,
IJCCI2012-InternationalJointConferenceonComputationalIntelligence
74

the algorithm has been deprived of some parameters
that can be useful for fine-tuning its behaviour, but
are not fundamental for swarm art. The reader is
referred to (Mora et al., 2008) for a detailed
description of the original KANTS. Please note that
although KANTS is different from traditional Ant
Algorithms, it is stigmergic, and directly inspired by
AS: its working mechanisms are simple extensions
of the model’s set of equations. Therefore we use
here the metaphor and the terminology associated
with this kind of algorithms and models: ants,
pheromone, reinforcement and evaporation.
KANTS is based on the emergent properties of a
set of simple units that travel through a 2-
dimensional grid. In KANTS, this habitat is mapped
to an array with size , in which is the
dimension of the data vectors of the target-problem,
and is the dimension of the grid. That is, each
cell in the habitat is mapped to a -dimensional
vector. In addition, the ants also “carry” a -
dimensional vector that corresponds to a data
sample: each ant is in fact one data sample of the
data set. The main idea of the algorithm is having
data samples (ants) moving on (and updating a) an
array of real-valued vectors with the same size of the
samples. The dimension of the habitat affects the
performance. In general, a ratio between the number
of data samples and the size of the habitat (measured
in number of cells) in the range
1
3
,
1
2
provides
a good basis for KANTS clustering abbility.
The values of the grid’s vectors are initially set
to a random value with uniform distribution in the
range 0,1.0. Then, the ants are randomly placed in
the grid (after the vectors they “carry” are also
normalized within the range 0,1.0). In each
iteration, each ant is allowed to move to a different
cell of the habitat and modify that cell’s vector
values. The ants move to neighboring cells using
equations 1 and 2, taken from AS.
1
1
(1)
→
j
.rj
∑
j
∈ .
(2)
Equation 1 measures the relative probability of
moving to a cell with pheromone density . The
parameter (0 is associated with the
osmotropotaxic sensitivity. Osmotropotaxis has been
recognized by Wilson (1971) as one of two
fundamental types of an ant’s sensing and
processing of pheromone, and it is related to
instantaneous pheromone gradient following. In
other words, parameter controls the degree of
randomness with which the ants follow the gradient
of pheromone. The parameter (0defines the
sensory capacity (1
⁄
), which describes the fact that
each ant’s ability to sense pheromone decreases
somewhat at high concentrations. This means that an
ant will eventually tend to move away from a trail
when the pheromone reaches a high concentration,
leading to a peaked function for the average time an
ant will stay on a trail, as the concentration of
pheromone is varied.
Equation 2, which models the probability of an
ant moving to a specific cell in the habitat
belonging to the current cell’s Moore neighborhood,
is defined after a discretization of time and space:
→
is the probability of moving from cell to ,
is given by equation 1 and is set to 1 if the
cell is within a user-defined radius centered on the
cell (or any other type of permitted target-region
defined by the user) and 0 otherwise. The
pheromone density in equation 1 is defined as the
inverse of the Euclidean distance
,
between
the vector carried by ant
and the vector in cell
, at time-step t,
:
1
,
(3)
This way, an ant tends to travel to cells that are
mapped to vectors which are “closer” to its own
vector. (Please note that
is a data sample and
therefore constant, while the vectors mapped by the
grid are modified by the ants). The ants update the
cell’s vector where they are currently on, according
to equation 4, where ∈ 0,1.0 is a learning rate
that controls how fast the cells’ vectors acquire the
information carried by the ants. This is the equation
that modifies the environment and shapes the images
given in Section 5. Please note that this
reinforcement action is proportional to the Euclidean
distance between the ant’s vector and the cell’s
vector: an ant tends to travel to cells with vectors
more “similar” to its own, and, at the same time,
they change that cell’s values, approximating them
to their own values, at a rate that is proportional to
the distance between the vectors.
1
1
,
.
1
(4)
.
(5)
Finally, the grid vectors are all evaporated in each
time step. Evaporation, in KANTS, is done by
updating the values according to Equation 5, where
∈0,1.0 (usually a small value, in the range
0.001,0.1) is the evaporation rate and
is the
PherogenicDrawings-GeneratingColored2-dimensionalAbstractRepresentationsofSleepEEGwiththeKANTS
Algorithm
75
vector’s initial state (at 0). Basically, the
evaporation step pushes the vectors’ values towards
their initial values.
With this set of equations, the ants shape the
environment, communicate via that environment,
self-organize, and, after a certain number of
iterations, congregate in clusters that more or less
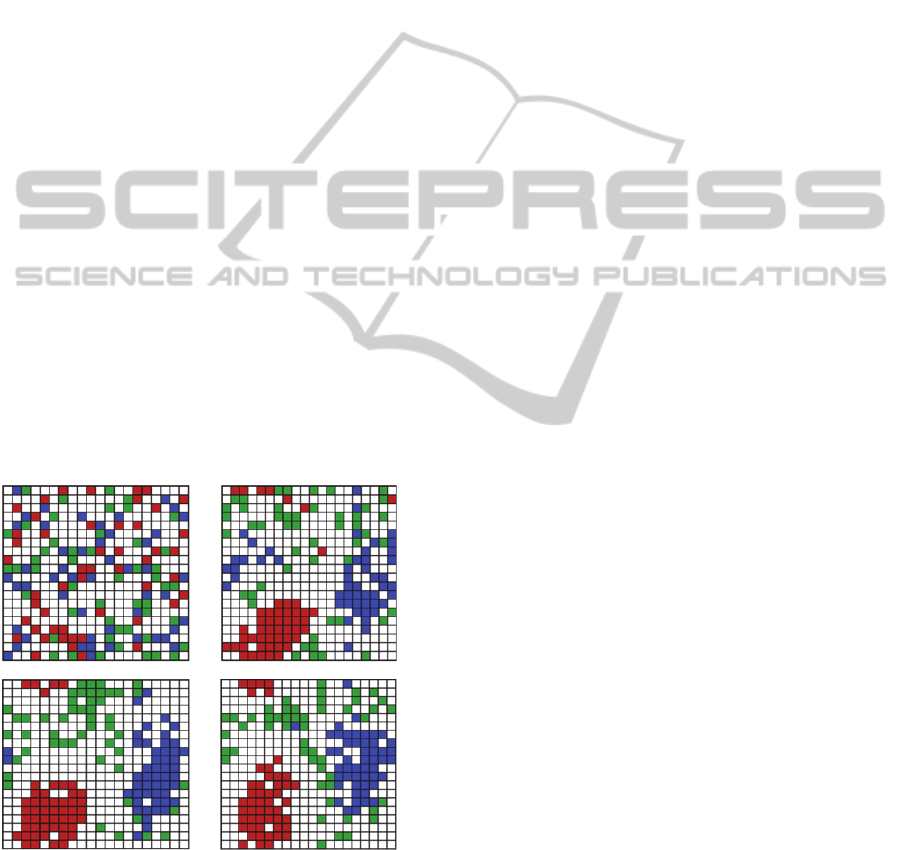
represent each class in the data set. Figure 1
exemplifies the outcome of KANTS’ stigmergic
behavior when applied to the iris flower data set
(Fischer, 1936). The iris dataset consists of 150
samples of vectors, 50 of each of three classes of iris
flowers. Each vector has 4 variables, representing
the 4 features from each sample. Therefore, KANTS
works with a population of 150 ants in a 20 20
habitat. Parameters and are set to 32 and 0.2
respectively, while is set to 0.5 and evaporation
rate is set to 0.01. Figure 1 shows the state of the
swarm at different time-steps. Each color represents
a class. After 50 iterations the ants start to cluster. At
100, the Setosa cluster (red) is defined and
separated. Versicolor and Viriginica are not
separable but the algorithm has an interesting
capacity of congregating Virginica samples (blue) in
a region of the habitat. The stochastic nature of the
algorithm and the lack of any local refinement
mechanism makes that sometimes the clusters tend
to break (see 150). However, these results and
others (Mora et al., 2008) validate the algorithm as a
non-supervised clustering algorithm.
0 50
100 150
Figure 1: KANTS: Evolution of the position of the ants in
the grid. Iris flower data set. Red samples: Setosa; green
samples: Versicolor; blue samples: Virginica.
Mora et al. (2008) also describe a classification
tool that uses information retrieved by the state of
swarm. However, the pheromone maps (i.e., the
grid) are used by the algorithm only for the ants to
communicate, being discarded by the end of the run.
The important components of KANTS as a problem
solver are the clusters and the classification maps.
Section 5 shows how the grid can be visualized as a
kind of data’s fingerprint. But first, Section 4
introduces the sleep staging problem and the data
used for generating the pherogenic drawings.
4 SLEEP SIGNALS
Sleep is a state of reduced and filtered sensory and
motor activity, within which there are different
stages, each one with a distinct set of associated
physiological and neurological features. The correct
identification of these stages is very important for
the diagnosis and treatment of sleep disorders.
However, sleep classification is not completely
standardized. Usually, sleep experts make the
classification by visual methods, i.e., they analyze
the signal and then, according to its patterns in a
specific time period, they decide in which stage the
patient was in that precise period. This method is
time-consuming and prone to errors. Therefore, it is
very important for biomedical sleep research to
devise methods to extract the proper information that
is later used for classification. Then, portable
devices may be used for monitoring sleep (Krejcar et
al., 2011) or for detecting sleep disorders (Acharya
et al., 2010). However, automatic sleep classification
is a hard computational problem that requires
efficient solutions at different levels of the process.
After extracting the relevant information from
the signals associated with sleep —
electroencephalography (EEG), electromyography
(EMG) and electrooculography (EOG) — competent
classification tools are also required for a correct
identification of the sleep stages. Even though
several attempts have been made to automate the
classification, so far no method has been published
that has proven its validity in a study including a
sufficiently large number of controls and patients of
all adult age ranges.
Usually, the classification of sleep stages is made
under the Rechtschaffen and Kales (1968) guidelines
(R&K classification rules), which divide sleep into
five stages: REM, NREM1, NREM2, NREM3 and
NREM 4, with WAKE as an additional stage. The
complete EEG, EOG and EMG records, divided in
epochs, usually, each one with 30 second.
Therefore, an 8-hour night-sleep consists in 960
samples of six possible classes.
IJCCI2012-InternationalJointConferenceonComputationalIntelligence
76
An automatic tool for classifying sleep data can
be constructed under two different principles. In the
first approach, the manual classification is mimicked
and translated into an automatic process. Another
approach extracts relevant information from the
signals, quantifies it and then use traditional
numerical classification system. In 1975, Hjorth
(1975) proposed a method for extracting three
parameters from EEG. The first is a measure of the
mean power representing the activity of the signal.
The second, called mobility, is an estimate of the
mean frequency. The third estimates the bandwidth
of the signal and represents complexity. The main
advantage of Hjorth’s method is its low
computational cost when compared to other
methods. Furthermore, the time-domain orientation
of this representation may prove suitable for
situations where ongoing EEG analysis is required.
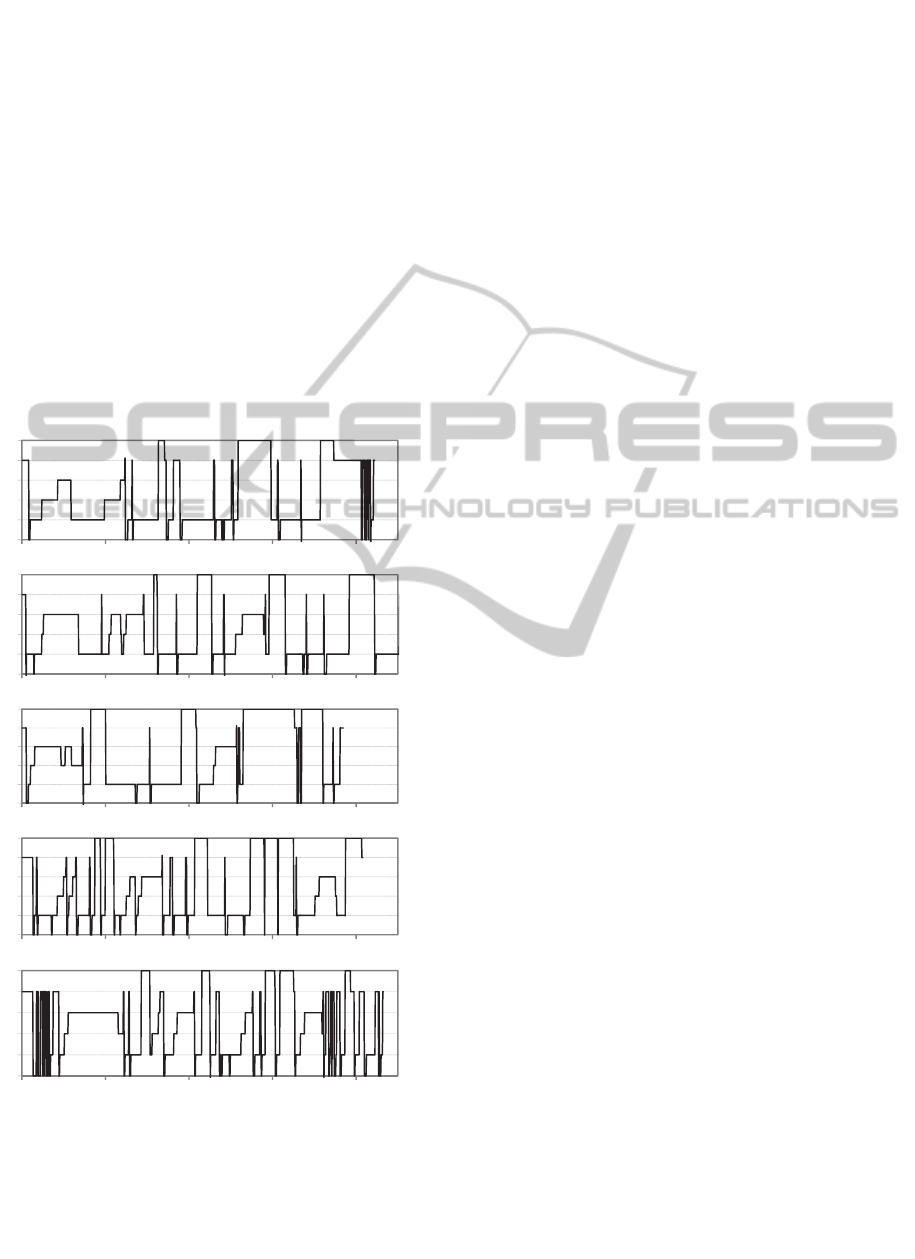
Figure 2: Hypnograms of patients 1, 2, 3, 4 and 5
(top to bottom). States, y-axis: 1 (NREM1); 2 (NREM2); 3
(NREM3); 4 (NREM4); 5 (Awake); 6 (REM).
However, our choice of the Hjorth parameters is
merely practical: the three variables may be directly
translated into RGB values, generating the desired 2-
dimensional representation of sleep. Besides Hjorth
parameters, there other feature extraction methods.
In fact, this is still an open problem. This paper does
not deal directly with the sleep staging classification
problem and therefore, novel techniques for
extracting relevant features from the sleep signals
are not required. The following section describes the
resulting KANTS pheromone maps when applying
the algorithm to a set of Hjorth parameters
describing EEG signals of five adult sane patients.
5 EXPERIMENTS
For testing KANTS and retrieving its pheromone
maps as RGB images, real data from five adult sane
patients were used. The patients are labeled 01,
02, 03, 04 and 05. The EEG signals were
analyzed and each epoch classified within one of the
R&K classes by a medical expert team. Then, the
Hjorth parameters were extracted from those EEG
signals. Five files with the parameters corresponding
to the EEG signals of each patient were created. The
files contain 844,907, 769, 685 and 865 samples,
respectively, from 01 to 05. Each vector is
labeled with the class assigned by the experts. Since
there are three parameters in the data set, the ants are
described by
,
,
, where
is the
Hjorth activity value in the data set,
is the
complexity of the same vector in the data set value
and
is mobility value (see equation 3).
Figure 2 shows the hypnograms of some patients.
A hypnogram is a graphical representation of the
stages of person’s sleep in a time-domain that allows
a quick observation of a night’s sleep and the
identification of possible sleep disorders. This study
uses data from sane adults without diagnosed sleep
disorders, which, if present, would disturb a normal
hypnogram, but it is possible to observe that each
patient generates rather different hypnograms. When
applied to a stochastic algorithm like KANTS, it is
expected that the resulting pheromone maps are also
very different.
KANTS habitat size is set to 200 200. With this
size, the ratio between the number of ants and the
number of environmental vectors is much smaller
than the values suggested in (Mora et al., 2008).
However, the objective of this work is not to
optimize the clustering ability of KANTS, but
instead to generate images during the process. Given
the size of the data sets, the suggested ratio would
generate small images that could not be properly
visualized and valued. Therefore, input files of each
1
2
3
4
5
6
0 100 200 300 400
1
2
3
4
5
6
0 100 200 300 400
1
2
3
4
5
6
0 100 200 300 400
1
2
3
4
5
6
0 100 200 300 400
1
2
3
4
5
6
0 100 200 300 400
time(minutes)
PherogenicDrawings-GeneratingColored2-dimensionalAbstractRepresentationsofSleepEEGwiththeKANTS
Algorithm
77
patient’s data with 10 copies of each sample were
created. The results in this section are the
pheromone maps created by these enlarged sets,
with sizes 8440 (01), 9070 (02), 7690 (03),
6850 (04) and 8650 (05).
Figure 3: Pherogenic drawing of 05 sleeping period.
Figure 4: Pherographic drawing of patients 01 (top-left),
02 (top-right), 03 (bottom-left) and 04 (bottom-right).
Figure 5: Pherogenic drawing mixing the pheromone maps
generated by 01, 02 and 03.
The algorithm was tested with the following
settings. Parameters and are set to 32 and 0.2.
These values are in the range of the parameter space
that in
(Mora et al., 2008) puts the system in the self-
organized state.
Learning rate is set to 0.2 and
evaporation rate is set to 0.0025. The algorithm
stops after 50 iterations and the environmental
lattice at 50 is used to generate the images in the
RGB format. Each set of values was stored in
200 200 arrays, each one being the source for
creating an RGB image: activity related values are
used to model R values, while G and B are defined
by complexity and mobility, respectively. The
resulting image of patient 05 is shown in Figure 3
while Figure 4 shows the drawings of patients 01to
04. It is clear that each night’s data set generates
unique drawings, even if there are common features
to all of them. However, each one shows different
patterns and major differences are also observed,
namely in the dominant color of the drawings: 01,
for instance, has a strong presence of a pinkish color,
that is almost absent from the other pictures (except
04, where light patches of rose are present).
If we abandon the project of a univocal
representation of a night’s sleep, the possibilities are
endless. It is possible, for instance, to combine the
maps generated by different data sets. Figure 5
shows the result of mixing the environmental
vectors. The image uses for R the activity-related
vectors generated by 01 data, G values are set by
the complexity values generated by 02, and B is
defined by the mobility values of the environment
shaped by patient 03. With such an uncorrelated
input, the picture is more dynamic and vivid than the
images generated by a single night’s sleep.
Figure 6: Distribution of the samples over the class-
domain (the classes are assigned by the medical experts).
0
100
200
300
400
500
123456
numberofsamples
classes
p01
0
100
200
300
400
500
123456
classes
p02
0
100
200
300
400
500
123456
numberofsamples
classes
p03
0
100
200
300
400
500
123456
classes
p04
IJCCI2012-InternationalJointConferenceonComputationalIntelligence
78

Although the hypnograms are clearly different
for each patient, such state-time representations of
the sleep do not help to interpret the differences
observed in the pherogenic drawings of each patient.
The main characteristics of the hypnograms are
perceived in the time-domain. However, for
KANTS, the sequence of events is not relevant. The
behaviour of the algorithm only depends on the
values of the samples, not on their order. Therefore,
for interpreting the differences between the
drawings, it is better to analyze the distribution of
samples in each patient, as in Figure 6.
By comparing the distribution of 01 with other
patients, the main difference is its reduced number
of class 4 (NREM4) samples. This fact could
explain why the pherographic drawing of 01 has a
clear distinct palette of dominant colors. As for03,
which generates a picture with darker tones, its ratio
between class 6 and other classes is clearly higher
than in other patients. This could explain its unique
tone in the set of pherogenic drawings. These
hypotheses are hard to demonstrate due to the
stochastic nature of KANTS and the high number of
variables involved in the process. However, it is
expected that radically different distributions
produce different images, since the samples are the
artists here: they act upon the environment, shaping
it, and the result of such actions depend on the
values of the samples. Therefore, different samples
may create different patterns.
Being a art project, there is an unavoidable (and
desired) subjectivity in this work. However, for the
authors, the results are motivating, not only
creatively, but also as a science-art experience. For
long, sleep was a mysterious state that science and
philosophy tried to study and interpret. In addition,
dreams, an inseparable feature of human sleep,
added a mystic aura to this physiological state.
Having the opportunity of generating representations
of sleep with a bio-inspired and self-organized
algorithm is surely inspiring. Furthermore, the whole
process is based on a kind of distributed creativity,
i.e., the drawings are in part generated by the patient,
since the data samples shape the environment, and in
part created by the swarm and its local rules, from
which global and complex behaviour emerges.
6 CONCLUSIONS
This paper describes a swarm art experiment
conducted with an ant-based clustering algorithm
called KANTS. The algorithm is able to create
clusters of data samples by letting those samples
(ants) travel trough a heterogeneous environment.
The ants communicate via the environment and
modify it. This work uses the resulting environment
(pheromone maps) to create 2-dimensional color
representation of data sets. In this case, sleep data is
used. The input of the algorithm is the well known
Hjorth parameter set, which describe the EEG signal
in the time-domain. The resulting images are
aesthetically interesting, with dynamic patterns and
colors that spread through the canvas in a balanced
way. They also have the interesting characteristic of
being unique representations of a night’s sleep. The
pherogenic drawings of human sleep are fingerprints
of a person’s night sleep. Furthermore, they are the
result of a distributed creativity, in part generated by
the person/patient (or by the data generated by the
patient during the sleep period), and in part created
by the swarm and its local rules, from which global
and complex behavior emerges.
There are still some technical issues that limit the
size of the environment, and therefore the size of the
images. The computational time of the KANTS
algorithm grows at least linearly with the number of
vectors in the habitat, which means that a 2000
2000 size image requires a computational cost that
is 100 times the cost of creating a 200 200 sized
image. Since creating 200 200 pheromone maps
takes 10-15 minutes, experiments with much larger
sizes may be impractical at the moment.
Sleep data with Hjorth parameters was chosen
because the three parameters are suited for a direct
translation into the RGB format. However, other
feature extraction methods of the EEG signal could
be used, providing that strategies for translating the
values into the RGB image are devised. In addition,
other type of data can also be tested. There are many
benchmark problems and real-world data sets and it
would be interesting to observe the resulting
pherogenic drawings after different types of data.
Another possibility is to create 3-dimensional
objects, in which a fourth parameter shapes the
object in a third axis.
ACKNOWLEDGEMENTS
The first author wishes to thank FCT, Ministério da
Ciência e Tecnologia, his Research Fellowship
SFRH / BPD / 66876 / 2009, also supported by FCT
(ISR/IST plurianual funding) through the
POS_Conhecimento Program. This work is
supported by project TIN2011-28627-C04-02
awarded by the Spanish Ministry of Science and
PherogenicDrawings-GeneratingColored2-dimensionalAbstractRepresentationsofSleepEEGwiththeKANTS
Algorithm
79

Innovation and P08-TIC-03903 awarded by the
Andalusian Regional Government.
REFERENCES
Acharya, U. R., Chua, E. C. P., Chua, K. C., Min, L. C.,
Tamura, T., 2010. Analysis and Automatic
Identification of Sleep Stages using Higher Order
Spectra, International Journal of Neural Systems,
20(6), 509-521.
Aupetit, S., Bordeau, V., Monmarché, N., Slimane, M.,
Venturini, G., 2003. Interactive Evolution of Ant
Paintings. In Proceedings of the 2003 Congress on
Evolutionary Computation, Vol.2, IEEE Press, 1376-
1383.
Bonabeau, E., Dorigo, M., Theraulaz, G., 1999 Swarm
Intelligence: From Natural to Artificial Systems. New
York, NY: Oxford University Press.
Chialvo, D., Millonas, M., 1995. How Swarms Build
Cognitive Maps. In The Biology and Technology of
Intelligent Autonomous Agents, Luc Steels, Ed., No.
144, NATO ASI Series, 439-450
Collomosse, J. P., 2007. Evolutionary Search for the
Artistic Rendering of Photographs. In The Art of
Artificial Evolution - A Handbook of Artificial Art and
Music, J. Romero, and P. Machado, Eds, Springer, 39-
62.
Courchesne, L., Gagné, C., Lanzi, P. L., McCormack, J.,
2009. GECCO 2009 Evolutionary Art Competition.
http://www.sigevo.org/gecco-
2009/competitions.html#ea.
Fernandes, C. M., Ramos, V., Rosa, A. C., 2005. Self-
Regulated Artificial Ant Colonies on Digital Image
Habitats. International Journal of Lateral Computing,
2(1), 1-8.
Fernandes, C. M., 2010. Pherographia: Drawing by Ants.
Leonardo 43(2), 107-112.
Fisher, R. A., 1936. The Use of Multiple Measurements in
Taxonomic Problems. Annals of Eugenics 7 (2), 1936,
pp. 179–188.
Grassé, P.-P., 1959. La reconstrucion du nid et les
coordinations interindividuelles chez bellicositermes et
cubitermes sp. La théorie de la stigmergie: Essai
d’interpretation du comportement des termites
constructeurs’, Insectes Societies, No. 6, 41-80.
Greenfield, G., 2005. Evolutionary Methods for Ant
Colony Paintings. In Applications on Evolutionary
Computing: EvoWorkshops 2005, Lecture LNCS. Vol.
3449, Springer, 478-487.
Greenfield, G., (2006). Ant Paintings using a Multiple
Pheromone Model, in Proceedings of the 7th
International Conference on Short and Medium Span
Bridges (Bridges 2006), 319-326.
Hjorth, B., 1975. Time domain descriptors and their
relation to a particular model for generation of eeg
activity. CEAN -Computerized EEG analysis, 3–8.
Kohonen, T., 2001. The Self-Organizing Maps. Springer-
Verlag, Berlin.
Krejcar, O., Jirka, J., Janckulik, D., 2011. Use of Mobile
Phones as Intelligent Sensors for Sound Input. Sensor,
11(6), 6037-6055.
Lewis, M., 2007. Evolutionary Visual Art and Design. In
The Art of Artificial Evolution - A Handbook of
Artificial Art and Music. J. Romero, and P. Machado,
Eds, Springer, 3-38
Monmarché, N., Mahnich, I., and Slimane, M., 2007.
Artificial Art Made by Artificial Ants. In The Art of
Artificial Evolution - A Handbook of Artificial Art and
Music, J. Romero, and P. Machado, Eds, Springer,
227-24.
Mora, A., Fernandes, C.M., Merelo, J.J., Ramos, V.,
Laredo, J.L.J., Rosa, A.C., 2008. KohonAnts: A Self-
Organizing Ant Algorithm for Clustering and Pattern
Classification. In Proceedings of the 11th International
Conference on Artificial Life, S. Bullock et al., Eds.,
MIT Press, Cambridge, MA, 428-435.
Moura, L., 2001. Swarm Paintings - Non-human Art.
Architopia. Utopia Biennial, L. Moura, L. and J.L.
Maubant, Eds, 11-24.
Moura, L., (Ed.) 2009. Inside: Art and Science.
Exhibition’s Catalogue, Ed. LXXL, Lisbon.
Ramos, V., Almeida, F. 2000. Artificial Ant Colonies in
Digital Image Habitats: a Mass Behaviour Effect
Study on Pattern Recognition. In Proceedings of the
2
nd
International Workshop on Ant Algorithms, M.
Dorigo et al., Eds., 113-116.
Rechtschaffen, A., Kales, A., 1968. A manual of
standardized terminology, techniques and scoring
system for sleep stages of human subjects, ser.
National Institutes of Health (U.S.). Bethesda, Md: U.
S. National Institute of Neurological Diseases and
Blindness, Neurological Information Network, vol.
204.
Romero, J., Machado, P., (Eds.) 2007. The Art of Artificial
Evolution: A Handbook on Evolutionary Art and
Music. Springer, Berlin-Heidelberg.
Semet, Y, O’Reilly, Durand, F., 2004. An Interactive
Artificial Ant Approach to Non-photorealistic
Rendering. In Proceedings of the Genetic and
Evolutionary Computation Conference (GECCO)
2004, K. Deb et al., Eds., LNCS 3102, Springer-
Verlag, 188-200.
Sims, K., 1991. Artificial Evolution for Computer
Graphics. In Proceedings of SIGGRAPH '91, 319–328.
Takagi, H., 2001. Interactive Evolutionary Computation:
Fusion of the Capacities of EC Optimization and
Human Evaluation. In Proceedings of the IEEE 89, 9,
1275-1296
Todd, S., Latham, W., 1992. Evolutionary Art and
Computers. Academic Press, Harcourt Brace
Jovanovich,.
Wilson, E. O., 1971. Insect Societies. Cambridge:
Belknam Press
IJCCI2012-InternationalJointConferenceonComputationalIntelligence
80
