
MetSim: A Simulation Decision Support Tool using Meteorological
Information for Short-Term Planning of Hospital Services
Paul Harper
1
, John Minty
1
, Sujit Sahu
2
, Bernard Baffour
2
and Christophe Sarran
3
1
School of Mathematics, Cardiff University, Cardiff, U.K.
2
School of Mathematics, University of Southampton, Southampton, U.K.
3
Met Office, Exeter, U.K.
Keywords: Forecasting Demand, Hospital Capacity Management, Weather, Simulation.
Abstract: Improved short-term predictions of hospital admissions and bed occupancy offer the potential to plan
resource needs more accurately and effectively. The MetSim project explores the relationship between
weather and health, building novel Bayesian models that are more sensitive to fluctuations in weather.
Short-term forecasts of the numbers of admissions, categorised by age, gender and medical condition, are
produced. In turn, coupled with predictions on length of stay and information on current occupancy,
MetSim uses hazard ratios embedded within a simulation framework to provide forecasts of short-term bed
needs. MetSim is a collaboration between Cardiff University, the University of Southampton, and the Met
Office. Cardiff and Vale University Health Board and Southampton University Hospitals NHS Trust have
guided the development of MetSim, provided data and piloted the tool.
1 INTRODUCTION
More than 2,000 years ago, Hippocrates first
recognised that epidemics were related to seasonal
changes in weather. However, it was only during
the 1970s that research into connecting weather and
health was taken seriously and, for the first time,
meteorological variables were investigated to gain
insight into the causes of increased mortality in
winter and smaller increases in unusually hot
weather (Keatinge 2002). Since then, the interest in
the effects of weather on health has grown
substantially, helped to some extent by raised
awareness of global warming and concern about the
public health impact of climate change. Knowledge
on the influence of weather on health is valuable,
and has the ability to contribute greatly to our
understanding of epidemiology, the occurrence of
accidents and injuries, and of public health issues.
Examples of weather-health research from the
literature include those relating to: extreme weather
events (WMO, 2003); sunshine, such as skin cancer
(Cancer Research UK, 2012) and Seasonal Affective
Disorder (Garland, 2003); temperature, such as cold
weather and mortality (Hajat et al., 2002);
Thunderstorms, such as lightning strikes (Elsom,
2001) and leading to increased asthma attacks
(Venables 1997, Dales et al. 2003, New Scientist,
February 2006); and snow/ice leading to fractures
(Smith and Nelson, 1998).
The ability to predict weather offers the potential
to provide valuable information that can be used in
planning health services. For example, imagine a
short-term hospital planning tool that was able to
predict fluctuations in demand and bed occupancy
for different specialities by including meteorological
predictions alongside other known information such
as day of the week. The relationship between
weather and health is immediately evident in some
specialities, for example respiratory medicine.
Figure 1 shows respiratory admissions data from
Southampton General Hospital. The top graph
shows temperature over a five year period. The
remaining graphs show admissions and discharges in
black and occupancy in red. We observe that low
temperatures lead to an increased number of
admissions. Similar plots have been produced with
data from other UK hospitals.
The MetSim project is a multidisciplinary
collaboration involving academics (from OR and
Statistics), meteorologists from the Met Office, and
managers and consultants from hospitals.
It is beneficial for managers of hospitals to have
short-term forecasts of demand and occupancy. Of
543
Harper P., Minty J., Sahu S., Baffour B. and Sarran C..
MetSim: A Simulation Decision Support Tool using Meteorological Information for Short-Term Planning of Hospital Services.
DOI: 10.5220/0004161805430547
In Proceedings of the 2nd International Conference on Simulation and Modeling Methodologies, Technologies and Applications (HA-2012), pages
543-547
ISBN: 978-989-8565-20-4
Copyright
c
2012 SCITEPRESS (Science and Technology Publications, Lda.)
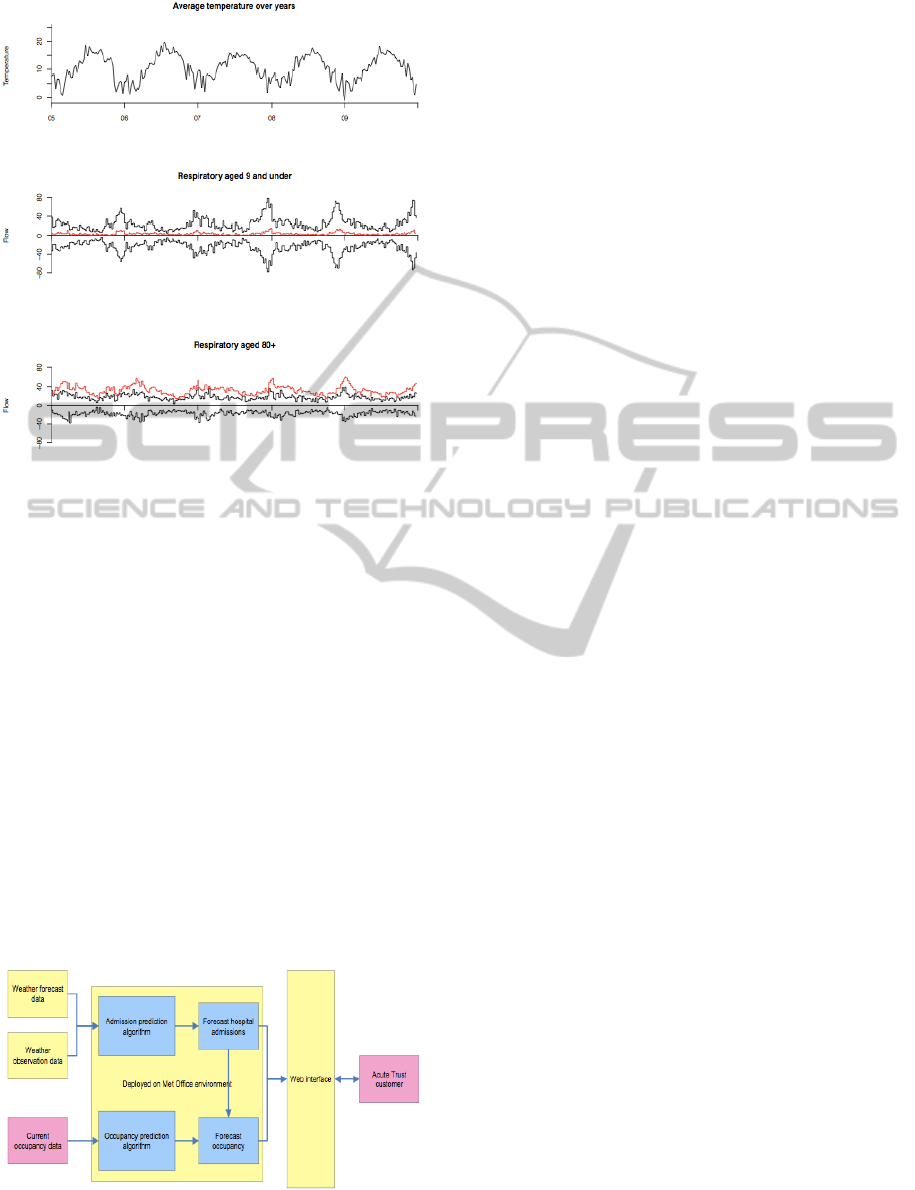
Figure 1: Respiratory patient flows at Southampton
General Hospital.
particular interest is the number of non-elective
(emergency) patients. Our particular focus is on
patients who are admitted into hospital, as opposed
to attending Accident and Emergency. The
objectives of the MetSim project are:
• To describe hospital occupancy in two parts:
rate of admissions and length of stay.
• To explore relationship between weather
patterns and hospital admissions.
• To describe different lengths of stay for
different classes of patient.
• To build a web-based tool which provides
hospitals with short-term (7-day) predictions on
demand and corresponding bed occupancy.
Figure 2 presents a high-level schematic of the
component parts of the MetSim tool and
corresponding responsibilities. These components
are discussed in subsequent sections of this paper.
Figure 2: MetSim schematic.
2 DATA
Anonymized patient admission and discharge data
from participating hospitals have been linked to
meteorological data provided by the Met Office. We
summarise the data types below.
2.1 Historic Hospital Data
For every admission/discharge of a patient over the
course of a year the hospital records the age at
admission, gender, broad class of treatment
(medicine, surgery, trauma, paediatric or other), date
of admission, and date of discharge. Hour of
admission and discharge is optional. Ideally, the
year of observation should be from 14 months ago to
2 months ago.
2.2 Current Hospital Data
For some day during the last week, the hospital
gives a census of all prevalent patients. The items
recorded are as for historic data except that there is,
perforce, no date of discharge.
2.3 Meteorological Data
Over the entire time period, historic, current and
forecast, the Met Office records the mean
temperature on a given day and the minimum one
week ago.
2.4 Temporal Data
Other variables needed are school holidays, public
holidays, and day of the week. The historic hospital
dataset is used to select models and estimate
parameters. The current and forecast temperatures
are then used to forecast admissions. The current
hospital data are used only to simulate occupancy.
2.5 Historiography
We initially analysed datasets much larger than the
ones in the final version of the model. The
hospitals’ historic datasets included the method of
admission, full episodic progression of patient-spells
and destination on discharge. The meteorological
datasets included humidity, pressure, vapour
pressure, rainfall and wind speed.
SIMULTECH2012-2ndInternationalConferenceonSimulationandModelingMethodologies,Technologiesand
Applications
544
3 FORECASTING ADMISSIONS
As anticipated, age is a significant explanatory
variable; we partitioned patients into 0-17 as
paediatric, 18-74 as adult and 75+ as elderly (on
guidance from the hospitals). We used gender, as
much for logistic (planning for single sex wards) as
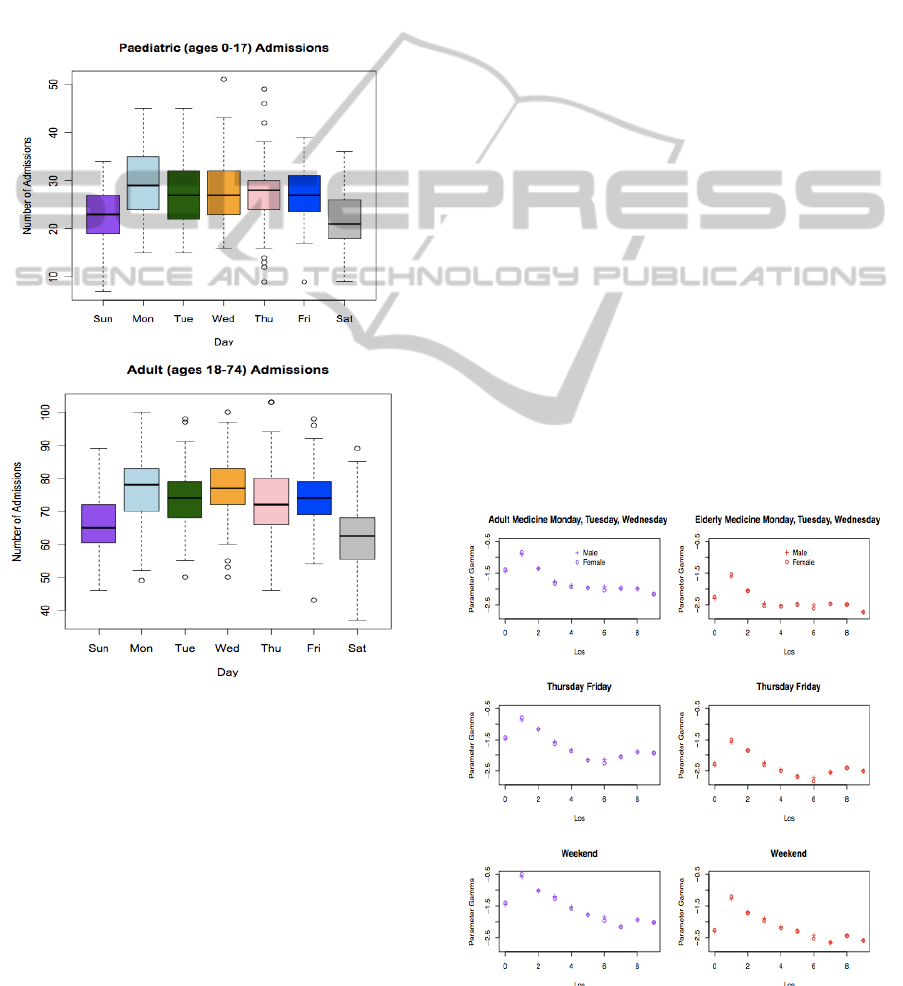
statistical reasons. Temperature is a significant
explanatory variable as is current day of the week.
Figure 3 illustrates that admissions are higher during
weekdays than at weekends.
Figure 3: Boxplots of admissions by day.
3.1 Transformation
The data reveal that the number of daily admissions
is naturally positively skewed. To overcome this in
modelling, it is sufficient to take a square-root
transformation. Having fitted a large number of
models to the historic hospital dataset we reached
the following conclusions:
• A model which includes age, sex, day of the
week, whether the day is a school holiday, mean
daily temperature and minimum temperature a
week ago is the best main effects model
according to both the R
2
and AIC. Such a model
is very parsimonious.
• This is improved by adding two-factor
interaction terms, namely age-gender and
interaction between age and minimum
temperature a week ago. In fact, it explains
over 80% of the variation in daily admissions.
This is the model which will be adopted
henceforth.
• Age alone explains a remarkable 74% of the
variation in the number of admissions.
3.2 Weather Forecasting: Uncertainty
The model is found from historic data with observed
weather temperatures. When predicting future
admissions, we rely on weather forecasts.
Accordingly, we regard actual future temperature as
some linear function of forecast temperature, putting
Bayesian uncertainty on the coefficients of the linear
relation
4 LENGTH OF STAY
The length of stay is a problem in survival analysis,
where “survival” is not leaving the hospital, whether
by discharge, transfer or death. We regard the
length of stay as a non-negative discrete number of
days n≥0. Let h(n) denote the hazard rate and let
Gamma denote the log-odds of the hazard rate.
Figure 4: Log-odds of hazard rates for Southampton.
MetSim:ASimulationDecisionSupportToolusingMeteorologicalInformationforShort-TermPlanningofHospital
Services
545
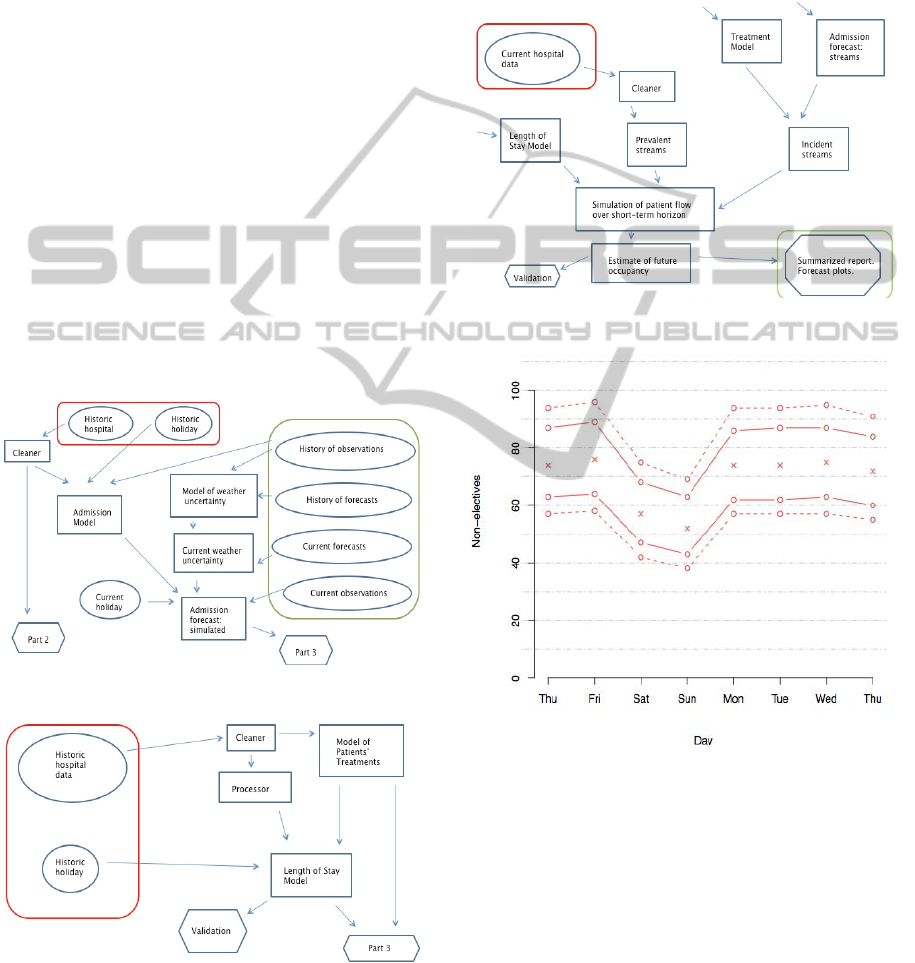
Figure 4 shows how Gamma evolves and depends
also on age and current day of the week.
To model the log-odds of the hazard rates, we
include the explanatory variables age, gender, day of
week together with a broad grouping of the patients’
specialities: medicine, surgery, trauma or other.
Even in the least favourable cases about 70% of the
variation is explained; it is often much higher.
5 SIMULATION STRUCTURE
We are now in a position to describe the flow of
patients. It is too difficult to model analytically, so we
simulate. We use a discrete timeline in days. We first
use the historic weather data together with the historic
hospital data to model admissions. From such a model,
we use current and forecast weather data to simulate
streams of admissions over the next few days (Figure
5). Next we model length of stay. We also simulate
the specialities of newly admitted patients (Figure 6).
Finally, we use data on current patients together with
streams of hypothetical admissions to simulate streams
of discharges (Figure 7).
Figure 5: Simulation of admissions.
Figure 6: Simulation of length of stay.
We thus obtain forecasts for admissions,
discharges, occupancy and change in occupancy.
For example, Figure 8 shows a forecast of
admissions for the next week, with 80% and 95%
confidence intervals.
The projected is currently being piloted. Cardiff
and Southampton hospitals are submitting datasets
to the Met Office where our code is implemented.
The Met Office returns the forecasts to the hospitals.
Figure 7: Simulation of patient flow.
Figure 8: Illustrative MetSim output: Forecasted
admissions (non-paediatric).
6 DISCUSSION
This paper outlines the underpinning methodology
of the MetSim tool, designed to support hospital
managers in predicting short-term demand and bed
occupancy. Initially a Bayesian statistical model
(full details are not included in this proceedings
paper in the interests of space and rather the focus
on the simulation components) is used to forecast
SIMULTECH2012-2ndInternationalConferenceonSimulationandModelingMethodologies,Technologiesand
Applications
546

demand for different categories/conditions of
admissions. This tool is currently being piloted at
two hospitals: Cardiff and Southampton, and results
at the time of writing this paper are promising. For
example, over a period April 25
th
2011 to January
31
st
2012, the Root Mean Square Error (RMSE) of
7-day ahead forecasts was just 4.8.
Demand forecasts are then fed into a simulation
framework to produce corresponding bed occupancy
predictions over the planning horizon. To do this,
we simulate length of stay for the predicted
admissions using hazard rates (such that the time a
patient spends in hospital is modelled using
‘survival’ analysis techniques).
The simulation is coded in C++ and sits on the
server at the Met Office, Exeter, UK. A number of
routines are run (as shown diagrammatically for
simplicity in Figures 5-7) typically for 1000’s of
iterations (and thanks to the power of the
supercomputer at the Met Office, are executed
within seconds), thus participating hospitals are
provided on a daily basis with forecasts and
associated confidence intervals.
Over the next few months we will streamline the
system to have a web interface for ease of use.
Further piloting is also taking place with more
hospitals across the UK.
ACKNOWLEDGEMENTS
This work is supported by the UK Engineering and
Physical Sciences Research Council (EPSRC), grant
EP/H010637/1.
The authors thank Patrick Sachon from the UK
Met Office; Ben Hendy and Alison Gray from
Southampton University Hospital Trust; Steve Tarr,
Andrew Nelson and John Peters from the Cardiff
and Vale University Health Board. These persons
provided the data used here and shared their many
helpful insights.
REFERENCES
Cancer Research UK, 2012. http://www.
cancerresearchuk.org. Accessed on the 1st May 2012.
Dales, R.E., Cakmak, S, Judek, S, Dann, T, Coates, F et al
2003. The role of fungal spores in thunderstorm
asthma. Chest 123(3): 745-750.
Garland, C.F., 2003. More on preventing skin cancer: sun
avoidance will increase incidence of cancers overall.
British Medical Journal 327: 1228.
Hajat, S., Kovats, R. S., Atkinson, R. W. and Haines, A.,
2002. Impact of hot temperatures on death in London:
a time series approach. Journal of Epidemiology and
Community Health 56: 367-372.
Keatinge, W. R., 2002. Winter mortality and its causes.
International Journal of Circumpolar Health 61: 292-
299.
Smith, R. W. and Nelson, D. R., 1998. Fractures and other
injuries from falls after an ice storm. American
Journal of Emergency Medicine 16(1): 52-55.
Venables, K. M., Allitt, U., Collier, C. G., Emberlin, J,
Greig, JB et al (1997) “Thunderstorm-related asthma –
the epidemic of 24/25 June 1994”. Clinical and
Experimental Allergy 27(7): 725-736.
WMO (World Meteorological Organization) (2003).
Extreme weather events might increase. July 2nd
2003. http://www.wmo.int/index-en.html. Accessed on
1st May 2012.
MetSim:ASimulationDecisionSupportToolusingMeteorologicalInformationforShort-TermPlanningofHospital
Services
547
