
Road Safety at Intersections Controlled by Traffic Lights
IVC and Risk Indexes
Bruno Dalla Chiara, Francesco Paolo Deflorio and Serena Cuzzola
Politecnico di Torino, Department DIATI – Transport Engineering, C.so Duca degli Abruzzi, 24-10129 Torino, Italy
Keywords: ADAS, Safety Index, Intersection Safety, Driver Reaction Time.
Abstract: The paper reports the results of safety analyses conceived to assess the effects and benefits which might be
generated by the forthcoming use of the infrastructure-to-vehicle (I2V) or vehicle-to-infrastructure (V2I)
communication systems at road intersections regulated by traffic lights. Road crossings are often considered
as critical areas for the occurrence of accidents, because they increase the likelihood of the event given the
confluence of traffic streams from and to different directions. The analyses are aimed at calculating a real-
time estimate of some risk indexes of accident, which might be provided on-board when approaching road
intersection regulated by traffic lights. This information can then be used by an ADAS for traffic signal
approaching. Two typologies of use of the information on the risk indexes can be identified: if data can be
detected in real time, the driver could be informed on-board of a potentially hazardous situation using
algorithms to predict the trend of the vehicle on the basis of the data detected from the monitoring; another
use would be detecting – in case the vehicle were already within the dilemma zone – the lowest risk
manoeuvre and sending a message on board to inform the driver.
1 INTRODUCTION
Quantifying the road safety risk and the effects that
the Advanced Driver Assistance Systems (ADAS)
can generate on it – i.e. the combined value of
reducing the likelihood of an accident and its
severity – is a very sensitive theme, which can today
resort to the infrastructure-to-vehicle and/or vehicle-
to-vehicle communication systems. Together with
the interest towards the quality and energy efficiency
of transport, safety is contributing to the fast
spreading of Intelligent Transport Systems (ITS),
which include – amongst the different technologies –
the ADAS. Such perspective is part of the migration
– which has been in progress for years – from the
mere passive safety to the study of systems, tools
and applications which can ensure active, preventive
and post-crash safety.
Within this context, attention is progressively
concentrating on the cooperative systems, which can
interact to one another, thus setting up
communication between the different vehicles
(Vehicle–to–Vehicle, V2V) or between the vehicles
and the infrastructures (Vehicle-to-Infrastructure,
V2I, or Infrastructure-to-Vehicle, I2V) to create ad
hoc communication networks. This paper focuses on
the effects of integrating such communication
systems with the ADAS with the aim of improving
road safety; special attention is paid to the safety of
the road users, in order to reduce both the number
and severity of the road accidents. The
communication technologies between vehicles and
between infrastructure and vehicle are suitable to
intervene at the pre-crash stage, i.e. in emergency -
assistance, where the action of the driver could still
prevent the accident or reduce its risk.
It worth reminding a basic definition of crash,
slightly reviewing the one which was proposed in
Dalla Chiara, Deflorio and Diwan (2009): the crash
phase of an accident occurs when the perception-
reaction time of a driver plus the time necessary to
actuate the procedure (e.g., braking) of the vehicle
he/she is driving is greater than or equal to the time
involved by the exogenous variation that occurs
outside the vehicle; such a perception-reaction time
of the driver plus that of the vehicle is therefore the
maximum time available for the driver to respond to
an emergency condition on the road and prevent an
accident.
The road intersections are often considered as
critical areas for the occurrence of crashes, because
they increase the likelihood of the confluence of
569
Dalla Chiara B., Deflorio F. and Cuzzola S..
Road Safety at Intersections Controlled by Traffic Lights - IVC and Risk Indexes.
DOI: 10.5220/0004165105690577
In Proceedings of the 9th International Conference on Informatics in Control, Automation and Robotics (IVC&ITS-2012), pages 569-577
ISBN: 978-989-8565-22-8
Copyright
c
2012 SCITEPRESS (Science and Technology Publications, Lda.)

traffic streams from and to different directions.
2 STATE OF THE ART
During the last years, car manufacturers and
researchers experimented many ADAS (MacNeill,
and Miller, 2003); (Maile and Delgrossi, 2009).
These systems are in-vehicle technologies that
provide support to various aspects of the driving task
and they are supposed to improve traffic safety and
traffic efficiency. In this field, the most famous and
deployed ADAS systems are the adaptive cruise
control (ACC) and the intelligent speed adaptation
(ISA), collision avoidance systems, adaptive light
control, lane departure warning, driver vigilance
monitoring, pre-crash vehicle preparation and
parking aid (Tapani, 2009); (Monteil et al., 2011).
In order to estimate the future impact of the
ADAS development process from its very early
stages, some studies were based on the use of
microscopic traffic simulation. Torday et al. (2003)
proposed to integrate the output of this tool with a
safety indicator, evaluated during the micro
simulation process. The microscopic level of traffic
description grants the opportunity of knowing the
relative position of the vehicles, their speed and
deceleration. All of these parameters thus enable the
computation of a safety indicator useful to compare
scenarios where ADAS are activated for vehicles.
Other authors (Morsink et al., 2008) provide an
overview of micro-simulation modelling for road
safety impact assessment of ADAS. Recent literature
and expert opinions identify driver behaviour sub-
models and road safety indicators as key
components. In Benz et al. (2006), several existing
models – on both the micro and macro scales –
would be adapted and used to assess safety related
effects of ITS measures. Examples of such measures
include but are not limited to ADAS and IVIS.
While the micro-models would determine the
individual vehicles' safety related behaviour, the
macro-models would investigate the network-wide
aspects.
In order to enhance the performance of micro
simulator for safety analysis, a Surrogate Safety
Assessment Model (SSAM) has been developed (US
DOT-FHWA, 2009). This technique combines micro
simulation and automated conflict analysis, which
analyses the frequency and type of narrowly averted
vehicle-to-vehicle collisions in traffic, to assess the
safety of traffic facilities, without waiting for a
statistically valid number of crashes and injuries to
actually occur. Applications of this method to road
intersection scenarios are reported in Gettman and
Pu (2006), Klunderet al. (2006) and Ki-Joon and
Jaehoon (2009). An assessment of the driver
behaviour at dilemma zone (Liu, Herman and Gazis,
1996) and of the effectiveness of safety indicators
based on the traffic conflict technique at intersection
is reported in Archer (2005) and Hurwitz (2009).
Recent international research projects have been
investigating both vehicle-based and road-based
monitoring. The European projects SAFESPOT,
COOPERS, CVIS and COVEL aimed at improving
road safety by using intelligent vehicles
interconnected to each other through a vehicular ad-
hoc network (VANET).
As regards the V2V and V2I communication
systems and their relationships with safety and
ADAS, they are a primary means for supplying
information to drivers. In recent years, V2V and V2I
communication systems have been submitted to
intensive studies, also applied to safety at
intersections (INTERSAFE-2).
In this field, FOTSIS was a large-scale field
testing of the road infrastructure management
systems needed for the operation of seven close-to-
market cooperative I2V, V2I & I2I technologies (the
FOTsis Services), which allowed assessing in detail
both their effectiveness and their potential for a full-
scale deployment in European roads.
We need to recall that the response time of a
driver can be split into a mental processing and
reaction time and a muscular time . The former
includes the time from the perception of the external
stimulus to the brain’s message to the foot to brake.
This implies the awareness of the hazard, the
emotive response and the reaction itself. The
muscular reaction time is needed for the right foot to
move onto the brake pedal. The driver’s reaction
time is influenced by quick or slow reflexes, by
his/her experience as well as by the complexity of
the dangerous scenario that has to be faced. On the
basis of tests and literature, the median perception-
reaction time of a driver results to be 0.66s,
measured under normal highway driving conditions,
with some degree of braking expectation, since the
drivers were expecting the event to happen. From
the moment the driver puts his/her foot onto the
pedal, almost 0.1s pass (inertia of the system) before
the brake starts operating; this value may increase to
0.4s in the case of slow and older braking
equipment.
The diagram reported in Johansson and Rumar
(1971), as well as on ISO technical standards and in
Dalla Chiara et al. (2009), in revised editions,
represents the distribution of a driver’s brake
ICINCO2012-9thInternationalConferenceonInformaticsinControl,AutomationandRobotics
570
perception-reaction time between 0.2 and 2.1s. The
95
th
percentile of perception-brake response times
for these same conditions was 2.0s. The findings
from this study are consistent with the relevant
literature: most drivers are capable of responding to
an unexpected incident in 2.0s or less. Thus, the
perception-reaction time of 2.5s, adopted by the
American Association of State Highway and
Transportation Officials for design reasons,
encompasses most of the driving population.
A driver who might need 0.3s of perception-
reaction time under alerted conditions might need
1.5s under normal conditions; such response time
may decrease by approximately 1s or more in an
expected situation: IVC warning systems allow one
to pass from an unexpected to an anticipated
situation, and thus influence the perception-reaction
time.
3 SAFETY ANALYSIS AT
INTERSECTIONS
This article shows the results of the analyses
developed on the effects and benefits which would
be potentially generated by the forthcoming use of
the infrastructure-vehicle (I2V) or vehicle -
infrastructure (V2I) communication systems at the
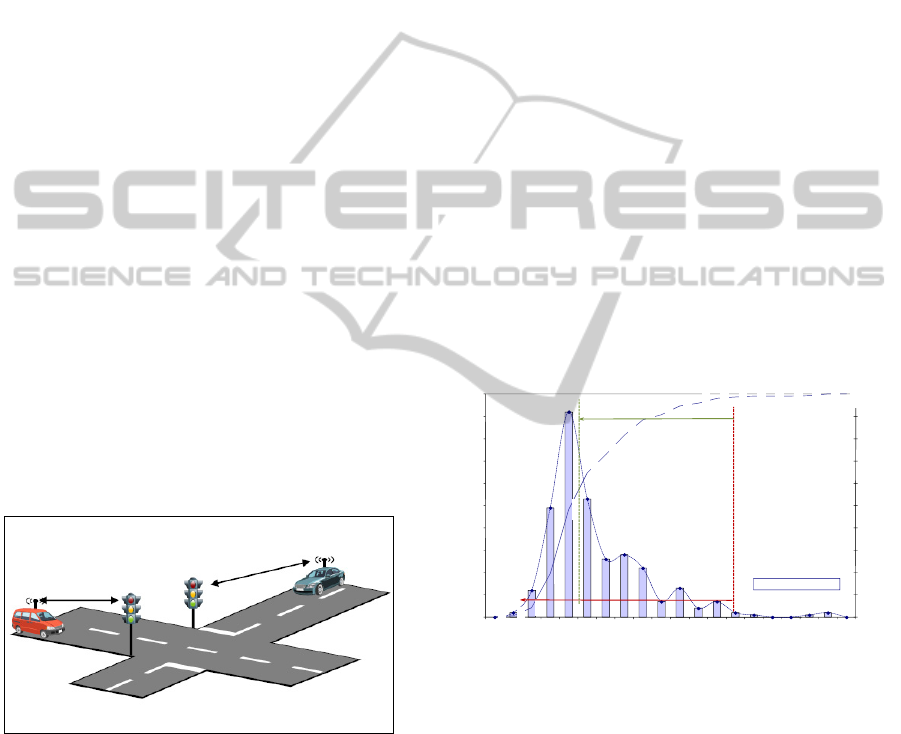
road intersections regulated by traffic lights (Fig. 1):
a theme that – as it has been highlighted – is
extensively being dealt within the literature.
Figure 1: Evocative image of I2V and V2I at a generic
intersection regulated by traffic lights (INTERSAFE-2).
The effects of the use of the I2V systems are
assessed through the proposal of indicators on the
likelihood and/or severity of the risk, which can
timely and preventively indicate potentially critical
conditions and send more or less intensive alarm
messages – depending upon the criticality– on board
the vehicles which are potentially involved by means
of the I2V communications.
For the sake of completeness of the analysis, we
also developed some proposals for the combined use
of sensors to monitor the vehicles which approach
the intersections (US Dept. of Transportation, 2008).
Our analyses assume that the use of I2V systems
would match the increased level of attention of the
driver and – consequently – the dampening of the
perception-reaction-actuation time (t
p,r,a
) of the
driver, with the subsequent increased safety margin.
The processing concerns the study of the driver’s
behaviour when the yellow light is triggered. All
such processes associate the use of the I2V
technologies to the maximum perception-reaction -
actuation time of the driver (t
p,r,a
) which – in case of
low levels of attention – has been estimated to 2.3
seconds (where 0.8s can be assumed for the
actuation phase), on the basis of Johansson and
Rumar’s distribution (1971). The studies are based
upon the assessment of the variation of new road
risk indexes as a result of the reduced t
p,r,a
time;
specifically, it is assumed that the I2V
communications are such to send on board
indications which can supply two levels of alert,
namely: the former can take the attention of the
driver back to normal levels (t
p,r,a
equal to 1.46s:
green arrow in Fig. 3.) and the latter can generate an
actual alert (t
p,r,a
equal to 1.1s: red arrow in Fig. 2).
Figure 2: Johansson and Rumar’s distribution of the t
p,r
highlighting the two values of t
p,r
which give t
p,r,a
=1.46s
(green arrow) and 1.1s (red arrow).
4 THE DILEMMA ZONE AND
ROLE OF INTEGRATED
I2V-ADAS
It is worth reminding – first of all – the concept of
dilemma zone, which has been most likely
introduced for the first time in (Liu, Herman and
Gazis, 1996). The so-called dilemma zone is the
portion of approach to the intersection the driver
might cover, starting from the time when the traffic
0
2
12
49
92
53
26
28
22
7
13
4
7
2
1
00
1
2
0
0.0%
0.6%
4.4%
19.6%
48.3%
64.8%
72.9%
81.6%
88.5%
90.7%
94.7%
96.0%
98.1%
98.8%
99.1%
99.1%
99.1%
99.4%
100.0%
100.0%
0
0.1
0.2
0.3
0.4
0.5
0.6
0.7
0.8
0.9
1
0
10
20
30
40
50
60
70
80
90
100
0.2 0.3 0.4 0.5 0.6 0.7 0.8 0.9 1 1.1 1.2 1.3 1.4 1.5 1.6 1.7 1.8 1.9 2 2.1
Percentile
Number of people, f
Time [s]
Median time value: 0.66''
RoadSafetyatIntersectionsControlledbyTrafficLights-IVCandRiskIndexes
571

light turns into yellow, without being able to either
stop in safety conditions before the stop line (or
close to it) or to fully clear the intersection at the end
of the yellow light or when the red one is triggered;
such conditions are critical and generate an actual
dilemma to the driver, who does not know what
his/her behaviour should be in order to act safely,
not to commit infractions or cause accidents. Such
area can be eliminated with a proper yellow time
calculation and if vehicle speed is lower than the
established limit, but sometimes it exists and its
position and length vary depending upon the cases
and some parameters need to be taken into
consideration.
In order to clarify the concept of dilemma zone,
the behaviour of a driver is considered
independently, i.e. irrespectively on the one adopted
by the drivers of any vehicles which precede his/her
own one. When the yellow light is triggered, the
driver is faced with a choice: should he/she stop the
vehicle or cross the intersection – even by
accelerating – so that he/she can clear the area
before the red light? We should keep in mind that –
usually – the driver does not know how long the
yellow light will last or the so-called clearance time,
i.e. the all red time. The solution depends on factors
which characterize the distance and time required to
stop the vehicle and/or clear the intersection: the
initial speed of the vehicle, the actual or possible
deceleration, the driver’s perception and reaction
time, the distance between the stop line and the
access, the position of the vehicle when the yellow
light is triggered and the extension of the
intersection. It is obvious that – as a tendency – the
drivers who are far from the intersection choose to
stop; those who are very close to it – instead –
normally try to clear the intersection and therefore –
if required – they accelerate.
In either case, the characteristics of the
manoeuvres are influenced by the perception –
reaction – actuation time (t
p,r,a
) of the driver.
The stopping distance (Xs or d
a
) is the minimum
level of the distance, calculated from the stop line, a
vehicle should be within in order to have a
comfortable stop and in full safety conditions
(beyond such position, the vehicle cannot be
stopped: Cannot stop in Fig. 3). By steady
deceleration, the stopping space can be calculated
through a known ratio (1).
a
v
tvdX
arpas
⋅
+⋅==
2
2
,,
(1)
where:
Xs is the stopping distance or stopping space of
the vehicle [m];
v is the initial speed of the vehicle [m/s];
tp,r,a is the perception – reaction – actuation time
[s];
a is the deceleration [m/s
2
].
The clearance distance (Xc or d
s
) is the maximum
distance from the stop line below which a vehicle
can clear the intersection in full safety conditions
(Cannot go in Fig. 3) within a given yellow light
time, which – though - he/she does not know. This
was computed through ratio (2).
Xc=d
s
=v*(Y+R)+a*(Y+R-t
p,
r
,
a
)2/2-(W+lv) (2)
where:
Xc is the clearance distance in meters;
W is the length of the intersection measured from
the stop line of the access which is considered in the
opposite angle, depending upon the manoeuvre to be
performed; it is expressed in meters;
lv is the length of the vehicle, in meters;
v is the speed the vehicles approaches the
intersection at, expressed in [m/s];
Y is the duration of the yellow light phase
(yellow light time) relevant to the access which is
being taken into consideration, expressed in seconds;
R is the duration of the all red stage (all red
time), in seconds;
tp,r,a is the perception – reaction – actuation
time;
a is the time of the acceleration (assumed as
constant) adopted to clear the intersection. In default
of more accurate data, such as the ones generated by
monitoring, the value of this parameter is assumed
through Gazi’s equation (FHWA, 2006), i.e.:
a[m/s
2
] = 4,9-(0,213*v[m/s])
Three different conditions can be generated on the
basis of the relationship between the two distances
which have been defined above, namely:
1. Xs>Xc
2. Xs = Xc
3. Xs<Xc
In the first case (Xs>Xc), the dilemma zone results
from the overlapping of the Cannot Stop and Cannot
Go portions. The position and length of such areas –
when existing – vary from case to case.
The second case (Xs = Xc) represents an ideal
situation: the dilemma and optional zones disappear;
a driver which would find him/herself in those
conditions could stop the vehicle or clear the
intersection comfortably and in full safety
conditions, with no doubts at all on the behaviour to
ICINCO2012-9thInternationalConferenceonInformaticsinControl,AutomationandRobotics
572
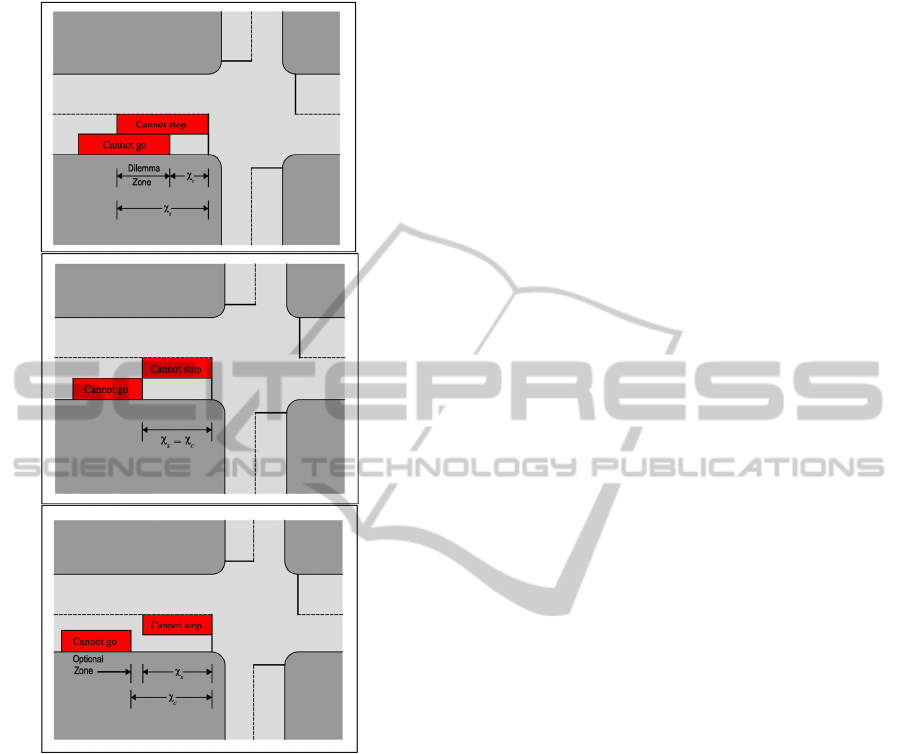
be adopted.
Figure 3: Graphic representation of the zone where the
vehicle cannot stop in safety conditions (Cannot Stop) r
cannot clear the intersection in full safety conditions
(Cannot Go).
In the last case (Xs<Xc) an Optional Zone would
generate, i.e. a portion of the access lane where the
driver of the vehicle in it may select whether to stop
comfortably and safely at the stop line or to clear the
intersection in safety conditions.
It is worth mentioning that the dilemma zone
depends on the kinematic parameters of the vehicle
(i.e. speed, deceleration or acceleration) besides on
the yellow light time, which is generally the same
for all the accesses of the intersection. The most
appropriate strategy to minimize the issue caused by
the presence of the dilemma zone consists of
determining a yellow or all red time which allows
clearing the intersection from the limit position
available to stop. Nevertheless, the variability in the
conditions of motion, of the drivers and adherence of
the carriageway might determine different
circumstances than the ones which are defined a
priori. These variations can be observed by means of
position detection systems located either on-board
the vehicle (GPS-with WAAS, as EGNOS) or on the
infrastructure (VIP, Inductive Loops, W SN based
on magnetometers, etc.).
The analyses illustrated hereinunder are aimed at
providing a real time estimate of the risk of accident
for an approach of road intersections regulated by
traffic lights: this information can then be used by an
ADAS, which supplies the driver a risk indicator of
the instrument panel; such indicator should be able
to resort to information which is usually not
available to the driver or which – in any case –
he/she cannot calculate in real time, namely: the
road in front of him/her (navigator instrument panel)
the residual time to the triggering of the red light and
the clearance time (I2V), the comparison between
the driving dynamics and the safe crossing or
stopping conditions. This would allow assessing
whether or not a situation is hazardous and – if it is –
trying to avoid the potential collision by transmitting
alert messages to the potentially involved vehicles.
In the analysis of the safety conditions, we have
applied risk indexes formulated on the basis of the
vehicle position and speed information.
5 DRIVER’S BEHAVIOUR AND
RISK INDEXES
The study of the risk of the single vehicle
approaching the intersection is strictly linked to the
study of the dilemma zone and – subsequently – to
the distances required to clear the area and stop
depending upon the course state adopted by the
vehicle. Two specific indicators have therefore been
formulated: the former is relevant to the overall
clearance of the intersection and latter refers to the
complete stop of the vehicle in correspondence to
the stop line. Literature proposes various approaches
to risk assessment (Rausand, 2011), yet those
hereafter described have been originated by our
proposal, having in mind a simple approach, at least
at this level of analysis.
On the grounds of the analyses described, ratios
have been formulated to determine – as a result of
the identification of the dilemma zone – simple risk
indexes on the basis of specific input data.
With reference to a determined time instant (at a
given spatial position D), the risk index relevant to
the stop manoeuvre (IR_stop or IR1) is defined by:
RoadSafetyatIntersectionsControlledbyTrafficLights-IVCandRiskIndexes
573

IR1= IR_stop= D_stop / D (3)
where:
D_stop is the distance – computed from the stop
line – the vehicle needs to stop – in full safety
conditions – before or in correspondence to the stop
line (stop distance as previously defined);
D is the distance – measured from the stop line –
where the vehicle is at the time taken into
consideration.
According to the report we have presented above, a
null or almost null risk index represents the fully
safe condition (D >>D_stop), since the vehicle can
stop without the risk of occupying the intersection,
even if partially. Values of IR_stop ≥1, on the other
hand, detect potentially hazardous conditions (D
<<D_stop) for safe stopping. Values of IR_stop
included between 0 and 1 indicate almost totally safe
or almost risky conditions, depending on whether
they are closer to zero or to one.
Likewise, a risk index has been defined as
related to complete intersection clearance
manoeuvre (IR_clearance or IR2) :
IR2 = IR_clearance = D / D_clearance (4)
where:
D is the distance – measured from the stop line,
where the vehicle is at the instant taken into account;
D_clearance is the clearance distance; such
distance, which is computed starting from the stop
line, ensures the vehicle the complete clearance of
the whole intersection, in full safety conditions,
during the yellow light stage (relevant to its
manoeuvre) or – in case –during the all red stage.
For the sake of greater security, the all red stage has
been considered as equal to zero (an all red stage is
present in reality, even though it is rather limited).
By this choice, we have intended to allocate the all
red as safeguard fraction for those whose behaviour
– perhaps because of slower reflexes – is not within
the average one which was computed in these
analyses; an advanced ADAS system may include
the transmission on board of the all red time,
consequently modifying the risk conditions; setting
such value to zero would allow providing a risk
indicator even to vehicles which are not equipped
with ADAS-IVC.
Values of IR_clearance close to zero identify full
safety conditions (D <<D_clearance) – i.e. where the
vehicle can fully clear the intersection by the end of
the yellow light stage relevant to its manoeuvre -
also for the risk index connected to the clearance
manoeuvre. On the other hand, values of risk
relevant to clearance which are greater than or equal
to one would identify potentially risky situations (D
>>D_clearance) for the overall clearance of the area
in full safety conditions. Values of IR_clearance
included between 0 and 1 indicate, almost fully safe
or almost risky conditions, depending upon their
being closer to zero or to one.
This section of analysis focused on the behaviour
– and relevant criticalities – of the different drivers
who approach intersections governed by traffic
lights at the moment the yellow light is triggered.
The analysis of a single vehicle is not aimed at
assessing the consequences of the potential accident;
it merely intends to evaluate how much a vehicle -
depending upon its dynamics and on the driver’s
behaviour – is exposed to the risk of accidents: it is a
kind of assessment of the exposure to the risk, rather
than an estimate of the risk itself.
A numerical calculation tool has been created for
such study so that – after the introduction of specific
data into the case in exam – the presence and
extensions of the dilemma zone could be assessed
Fig.4, as well as the value of the risk indexes (of not
completing the manoeuvres of either stop or
complete clearance of the intersection by the end of
the yellow light or – in case - all red stages) and if
there is the actual risk of accident. The tool
reproduces the motion of a single vehicle
approaching a traffic signal and provides also
graphic outputs for the variation of the risk indexes
as a function of the initial speeds which can be
assumed for the vehicle in exam.
With reference to the three t
pra
values which have
been taken into consideration in the analyses (i.e. 2.3
– 1.46 – 1.1 seconds), the presence and variation of
the dilemma area have been investigated to reach the
definition of risk indexes relevant to both the
clearance and stop manoeuvres; such indexes
highlight what the most advantageous or least
disadvantageous manoeuvres would be for the
drivers of the analyzed vehicle (see the analysis of a
specific situation in Fig. 5).
In order to detect the risk of the vehicle when
approaching the traffic signal, we can assume to
update its risk level at different positions before the
stop bar. Since the feasible deceleration rates for
vehicles fall usually in a quite limited range (a
typical range might be between 3 and 5 m/s
2
),
progressive sections along the approaching lanes can
be defined to trace its speed and compare it with the
expected value in case of stopping from that
distance.
The first of these checking points (named section
“A”) is defined assuming a deceleration rate of 3
m/s
2
and is 64m before the stopping bar, for a
ICINCO2012-9thInternationalConferenceonInformaticsinControl,AutomationandRobotics
574
vehicle moving with a speed of 50km /h.
V
ariation of position and extension of the dilemma zone
0,00
20,00
40,00
60,00
80,00
100,00
120,00
140,00
160,00
180,00
0 102030405060708090100
Speed [km/h]
Distances from the stop line [m]
Stopping distance
Clearance distance
V
ariation of position and extension of the dilemma zone
0,00
20,00
40,00
60,00
80,00
100,00
120,00
140,00
0 102030405060708090100
Speed [km/h]
Distances from the stop line [m]
Stopping distance
Clearance distance
Figure 4: Numerical methodology for the analysis of the
dilemma area and relevant diagrams.
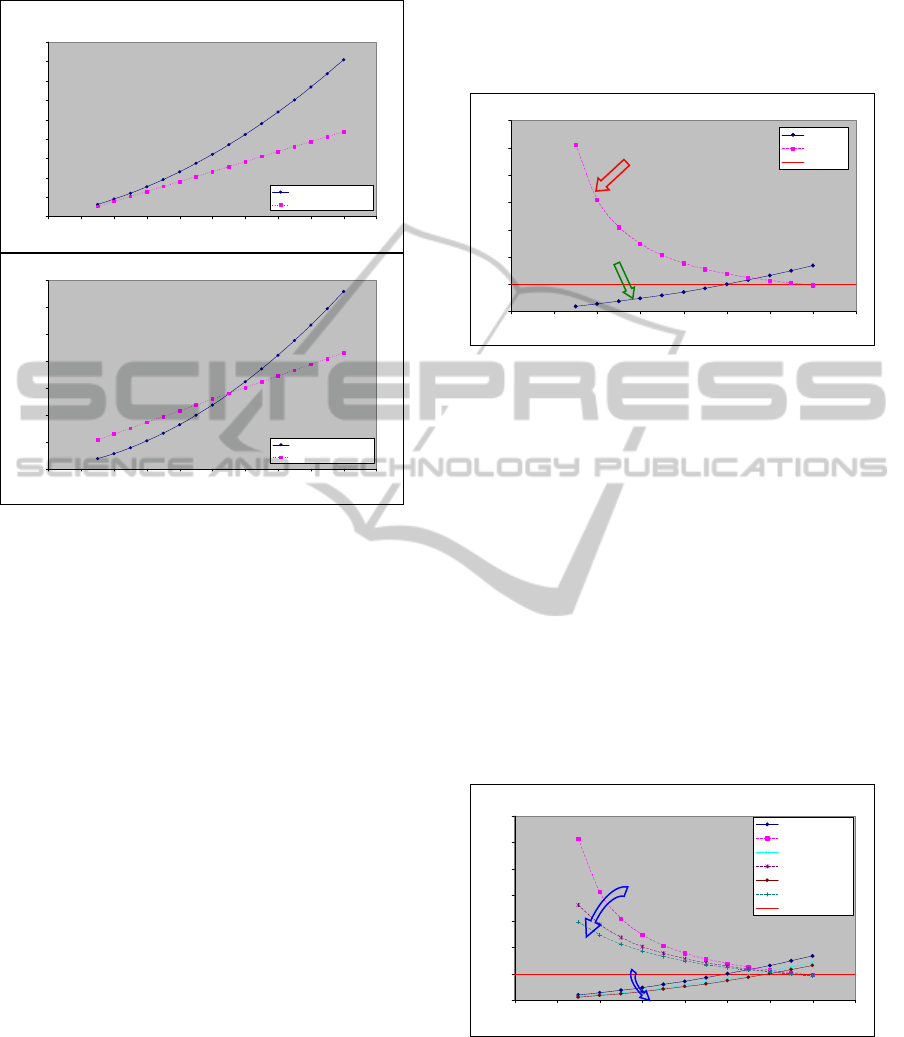
Fig.5. shows – as related to this specific section
(section “A”) - how IR_stop (IR1) grows linearly
with the increase of the speed even though the other
conditions remain the same, whilst IR_clearance
(IR2) decreases in an almost exponential trend.
It is worth noticing that the portions of curves
above the threshold of IR = 1 (which is displayed in
red in the diagrams) identify risky situations. If – at
a given speed – at least one of the two IR were
below such threshold, the manoeuvre to be
recommended would be the one which corresponds
to it (by a communication on board the vehicle).
If both the IR’s were below such thresholds, then
either manoeuvre would not be severely risky and -
in any case – it would be appropriate to provide
indications on board to apply the safest one, i.e. the
one which is farther from the threshold. In those
case where - at a given speed – both indexes were
exceeding the IR =1 threshold, then – even though
the safety conditions are lacking- it would be
appropriate to provide communications on board to
apply only the manoeuvre that – between the two
ones – would involve lower risk (i.e. the one which
is closer to the threshold) or to communicate the risk
condition to the other vehicles which are
approaching the intersection.
Although here only the risk indexes related to
section “A” have been reported, an ADAS can easily
update this simple estimation, while the vehicle is
approaching the intersection and recognize critical
cases by following the evolution of these risk
indexes over space/time.
Trends of Risk Indexes in section "A"
0,00
1,00
2,00
3,00
4,00
5,00
6,00
7,00
0 1020304050607080
Speed [km/h]
Risk Indexes [-]
I.R.1
I.R.2
threshold
Hazardous Manoeuvre
Safety Manoeuvre
Figure 5: Trend of the risk indexes relevant to the
clearance and stop manoeuvres related to a given section
and to a specific t
p,r,a
as a function of the speed.
Two typologies of use of the information on the
risk indexes above can then be identified. In
particular, if the data can be detected in real time,
the driver could be informed onboard of a
potentially hazardous situation (which might occur if
he/she kept such driving behaviour) using – if
required – purposely-allocated algorithms to predict
the trend of the vehicle on the basis of the data
detected from the monitoring; another use, which is
strictly linked to the utilization of the diagrams
obtained, would be detecting – in case the vehicle
were already within the dilemma zone – the lowest
risk manoeuvre and sending a message on board to
inform the driver.
Comparison of trends of Risk Indexes in section "A"
0,00
1,00
2,00
3,00
4,00
5,00
6,00
7,00
0 1020304050607080
Speed [km/h]
Risk Indexes [-]
IR1_tp,r,a=2,3s
IR2_tp,r,a=2,3s
IR1_tp,r,a=1,46s
IR2_tpra=1,46s
IR1_tpra=1,1s
IR2_tpra=1,1s
threshold
↓
IR2
↓
IR1
Figure 6: Comparison diagram of the risk indexes as a
function of the speed, relevant to a given section,
according to the three t
p,r,a
which have been taken into
consideration.
Furthermore, the effects of using communication
technologies between the infrastructure and the
RoadSafetyatIntersectionsControlledbyTrafficLights-IVCandRiskIndexes
575
vehicle have been assessed reducing - in the
analysed situations – the driver’s t
p,r,a
from 2.3 s to
1.46 s and 1.1 s, leaving the other conditions
unchanged.
Fig.6 reports an example of a diagram which
summarizes the curves of the risk indexes assessed
for the three different t
p,r,a
. It is worth noticing how –
as a result of the reduced t
p,r,a
- the risk indexes
relevant to both the clearance and stop manoeuvres
result to be reduced as well.
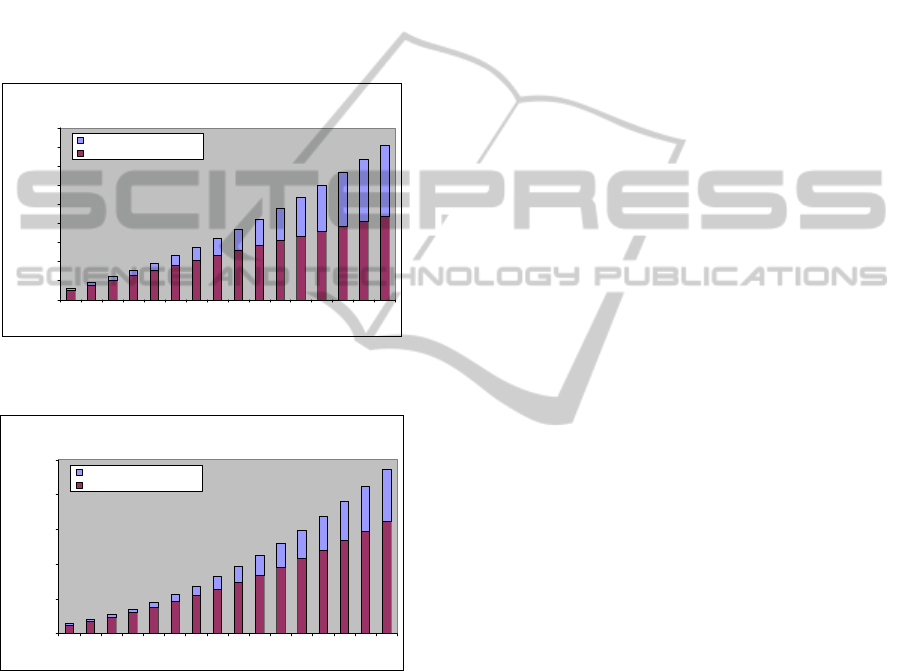
Figure 7 and 8 report the trends and lengths of
the dilemma zone, related to the distance needed
respectively to free the crossroad area or to stop.
Trend and length of the dilemma zone
0,00
20,00
40,00
60,00
80,00
100,00
120,00
140,00
160,00
180,00
15 20 25 30 35 40 45 50 55 60 65 70 75 80 85 90
Speed [km/h]
Distance from the stop line [m]
Length of the dilemma zone
Clearance distance
Figure 7: Trend and length of the dilemma zone, related to
the distance needed to free the crossroad area.
Trend and length of the dilemma zone
0,00
50,00
100,00
150,00
200,00
250,00
15 20 25 30 35 40 45 50 55 60 65 70 75 80 85 90
Speed [km/h]
Distance from the stop line [m]
Length of the dilemma zone
Stopping distance
Figure 8: Trend and length of the dilemma zone, related to
the distance needed to stop.
6 CONCLUSIONS
In this work an ADAS for traffic signal approaching
has been analysed and two main roles have been
considered:
provide a risk estimation for alternative
manoeuvres (stopping or clearance) and then
communicate the driver the less hazardous
manoeuvre on the basis of known, measured or
estimated parameters;
reduce the risk level, by reducing the driver
perception and reaction time, since IVC increase the
level of attention of the driver.
The experiments run in simulation by means of a
spreadsheet have led to acknowledge – as a result of
the reduction in the t
p,r,a
, - a corresponding reduction
in the estimated risk of accidents. The positive
effects of the infrastructure–vehicle communication
have been ascertained in terms of reduced exposure
to the risk by a single vehicle (analyses of the trend
of the single vehicle approaching the intersection
regulated by traffic lights). More specifically, as
related to the behaviour of a driver at the moment
the yellow light is triggered for his/her traffic
stream, the application of I2V systems
(corresponding to a reduction in the t
p,r,a
), the
following has been observed:
reduced extension of the dilemma zone;
disappearance of the dilemma zone and growth
of the zone of choice : in some cases, as a result of
the increased level of attention in order to attain
standard values, i.e. tp,r,a equal to 1,46 s and –in a
large number of cases relevant to the forwarding of
alert messages – tp,r,a equal to 1.1 s ;
the decreasing of the risk indexes relevant to the
stop (IR1 o IR_stop) and clearance (IR2 o
IR_clearance) manoeuvres, mainly in
correspondence to the speed values corresponding to
IR values which were far greater than the safety
threshold (IR=1): in correspondence to very low
speeds for IR2 and high speeds for IR1;
the advanced knowledge of IR1 and IR2, with
the subsequent opportunity to warn the drivers on
board (possibly before they enter the dilemma zone)
about the lowest risk manoeuvre to be undertaken:
such potential is useful mainly in those cases where
both IR’s result to be above the safety threshold
IR=1;
the opportunity to reduce instantaneously, and
therefore in real time, the risk or – better – the
exposure to the risk - of not completing in full safety
conditions the manoeuvre which is intended to be
undertaken by the end of the yellow light stage.
In short, the results of the analyses show that the use
of the I2V e V2I communication systems in the
intersections regulated by traffic lights – assumed in
the processing as directly related to a reduction of
the tp,r,a - has beneficial effects on road safety as
related to the reduction of risks of accidents.
Furthermore, the analyses performed allow
supporting also the combined use of sensors, to
enable the most viable continuous monitoring and
assess the dilemma zone and the potential risk of
ICINCO2012-9thInternationalConferenceonInformaticsinControl,AutomationandRobotics
576

accident instantaneously and in real time.
It is also worth specifying that the analyses did
not consider any actual data on the use of the I2V
technologies – since they are not available to date –
or any active intervention on the vehicle in case of
need.
The subject is in evolution and many questions
remain open. For example an investigation of
vehicle behaviour, when it is not isolated in
approaching the traffic signal, need more tests,
possibly also with a traffic micro-simulation tool. It
can be assumed that the actual potential of the
systems which have been taken into consideration
could be assessed once said technologies are widely
spread on the market.
REFERENCES
Archer J., 2005. Indicators for traffic safety assessment
and prediction and their application in micro –
simulation modelling: A study of urban and suburban
intersections. Doctoral Thesis; Royal Institute of
Technology, Stockholm, Sweden.
Benz T., Gaitanidou E., Spyropoulou I., Yannis G., and
Tapani A.,2006. Modelling road traffic safety - The
In-Safety approach. In Proceedings of the 13th World
Congress and Exhibition on Intelligent Transport
Systems and Services, ERTICO, London.
COOPERS project CO-OPerativeSystEms for Intelligent
Road Safety - (accessed March 07, 2012)
http://www.coopers-ip.eu/index.php?id=project.
CoVeL - Cooperative Vehicle Localization for Efficient
Urban Mobility (accessed March 07, 2012)
http://www.covel-project.eu/.
CVIS Cooperative Vehicle-Infrastructure Systems
(accessed March 07, 2012)
http://www.cvisproject.org/.
Dalla Chiara B., Deflorio F. P., Diwan S., Assessing the
effects of inter-vehicle communication systems on
road safety, IET Intelligent Transport Systems, June
2009, IET Intell. Transp. Syst., 2009, Vol. 3, Iss. 2, pp.
225–235, doi: 10.1049/iet-its:20080059.
Day C. M., Premachandra H., Brennan T. M., Sturdevant
J. R., Bullock D. M., Operational Evaluation of
Wireless Magnetometer Vehicle Detectors at
Signalized Intersection, Transportation Research
Record 2192.
FHWA (2006). Traffic Detector Handbook: Third Edition
Chapter 4. http://www.fhwa.dot.gov (accessed March
07, 2012).
FOTsis - European Field Operational Test on Safe,
Intelligent and Sustainable Road Operation (accessed
March 07, 2012) http://www.fotsis.com/.
Gettman D. & Pu L., 2006. Theoretical validation of
Surrogate Safety Assessment Methodology for
roundabouts and cross intersections. In Proceedings of
the 13th World Congress and Exhibition on Intelligent
Transport Systems and Services, London.
Hurwitz, D. S., 2009. Application of Driver Behavior and
Comprehension to Dilemma Zone Definition and
Evaluation. Open Access Dissertations. Paper 112,
University of Massachusetts.
INTERSAFE-2 – Cooperative Intersection Safety
(accessed March 07, 2012) http://www.intersafe-
2.eu/public/
Johansson G., Rumar K., 1971. Driver's brake reaction
times. Human Factors, 13(1), pp. 23-27
Ki-Joon K., Jaehoon S., 2009. Development of
Intersection Traffic Accident Risk Assessment Model
- Application of Micro-simulation Model with SSAM
to Sungnam City. In IRTAD CONFERENCE, Seoul,
Korea.
Klunder G., Abdoelbasier A., Immers B., 2006.
Development of a micro-simulation model to predict
road traffic safety on intersections with surrogate
safety measures. In Proceedings of the 13th World
Congress and Exhibition on Intelligent Transport
Systems and Services, London.
Liu C., Herman R. and Gazis D.C., 1996. A review of the
yellow interval dilemma, Transportation Research Part
A: Policy and Practice, 1996, vol. 30, issue 5, pages
333-348.
MacNeill, P. Miller, R., 2003. A new technology for a
cruise control system A new technology for a cruise
control system. IEEE Vehicle Technology Conference
Maile M., Delgrossi L., 2009. Cooperative intersection
collision avoidance system for violations (CICAS-V)
for avoidance of violation-based intersection crashes.
Enhanced Safety of Vehicles.
Monteil J., Billot R., El Faouzi N. E., 2011. Towards
cooperative traffic management: methodological
issues and perspectives. In Australasian Transport
Research Forum 2011 Proceedings, 28 - 30 September
2011, Adelaide, Australia.
Morsink P. L. J., Wismans L. J. J., Dijkstra A., 2008.
Micro-simulation for road safety impact assessment of
advanced driver assistance systems. InEuropean ITS
Congress, Geneva.
Rausand M., Risk Assessment, 2011. Theory, Methods,
and Applications, Norwegian Univ. of Science and
Technology, ISBN: 978-0-470-63764-7, September
2011.
SAFESPOT Integrated Project (accessed March 07, 2012)
http://www.safespot-eu.org/.
Tapani A., 2009. Traffic simulation modelling of driver
assistance systems. In 16th World congress on ITS.
Torday A., Baumann D., Dumont A. G., 2003. Road
safety assessment using micro simulation based
indicators. Proc. of the ITS World Congress, Madrid.
U.S. Department of Transportation Federal Highway
Administration,2009.Surrogate Safety Assessment
Model (SSAM).
U.S. Department of Transportation, Cooperative
Intersection Collision Avoidance System Limited to
Stop Sign and Traffic Signal Violations (CICAS-V),
Task 8 Final Report, Prototype Build and Testing,
(Appendix F), June 24, 2008, August 29, 2008.
RoadSafetyatIntersectionsControlledbyTrafficLights-IVCandRiskIndexes
577
