
Sensitivity Analysis in Bed Capacity Studies including the Medical
Staff’s Decision Making
Cristina Azcárate
1
, Julio Barado
2
and Fermín Mallor
1
1
Department of Statistics and Operations Research, Public University of Navarre, Campus Arrosadia, Pamplona, Spain
2
Intensive Care Unit, Hospital of Navarre, Irunlarrea 3, Pamplona, Spain
Keywords: Simulation, Decision Making Modelling, Sensitivity Analysis, Intensive Care Unit, Bed Capacity.
Abstract: This paper deals with capacity planning studies in intensive care units (ICU). Our aim is to provide a
framework in which the discharge policy from an ICU can be modelled and included in a simulation model.
This is a very unique contribution of this research. We highlight the influence of the assumed policy in the
ICU quality of service. A high quality of service means a low percentage of rejected patients and a length of
stay in the ICU as long as necessary for the patient recovery. We introduce a parameterized set of rules to
mathematically model the discharging decisions made by the physicians of an ICU. Then we present a
sensitivity study carried out for the ICU of the Hospital of Navarra in Spain. The set of discharge policies is
represented in the space of the performance measures to distinguish efficient from no efficient policies.
Finally, the sensitivity analysis is extended, firstly, by considering variation in the number of beds and, then,
by varying the patient arrival ratio.
1 INTRODUCTION
The Intensive Care Unit (ICU) is a key area within
hospitals caring for critically ill patients. The beds
and the specialized staff of an ICU are costly
resources and then the ICU managers should balance
the contradictory goals of providing a high quality
health service and minimizing the operating costs.
Simulation has been widely used to tackle
health-care system management and operation
problems. Recent reviews dealing with the
application of simulation modeling in health care
can be found in (Brailsford et al., 2009), (Eldabi et
al., 2007), (Günal and Pidd, 2010), and (Katsaliaki
and Mustafee, 2010). Many studies use simulation to
analyze hospital capacity and bed allocation, but
only a few deal specifically with ICUs. Among these
Kim et al., in a series of papers (1999, 2000 and
2002), developed a simulation model of an ICU in
Hong Kong to study the unit’s capacity utilization
and the quality of care provided to its patients. They
also considered, (Kim et al., 2000), the conflict
between ICU physicians and the operating surgeons
when these last ones proposed to reserve some ICU
beds exclusively for elective surgery. Authors used
the simulation model to explore the implications of
these bed-reservation strategies. In (Kim and
Horowitz, 2002) the analysis is extended by using a
daily quota system for the elective surgery together
with the knowledge of a 1-week or 2-week
scheduling window. Similarly, (Kolker, 2009) also
developed a simulation model to determine the
maximum number of elective surgeries per day that
should be scheduled in order to reduce diversion of
an ICU to an acceptable low level.
(Litvack et al., 2008) analysed the bed capacity
problem in the ICUs of several hospitals in a region
on the Netherlands. They proposed a cooperative
solution that is found by a mathematical method
inspired by overflow models in telecommunication
systems. Simulation is only used here to assess the
quality of the provided solution.
(Ridge et al., 1998) developed a simulation
model for bed planning in an ICU. They studied the
relationship between the number of beds and the
percentage of patients that have to be transferred
because of lack of bed space. The authors performed
a sensitivity analysis by varying the number of ICU
beds but also by considering different admission
rules by varying the planned patients deferral
periods and by changing the number of beds
reserved for emergency admissions.
They also pointed out that the “early discharge”
of the more able patients to alternative wards is a
548
Azcárate C., Barado J. and Mallor F..
Sensitivity Analysis in Bed Capacity Studies including the Medical Staff’s Decision Making.
DOI: 10.5220/0004165305480555
In Proceedings of the 2nd International Conference on Simulation and Modeling Methodologies, Technologies and Applications (HA-2012), pages
548-555
ISBN: 978-989-8565-20-4
Copyright
c
2012 SCITEPRESS (Science and Technology Publications, Lda.)

solution commonly adopted to cope with insufficient
number of ICU beds. Nevertheless, they did not
included an “early discharge” operating rule within
the model. Costa et al. (2003) extended these models
and discuss detailed mathematical models for the
number of beds required by an ICU to meet its own
individual workload.
In the medical specialized literature we also find
studies reporting that admissions and discharges are
triaged when enough beds are not available (e. g.,
(Snuff et al. 2004) and (Costa et al. 2003)). As a
consequence, the number of patients who are
rejected from admission increases and the length of
stay gets shortened.
The aim of the research presented in this paper is
to provide a framework in which the discharge
policy from an ICU can be modeled and used in a
capacity planning study by using simulation. We
will highlight the influence of the assumed policy in
the ICU quality of service. We identify two
dimensions for this quality of service: the first one
-of a social character- is the percentage of
population that can benefit from it when needed. The
second one -of an individual character- is the degree
of recovery reached by a patient when is discharged
from the ICU. A high quality of service means a low
percentage of rejected patients and a length of stay
(LoS) in the ICU as long as necessary.
The paper is organized as follows. Section 2
describes the mathematical modelling of the
discharging decisions made by the physicians of the
ICU. In section 3 we present a sensitivity study
carried out for the ICU of the Hospital of Navarra in
Spain. We introduce the performance measures to be
considered and represent the set of discharge
policies in the space of the performance measures to
distinguish efficient policies from no efficient ones.
Then the sensitivity analysis is extended, firstly, by
considering variation in the number of beds and,
secondly, by varying the patient arrival ratio.
Finally, we end the paper with a section of
conclusions and final remarks about the usefulness
of our approach.
2 MATHEMATICAL
MODELLING OF
DISCHARGING DECISIONS
Decisions made by the ICU doctors concerning the
discharge of patients have the ultimate purpose of
controlling the level of bed occupancy in the ICU,
by balancing the full recovery of the current patients
and the bed availability for future ones. Then any
ICU mathematical model, in general, and simulation
model, in particular, developed to be used in the
study of the bed capacity problem should include
this doctor’s ability to control the number of
occupied beds.
In (Mallor and Azcárate, 2012) it is showed that
it is crucial to incorporate the management decisions
made by the clinical staff to obtain valid ICU
simulation models. Discharge decisions are made in
order to keep the number of occupied beds in levels
neither too high (to compromise the incoming of
new patients) nor too low (to “waste” expensive
resources). Depending on the clinical situation of the
patient and on the bed occupation rate at that
moment, the discharge of a patient may be slightly
advanced or delayed if considered safe to do it.
Furthermore, there is no written protocol to
automatically determine the patient discharge time;
these decisions are subject to the judgment of the
intensive care consultant. From a mathematical point
of view, this means that the state of “enough
recovery” of a patient to safely leave the ICU is not
a discrete event that can be easily identified on the
time axis but an ambiguous time interval subject to
the intensive care physician assessment.
We took into account these considerations to
model the discharge decision of a patient depending
on the bed occupancy level. Specifically, we
consider two kinds of discharge rules. These rules
are based on the idea that the recovery of a patient is
a continuous process that leads to its ICU discharge
in a time that take values in an interval of admissible
values (see Figure 1). The main idea is to compare
the time already spent in the ICU, TS, with regard to
the length of stay, LoS, which was simulated for
each one of the patients occupying an ICU bed. We
define the LoSR (LoS ratio) as TS/LoS. Then,
if bed occupancy level i is high and the time
already spent in the ICU is sufficiently high
(specifically, if (1- LoSR) is less than a value
PRi% and (LoS-TS) less than DRi days), a
patient leaves the ICU in advance (the one in
the best health condition, which means the one
with the greatest LoSR).
Figure 1: Patient recovery and ICU discharge.
Entry Recovery
Limit for early
discharge
PRLoS 100%
DRDaysN º
High occup.
Low
occup.
Extended
Stay
Sensitivity Analysis in Bed Capacity Studies including the Medical Staff's Decision Making
549

if bed occupancy level i is low then the LoS of
a patient is increased in one day with certain
probability, PIi. There is a maximum of days
DEi that the LoS of a patient can be extended.
These rules can be identically defined for all type
of patients or they can be different for different
groups of patients. For example, we could
distinguish the group of programmed-surgery
patients -usually whit a short LoS- and consider that
it can only be shortened in one day with certain
probability PC
i
when bed occupancy level is i.
These set of rules defines infinite management
policies for the ICU: one for each set of parameter
values. To choose the rule that better fit the decision
making process in the ICU, in (Mallor and Azcárate
2012), we formulated an optimization problem with
the aim of matching as much as possible the output
of the simulation with the ICU historical data (see
Figure 2).
The decision variables are the parameters PR,
DR, PI, DE and PC above defined. Constraints
represent realistic monotonous relationships into
each set of parameters and upper bounds for their
values (uPR, uDR, uPI, uDE and uPC). The number
of ICU beds is denoted by n and by k1 and k2 the
boundaries for low and high occupancy levels,
respectively. We set as objective function to
minimize the squared differences of both occupancy
bed frequency distributions: the one observed in the
real ICU, real_freq(i), and the one obtained from the
simulation output, simul_freq(i). The proposed
optimization problem can be solved by combining
simulation and optimization techniques. The
optimizer produces a sequence of solutions whose
performance is tested in the simulator.
Figure 2: Optimization problem to determine the
parameter values of the medical management rules.
3 SENSITIVITY ANALYSIS
The discharge policy is influenced by the occupancy
level which also depends on the bed availability and
the input rate of patients. Then a bed capacity study
should take into account variability in management
policies. We show in this section that main
performance measures greatly depend on the
adopted policy.
3.1 Case Study. Parameterization of
The Rules
In a first step of our research we developed a
simulation model that included the representation of
the medical decisions made at the ICU of the
Hospital of Navarre, in Spain, following the
methodology presented in Section 2.
The Hospital of Navarra is a general public
hospital with reference specialties in the Community
of Navarra (Neurosurgery, cardiac surgery, vascular
surgery, oncology, infectious diseases, etc.). It has
483 beds, 2015 members of staff and 10 surgery
rooms. The ICU of this hospital has 20 beds and 86
physicians and nurses. It receives patients from 3
sources (emergency, operating theatre and ward).
A thorough data analysis was conducted to
obtain good statistical models for the arrival pattern
and LoS of each of the 8 groups of patients
considered. The necessary data for the statistical
estimation were recorded and provided by the
Hospital administration. We used two files: a patient
file and a bed occupancy file, containing 9 years of
data. The patient file includes all records of patients
attended in the ICU. For each patient the following
variables are known: age, arrival date, illness group
(8 groups were considered), output date, APACHE
(illness severity), infections in the ICU, and exitus
(recovered or died). The bed occupancy file records
the number of occupied beds at 4 p.m., each day. It
was used to validate the simulation model.
Cardiac surgery patients are special patients in
the performance of this ICU and represent 1/3 of the
total amount of patient arrivals.
We simulate the ICU model under different rules
to analyse their influence in a set of performance
measures. In order to make an easier comparison of
the results we simplify the structure of values that
can take the decision rule’s parameters. We
distinguish two levels for the state of high bed
occupancy:
moderate high occupancy (75%-85%): when
there are a number of occupied beds from 15
to 17. It is denoted by level h1, and
very high occupancy (+85%): when there are a
number of occupied beds from 18 to 20. It is
denoted by level h2.
Low occupation levels are also reduced: level l1
from 1 to 8 beds, and level l2, from 9 to 13 beds.
21 ,11 2integer
0...
0.....
0.....
0...
0...
)(_)(_
21
11
11
21
21
0
2
kk,...,kj,...,nkni ,DIDR
PCPCPCuPC
PIPI uPI
DEDEuDE
PRPRPR uPR
DRDRDR uDR
tosubject
ifreqsimulifreqrealMin
ji
knnn
k
k
knnn
knnn
n
i
SIMULTECH 2012 - 2nd International Conference on Simulation and Modeling Methodologies, Technologies and
Applications
550

In the presentation of the results we focus on the
decisions concerning the situation of high
occupancy, because they are more difficult to
manage and more important for the patient health.
We consider the following parameters related with
early discharges:
PC
hj
: the probability of reduction in 1 day the
LoS of cardiac surgery patients, with normal
post-surgery evolution, when bed occupancy
level is hj, for j=1,2.
PR
hj
: the percentage of reduction in LoS when
bed occupancy level is hj, for j=1,2.
DR
hj
: upper limit for the reduction in the
number of LoS days when bed occupancy
level is hj, for j=1,2.
Observe that the last four parameters do not
affect to cardiac surgery patients, with normal post-
surgery evolution.
Consequently, an early discharge policy is
described by a vector of 6 values: two for the cardiac
surgery patients and four for the other patient
groups.
We also consider the following four parameters
related with extended discharges:
PI
lj
: the probability of one-day increase in LoS
when bed occupancy level is lj, for j=1,2.
ER
lj
: upper limit number of LoS days
increased when bed occupancy level is lj, for
j=1,2.
3.2 Efficient Discharge Policies
Two are the main objectives of an ICU: it should
provide service to all patients that can benefit from it
and it should provide a full service to all admitted
patients. The first objective means that no patient
should be rejected because the ICU is full and the
second one means that no LoS should be reduced,
risking a full recovery, because the occupied bed is
needed. Based in these two objectives, two
performance measures can be defined:
percentage of rejected patients. Emergency
patients arrive at random and they are
transferred to other hospitals -which is no
desirable- if they cannot be immediately
admitted. In the past, the lack of beds caused
to postpone surgeries. Nowadays, no surgery
is canceled due to the lack of operating rooms,
and the patients are also transferred to other
health facilities in the region, if necessary.
percentage of shortened days. To calculate
this measure the truncated LoS and the “ideal”
LoS for each patient should be known. This
information is not included in ICU databases.
At least this is not reported in the literature
neither the ICU of the Hospital of Navarra
records it. Nevertheless, this information is
collected from the simulation model, because
a LoS -which is considered as the “ideal” LoS
- is simulated from the estimated statistical
model, when a patient is created. The
performance measure is obtained as the ratio
of the sum of the shortened days for all
patients to the sum of the LoSs of all patients.
To conduct the sensitivity analysis, we vary the
value of some parameters into different ranges while
other parameters have a fixed value. Varying and
fixed parameters are included in tables 1 and 2,
respectively.
Table 1: Set of variation for parameters PR
hj
and PC
hj
.
Parameters
Set of values
PR
hj
for j=1,2
0, 5, 10, 15, 20
PC
hj
for j=1,2
0, 10, 20, ... , 90, 100
Table 2: Parameters with fixed values.
Parameters
Fixed values
DR
h1
2
DR
h2
3
PI
l1
0
PI
l2
15
ER
lj
for j=1,2
2
Observe that monotonicity conditions imply that
PC
h2
>= PC
h1
and
PR
h2
>= PR
h1.
This leads to
15x66=990 different combinations of values for
parameters PR
h1,
PR
h2
, PC
h1
and PC
h2.
Each
combination denoted by (PR
h1
, PR
h2
, PC
h1
, PC
h2
)
defines a different discharge policy. For example, (5,
10, 30, 60) means that in case of occupancy level
from 15 to 17, with probability 0.3, the LoS of a
cardiac surgery patient is shortened in one day
while, for the rest of patients, in a maximum of 5%.
In case of bed occupancy level from 18 to 20, the
probability of one-day reduction increases to 0.6 and
the maximum of LoS reduction increases to 10%.
For each scenario, 100 replications of 50-year
simulation experiments were run, with a 3-year
warm-up period.
Figure 3 shows the representation of the 990
different discharge policies in the objective space.
Policies are grouped by the values of the PR
hj
parameters defining the discharge for a general
patient (that is, a patient of any other group different
of cardiac surgery). We see that the set of all
Sensitivity Analysis in Bed Capacity Studies including the Medical Staff's Decision Making
551
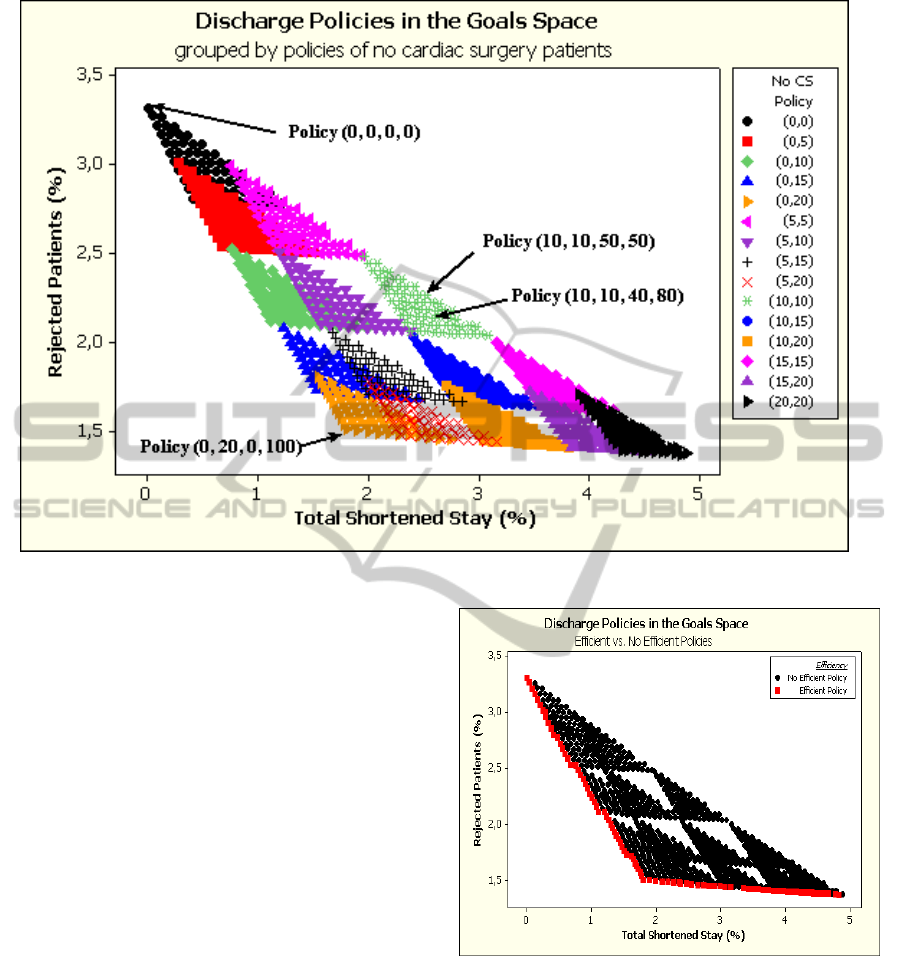
Figure 3: Discharge policies for the present situation: 20 beds.
policies approximately fills a triangle and also the
policies within each group. We can analyse the
trade-off between both objectives. The policy (0, 20,
0, 100) located in one of the corners provides a
percentage of 1.5% of rejected patients and a
percentage of shortened stay of 1.8%. Any
movement from this policy to other policy to get a
reduction of the rejected patients implies a sharp
increase in the shortened stay: from the point (1.8,
1.5) (associated to policy (0, 20, 0, 100)) to the point
(4.9, 1.4) (associated to policy (20, 20, 100, 100) in
the right corner) there is a line of slope -0.03, over
which is located a piece of the Pareto frontier. Then
for each unit added to the percentage of shortened
stay the percentage of rejected patients is reduced
only by 0.03 units. Reasoning in the same way, by
using the policy (0, 0, 0, 0), located in the upper
corner and with associated point (3.3, 0), we get that
reducing by one unit the percentage of shortened
stay implies to increase, approximately (and in the
best of the cases) by one unit the percentage of
rejected patients. Figure 4 shows the same graphical
representation of Figure 3 but now distinguishing
among efficient and no efficient policies. There are
98 efficient policies, which are included in table 3
(see appendix).
Figure 4: Discharge policies: efficient vs. no efficient.
3.3 Bed Capacity Analysis: Increase in
the Number of Beds
Simulation models in health care are frequently used
to assist decision makers in capacity analysis, that is,
the optimal number of resource units to achieve a
determined objective. We have seen in the previous
subsection that the management policy is critical to
reach the desired levels for each objective when
there are conflicting objectives.
SIMULTECH 2012 - 2nd International Conference on Simulation and Modeling Methodologies, Technologies and
Applications
552

We know that the answer of a what if question of
type, “what is the performance of the ICU when one
bed is added?”, will depend on the discharge policy
applied by the medical staff. To answer this question
we have adapted the decision rules to the case of 21
beds. The moderate high occupancy level h1 is now
defined when there are a number of occupied beds
from 16 to 18 and the very high occupancy level, h2,
when there are a number of occupied beds from 19
to 21. The set of parameters for the rules does not
change but we reduce the number of possible values
for the percentage of shortened stay to 3: {0, 10,
15}. The number of policies tested is 396.
We obtain a structure for the representation of
the policies in the objective space similar to the case
of 20 beds. Figure 5 compares both sets of efficient
solutions. We observe that the efficient frontier for
the 21- bed case is almost a translation of the
efficient frontier for the 20-bed case. Each policy
with 21 beds dominates the equivalent with 20 beds.
That is, when the resource is increased and the same
policy is applied then both objectives are improved
at the same time. In both cases, in the corner, is the
policy (0, 20, 0, 100). Its associated point in the 21-
bed case, is (1.24, 0.95) and the objective values
reached by the policies (0,0,0,0) and (20, 20, 100,
100) are (0, 2.23) and (3.73, 0.83), respectively.
Then when we moved out of (0, 20, 0, 100), per each
unit of improvement in the shortened stay, we need
to increase approximately by one unit the percentage
of rejected patients. And conversely, if we wish to
improve the 0.95% rejected patients we would
worsen the shortened stay in one unit to get a
decrease of 0.05 in the rejected percentage.
3.4 Bed Capacity Analysis: Increase in
the Arrivals Rate and the Number
of Beds
When the capacity analysis is done to determine the
resources needed to provide a service in the future it
is necessary to include in the model a prediction of
the future demand.
In this subsection we study the performance of
the ICU under the hypothesis that the patient’s
arrival ratio is increased due to the increase and the
aging process of the population. We consider three
different scenarios: increments of 5%, 10% and 15%
in the arrivals rate. These three scenarios are studied
with both the current capacity and the increased
capacity to 21 beds. Figure 6 shows the 6 Pareto
frontiers. We observe a shape for these frontiers
similar to the one we found in the analysis of the
present arrival rate case. Again in the corner is the
policy (0, 20, 0, 100) and the trade-offs between
objectives keep similar proportions to those found in
section 3.2 and 3.3. The efficient frontier
corresponding to a stress of 1.05 and 21 beds is
similar to the results found for 20 beds in the present
arrival rate. This is because both the service capacity
and the service demand are increased by a 5%. This
Figure 5: Efficient policies for the ICU with 20 and 21 beds.
Sensitivity Analysis in Bed Capacity Studies including the Medical Staff's Decision Making
553
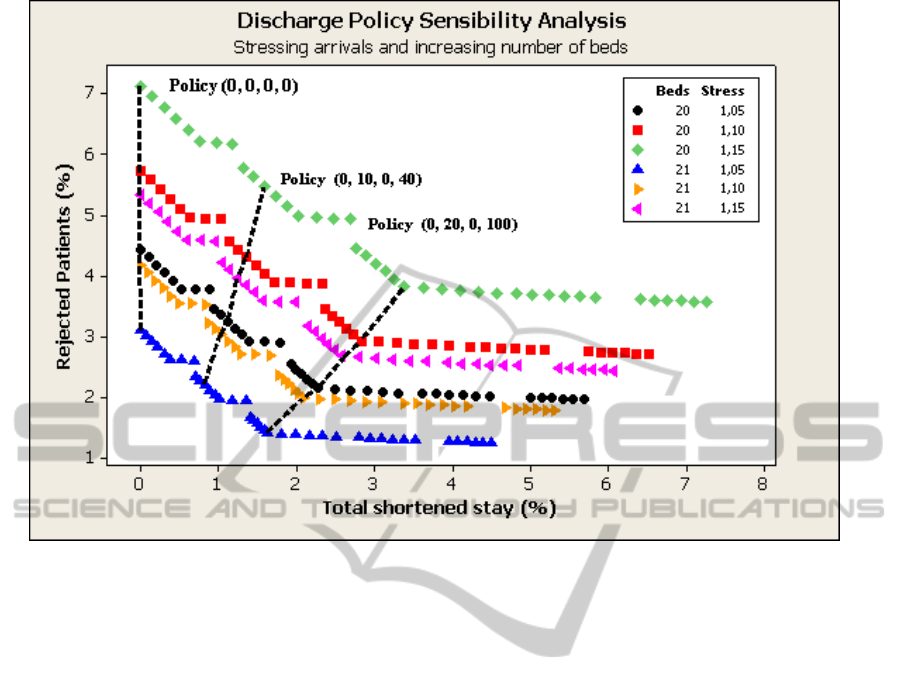
Figure 6: Efficient policies for the ICU with different levels of stress in the arrival rates (20 and 21 beds).
argument also justifies the closeness of frontiers
corresponding to scenario 20 beds and stress 1.05
and scenario 21 beds and stress 1.10.
4 CONCLUSIONS AND FINAL
REMARKS
In this paper we have shown that a bed capacity
analysis in an ICU requires the consideration of the
discharge policy that is applied by the medical staff.
The main effect of this management policy is a
reduction in the LoS of some patients. Then the
percentage of total shortened stay is considered as a
performance measure to catch the degree of
intervention of the medical staff when there is a high
pressure due to lack of beds. This new measure is
studied together with the traditional performance
measure of percentage of rejected patients.
The doctors can find useful the representation of
the discharging policies in the space of goals to learn
about the trade-off between objectives that can be
achieved by modifying the parameters of the rules.
These rules can be interpreted and used by the
doctors as bench marks for their own decision
processes. This constitutes a normative approach to
the discharging policies in the sense that it indicates
how to proceed to get certain levels of quality of
service.
We have also simulated the ICU under the rules
estimated according to the methodology exposed in
section 2, that is, under the rules that better describe
the decision process in the real ICU. The
representation of the results in the space of goals
showed that the point is very close to the Pareto
frontier; specifically, it is located close to the corner
point, in the upper part. Thus, we can conclude that
the medical staff makes decisions almost efficiently
according to both objectives.
REFERENCES
Brailsford, S. C., Harper, P. R., Patel, B., Pitt, M., 2009.
An analysis of the academic literature on simulation
and modelling in health care, Journal of Simulation,
Vol. 3, 130-140.
Costa, A. X., Ridley, S. A., shahani, A. K., Harper, P. R.,
De Senna, V., Nielsen, M. S. 2003. Mathematical
modelling and simulation for planning critical care
capacity, Anaesthesia, Vol. 58, 320-327.
Eldabi, T., Paul, R. J., Young, T., 2007. Simulation
modelling in healthcare: reviewing legacies and
investigating futures, Journal of the Operational
Research Society, Vol. 58, 262 -270.
Günal, M. M., Pidd, M., 2010. Discrete event simulation
for the performance modelling in health care: a review
of the literature, Journal of Simulation, Vol. 4, 42-51.
SIMULTECH 2012 - 2nd International Conference on Simulation and Modeling Methodologies, Technologies and
Applications
554

Katsaliaki, K., Mustafee, N., 2010. Applications of
simulation within the healthcare context, Journal of
the Operational Research Society, Vol. 62, 1431-145.
Kim, S. C., Horowitz, I., Young, K., T. A. Buckley,1999.
Analysis of capacity management of the intensive care
unit in a hospital, European Journal of Operational
Research, Vol. 115, 36-46.
Kim, S. C., Horowitz, I., Young, K., Buckley, T. A., 2000.
Flexible bed allocation and performance in the
intensive care unit, Journal of Operation
Management, Vol. 18, 427-443.
Kim, S. C., Horowitz, I., 2002. Scheduling hospital
services: the efficacy of elective-surgery quotas,
Omega, Vol. 30, 335-346.
Kolker, A., 2009. Process modeling of ICU patient flow:
effect of daily load levelling of elective surgeries on
ICU diversion, Journal of Medical Systems, Vol. 33,
27-40.
Litvack, N., van Rijsbergen, M., Boucherie, R. J., van
Houdenhoven, M., 2008. Managing the overflow of
intensive care patients, European Journal of
Operational Research, Vol. 185, 998-1010.
Mallor, F., Azcárate. C., 2012. Combining optimization
with simulation to obtain credible simulation models
for Intensive Care Units. Annals of Operations
Research. DOI: 10.1007/s10479-011-1035-8.
Ridge, J. C., Jones, S. K., Nielsen, M. S., Shahani, A. K.,
1998. Capacity planning for intensive care units,
European Journal of Operational Research, Vol. 105,
346-355.
Sinuff T., Kahnamoui K., Cook D. J., Luce J. M., Levy M.
M., 2004. Rationing critical care beds: a systematic
review, Critical Care Medicine, Vol. 32, 1588-1597.
APPENDIX
In table 3, we include the 98 efficient discharge
policies obtained when considering the 20-bed ICU
with the present patient arrival ratio. Each policy is
represented by a vector with four components:
(PR
h1
, PR
h2
, PC
h1
, PC
h2
).
Table 3: Efficient discharge policies. The policies are
ordered from the top left to the bottom right of the
objective space.
0
0
0
0
0
0
0
10
0
0
0
20
0
0
0
30
0
0
0
40
0
0
0
50
0
0
0
60
0
0
0
70
0
0
0
80
0
0
0
90
0
0
0
100
0
0
0
80
0
5
0
0
0
5
0
50
0
5
0
60
0
5
0
70
0
5
0
80
0
5
0
90
0
5
0
100
Table 3: Efficient discharge policies. The policies are
ordered from the top left to the bottom right of the
objective space (cont.).
0
5
10
100
0
5
0
80
0
10
0
0
0
10
0
10
0
10
0
20
0
10
0
30
0
10
0
40
0
10
0
50
0
10
0
60
0
10
0
70
0
10
0
80
0
10
0
90
0
10
0
100
0
10
10
100
0
10
0
80
0
15
0
0
0
15
0
10
0
15
0
20
0
15
0
30
0
15
0
40
0
15
0
50
0
15
0
60
0
15
0
70
0
15
0
80
0
15
0
90
0
15
0
100
0
15
0
80
0
20
0
30
0
20
0
40
0
20
0
50
0
20
0
60
0
20
0
70
0
20
0
80
0
20
0
90
0
20
0
100
0
20
10
100
0
20
20
100
0
20
30
100
0
20
40
100
0
20
50
100
0
20
60
100
0
20
70
100
0
20
0
80
0
20
80
100
0
20
90
100
0
20
100
100
5
20
10
100
5
20
30
100
5
20
60
100
5
20
70
100
5
20
80
100
5
20
90
100
5
20
100
100
10
20
40
100
10
20
50
100
10
20
60
100
10
20
70
100
10
20
80
100
10
20
90
100
10
20
100
100
15
20
0
100
15
20
10
100
15
20
20
100
15
20
30
100
15
20
40
100
15
20
50
100
15
20
60
100
15
20
70
100
15
20
80
100
15
20
90
100
15
20
100
100
20
20
0
100
20
20
20
100
20
20
30
100
20
20
40
100
20
20
50
100
20
20
60
100
20
20
80
100
20
20
90
100
Sensitivity Analysis in Bed Capacity Studies including the Medical Staff's Decision Making
555
