
Are we Ready for Science 2.0?
Tim W. Nattkemper
Biodata Mining Group, Faculty of Technology, Bielefeld University, PO Box 100131, D-33501, Bielefeld, Germany
Keywords:
Science 2.0, Knowledge Discovery, Data Mining, Information Visualization, Information Sharing, Semantic
Annotation, Cooperative Data Analysis, Web 2.0.
Abstract:
In this position paper the impact of web development on knowledge discovery and information sharing in
natural sciences and humanities is discussed. While on the one hand the potential of moving data analysis
to the web is huge, one has to deal with fundamental obstacles on both levels: administrative/political and
scientific/algorithmic. Some recent trends in Science 2.0 applications and tools in scientific research are sum-
marized and discussed. Afterwards the reasons for limitations in the Science 2.0 progress are identified. The
paper concludes with the opinion, that information sciences in general and the fields of data mining, visualiza-
tion, statistical learning and applied computer sciences (such as bioinformatics, or medical informatics) have
not kept pace with the development and should reconsider some of their research foci.
1 INTRODUCTION
The world wide web (WWW) is continuously and
dynamically changing regarding its technical fea-
tures, its structure and (consequently) its content.
Many aspects of this change relate to each other
(for instance they are based on one and the same
technical development) and are in sum termed Web
2.0
1, 2
. And although this term is only loosely de-
fined it has become common language in the last
decade. If a new service or web application is in-
troduced it is referred to as a Web 2.0 service if
it owns a subset of the following features: User-
centered Design, Rich Internet Application (RIA),
Dynamic Content (DC), Collaboration/Cooperation
(CC), Software as a Service (SAAS), Decentralisa-
tion of Management/Power/Administration, Crowd-
sourcing, Web and Rich User Experience.
Of course, this development in the WWW towards
Web 2.0 applications itself created new large collec-
tions of structured data, semi-structured data or non-
structured data and stimulated many knowledge dis-
covery and data mining research projects to search
these new data collections for hidden relationships
and patterns (Fayyad et al., 1996; Cooley et al., 1997;
Nasraoui et al., 2008; Gloor et al., 2009; Munibalaji
and Balamurugan, 2012).
But since scientists were massive users of the
1
http://oreilly.com/web2/archive/what-is-web-20.html
2
http://www.techpluto.com/web-20-services/
WWW from its beginning at CERN, this was not the
only reaction of science to the web development in
general and to the Web 2.0 development in particular.
One of the main observations in the advent of the Web
2.0 was that web-based technologies became a major
driving force for the collection of user-generated con-
tent. And parallel to that, science became more and
more quantified and digitized as well. In the natural
sciences, measurement is nowadays carried out with
sensors directly connected to a PC so quantification
is straightforward. This fact has a strong influence on
almost all fields of natural sciences, especially in life
sciences. There, the rapid development of new tech-
nologies for genomic sequencing led to a huge gap
between the large data collections and the computa-
tional methods to analyze the data and to extract in-
formation that can be analyzed and understood by a
user (Pennisi, 2011). But there is no doubt, that the
problem of ”drowning in data and starving for knowl-
edge” problem will be faced in many more areas of
natural sciences.
Even in sciences like marine biology and ecol-
ogy, field studies are nowadays carried out in highly
standardized routines recording time series data with
permanently increasing resolution in time and di-
mension. Especially, when images and videos are
recorded, the data volume fraction which can be
manually analyzed, i.e. annotated with semantics is
shrinking more and more leaving a growing mountain
of unlabeled and not annotated data. This has serious
302
W. Nattkemper T..
Are we Ready for Science 2.0?.
DOI: 10.5220/0004169903020306
In Proceedings of the International Conference on Knowledge Management and Information Sharing (KMIS-2012), pages 302-306
ISBN: 978-989-8565-31-0
Copyright
c
2012 SCITEPRESS (Science and Technology Publications, Lda.)
www.biigle.de
Internet
Computer Vision API
...
Laser Point Detection
Illumination Correction
Statistics / Data Mining
Montag, 9. Juli 2012
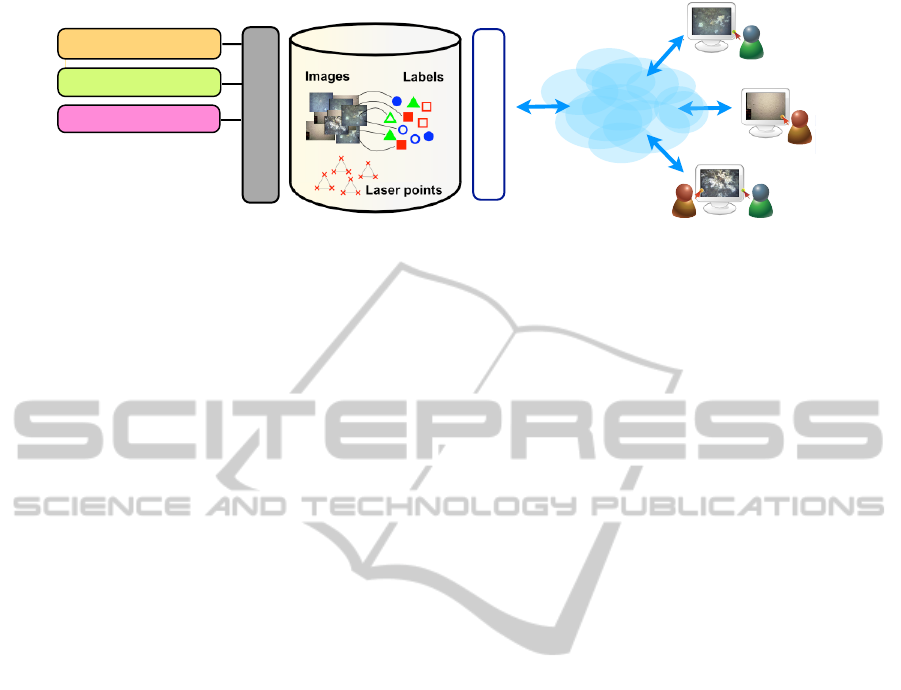
Figure 1: The central element of BIIGLE’s architecture is the database which contains the images themselves, user-generated
label data and results from the computer-vision modules. The data are made available through the rich internet application
served by www.biigle.de.
consequences for the significance of the conclusions
drawn from the study because the majority of data
has not been considered so it automatic labeling and
annotation of data has been proposed (Culverhouse
et al., 2003; Lebart et al., 2003; Pizarro et al., 2009).
It is easy to foresee, that in humanities like social sci-
ences and psychology, automated digital recording of
large data collections (like video observations, or au-
dio streams) will become standard as well and these
disciplines will experience their bottleneck problem
of data analysis soon.
Nevertheless, since automatic semantic annota-
tion of complex semi- or non-structured data such as
images or video is sometimes not perfectly achiev-
able, the recent developments of the WWW, e.g.
Web 2.0 services, triggered some people to motivate
some paradigm shifts in scientific practice. The abil-
ity to access the same data from different locations
through common computer hardware promised to sig-
nificantly lower the hurdles for contributing to online
science communities. Consequently, these authors
propose Web 2.0 tools for the scientific community
and have coined the phrase “Science 2.0” (Shneider-
man, 2008; Waldrop, 2008). It was clear, that this
new term was much more than a new ”buzz word”,
since it appeared as the perfect reaction to the trend,
that progress and success in science is more and more
dependent on collaboration in teams of growing size
as reported in (Wuchty et al., 2007).
2 FROM WEB 2.0 TO SCIENCE 2.0
The fact, that the term Science 2.0 is just vaguely de-
fined is not surprising and follows directly from the
loose definition of the term Web 2.0. Interestingly,
the term seems to have two faces like a Janus statue.
2.1 The Face of Politics
The first face is its interpretation from the per-
spectives of administration and politics. From this
persepective, the term Science 2.0 covers in some
sense all non-scientific questions like ”Should re-
sults be freely exchangeable via the web” or ”How
should the process of publishing be reconsidered?”.
Of course, these are interesting questions and the open
access development definitely has a strong impact of
the scientific landscape already. But it is also def-
initely surprising, that some communities (such as
for instance image processing or medical imaging or
bioimaging) do not participate much in that develop-
ment although they would benefit immensely from
that, e. g. considering the unlimited size of supple-
mentary image material which could be associated to
their papers. Another point is, that sharing and pub-
lishing data through the web is used only by a small
set of researchers from life sciences since these are
forced to do so by their national or international fund-
ing agencies supporting their research. In other scien-
tific disciplines, researchers still consider their data as
their ”precious” and show no clear tendency for shar-
ing data.
2.2 The Face of Science
Nevertheless, the second face of Science 2.0 seems
more interesting in the context of this conference.
This perspective is determined by the question ”How
does Web 2.0 change the way research and develop-
ment is carried out?”. In other words, which devel-
opments in algorithms and software are necessary to
accelerate data analysis and increase the significance
of scientific studies by tackling the bottleneck prob-
lem of understanding huge amounts of complex and
semi-/non-structured data. And this includes not only
”classic” data mining methodology like clustering, di-
mension reduction, applied statistics or association
rule mining. Another very important aspect is shar-
AreweReadyforScience2.0?
303
ing data and collaboration via the web (see Web 2.0
definition above). Here, new approaches for sharing
data and (maybe more important) annotating and dis-
cussing data via the web have been proposed just re-
cently for instance in the context of molecular biol-
ogy in particular for metabolomics data (Neuweger
et al., 2010), for transcriptomics data (Dondrup et al.,
2009) and for bioimage / microcopy data (Kvilekval
et al., 2010; Loyek et al., 2011). In marine biol-
ogy (see above) two systems have been proposed to
open data for a larger scientific community and to
support collaborative semantic annotation, e.g. the
NEPTUN project in Canada (Pirenne and Guillemot,
2009; Leslie et al., 2010) and the BIIGLE system
(Ontrup et al., 2009; Bergmann et al., 2011) (see fig-
ure 1). Some of these systems do even support data
mining by offering algorithms for clustering and di-
mension reduction in a software as a service (SaaS)
framework. One example is the WHIDE visualization
for complex bioimages (K
¨
olling et al., 2012), which
is computationally expensive but can be applied easily
due to a SaaS framework via the BIOIMAX website.
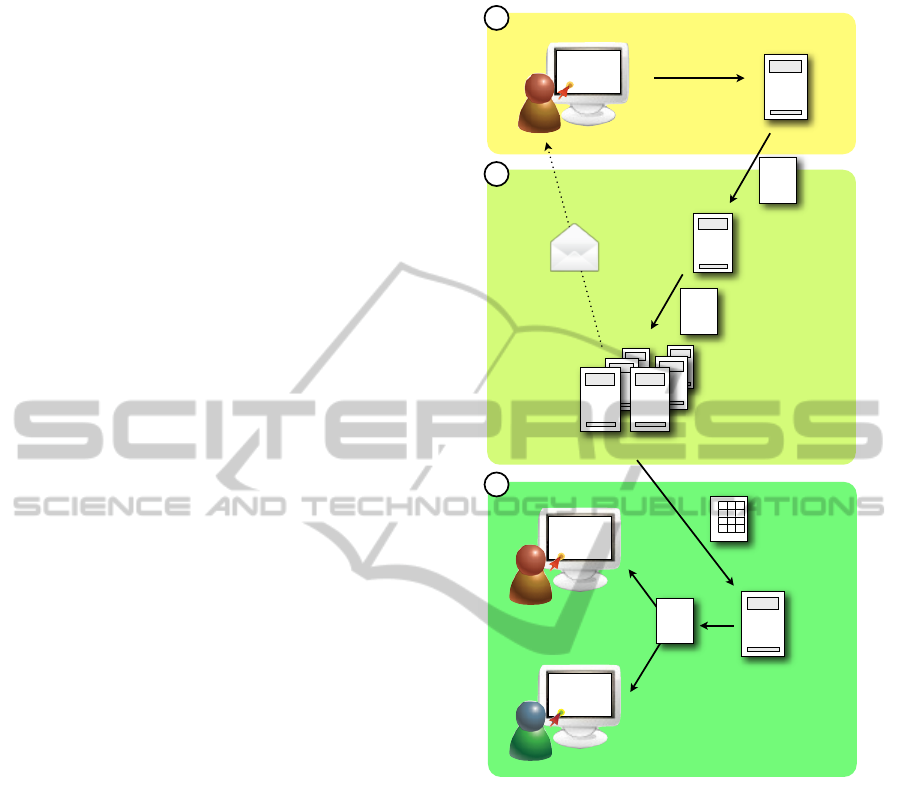
The technical concept referred to as TICAL (i.e. how
the job is carried out by a web server, a compute clus-
ter and a data server) is straightforward and shown in
Figure 2.
But although the political arguments are well mo-
tivated and the hardware and software concepts are
well known to establish the technical level of Science
2.0 the author does not really observe that something
like Science 2.0 is really shaping. The majority of
data is not shared or open to the public, the majority
of high impact publications is still published in a tra-
ditional way and just a small number of Web 2.0 web
services exist for data mining or knowledge discov-
ery. What are the reasons for that?
3 WHY IT DOES NOT REALLY
WORK
To find the answers for the above question we have
to look at the two faces again. In the political face the
reasons can be seen very easily. Researchers put much
effort in designing studies, collecting and recording
data, investing in new hardware and teaching stu-
dents and assistants. Consequently, the are reluctant
for sharing data, since even if they do not consider
their own carrier (i.e. writing high impact papers as
a PI) they are responsible for the carrier of their stu-
dents. The WWW complex has gained some bad rep-
utation in the light of illegal media data copying and
exchange, so it will need some pressure to make some
researchers moving their data to the web as long they
RIA
(Rich Internet App)
TICAL
Webserver
</>
Compute Servers
XML RPC Server
.....
.....
Cluster-Job
XML RPC
RIA
(Rich Internet App)
WHIDE
RIA
(Rich Internet App)
WHIDE
Result
.....
.....
JSON
DB Server
I.
II.
III.
Montag, 9. Juli 2012
Figure 2: The TICAL/WHIDE architecture consists of three
layers. First, the user submits a request to the web server,
which triggers a XML-RPC call. Second, the call is re-
ceived by the XML-RPC server which starts the execution
of the clustering software on the high performance com-
pute servers using the parameters entered by the user. Third,
when the algorithms have finished, the user is notified by an
email. The clustering result (usually a set of prototypes and
a cluster map) is written to a file and stored in a database,
together with additional meta information (time, cluster pa-
rameters, user, data set etc.). By requesting to view the
result in another web application in BIOIMAX (such as
WHIDE), the corresponding JSON file is loaded and the
user can explore a visualization in a web browser through
the BIOIMAX system.
see no benefit that outweighs the risks. And this leads
us to the technical face.
In the technical face of our Science 2.0 Janus
statue metaphor, the reasons are quite heterogeneous.
Let us first have a look at the humanities. There, the
digitization of scientific methods is more or less in
KMIS2012-InternationalConferenceonKnowledgeManagementandInformationSharing
304

an infant stage. Researchers just start to record data
digitally with a perspective of a sophisticated follow-
ing data analysis. But in the natural sciences and
medicine we see a different problem. From the point
of view of the authors the development of algorithms
and software are just oriented on making the estab-
lished methods available through the web (like the
WHIDE system, see above). So the overall gain re-
garding reasoning, knowledge and insight is limited.
For instance in machine learning research the best
groups work on finding new methods for dimension
reduction and projection that outperform the stan-
dard methods regarding topology preservation (like
ISOMAP, LLE, T-SNE etc.) and report progress con-
tinuously. But the methods are getting more and more
computational expensive so they are not applicable in
many contexts with large data volume and an applica-
tion through the web does not make sense either since
the user needs to wait for hours until the results have
been computed.
The author concludes that the areas of data mining
and knowledge discovery can contribute much more
so the potential of Science 2.0 can be unfold.
4 WHAT CAN BE DONE?
From the point of view of the author, the most reason-
able thing to do would be to invent new paradigms for
knowledge discovery in a Web 2.0 framework. This
starts with implementing some aspects of social net-
works so ideas and conclusions are exchanged rapidly
and safe. This way, the quality of data annotations
would be improved rapidly. Another point would
be the collaborative analysis of data. Collaborators
would use the same tool to derive information graph-
ics from their data (scatter plots, histograms, pseudo-
color maps, ...) or to carry out statistical tests which
would provide a good basis for discussing the data.
But one may find the next step in data analysis,
data mining, much more interesting. How should one
selected standard data mining procedure be re-shaped
if it is part of a Web 2.0 / Science 2.0 framework? If
one considers for example clustering, the idea would
be for instance to work on new online clustering meth-
ods which perform rapidly, since users are used to get
the results instantaneously after ”pressing the button”.
Maybe one could for instance present a first estimate
of a clustering result, while the real clustering is per-
formed in the background and the result is updated
continuously. As a consequence, the whole diea of a
clustering algorithm could be re-considered. It would
be the primary goal to find the clustering which is able
to achieve the best clustering indices (i.e. clustering
quality regarding intracluster variance and interclus-
ter distance) but to find the clustering which achieves
minimum cluster quality in a given (short) time win-
dow, so the steepness of the cluster index (like for in-
stance the Index I, Chalinsky-Harabasz or the Davis-
B. Index) could be more interesting in the Science 2.0
context?
Another point is, that users usually do not have an
idea about the number of clusters but they would ac-
cept to choose between different results. So maybe
the question, how the best number of clusters k is to
be set and which metric d(x
i
, x
j
) is to be applied to
quantify the similarity or the distance of to items i
and j and their n-dimensional features x
i, j
may be not
the only one of interest to data mining developers in
the Science 2.0 context. It would be interesting to find
good algorithmic foundations how to cluster data for a
flexible number of clusters and how the result should
be visualized dynamically, so the user can interac-
tively explore the clustering results to gain a mental
model for her/his data. And it would be interesting
here to further explore the connections between the
algorithmic foundations and development of graphics
standards, (html5, 3D) in the WWW.
But these were just some examples and it seems
natural to the author, that it could be interesting to
reconsider many KDD methods along these lines.
5 CONCLUSIONS
The author finally concludes that Science 2.0 still has
new potential, but the role of KDD can be reconsid-
ered. The main goal is to develop new data analysis
methods that have a huge substantial advantage for
the users so they are more motivated to move their
research to the web.
REFERENCES
Bergmann, M., Langwald, N., Ontrup, J., Soltwedel,
T., Schewe, I., Klages, M., and Nattkemper, T.
(2011). Megafaunal assemblages from two shelf sta-
tions west of svalbard. MARINE BIOLOGY RE-
SEARCH, 7(6):588–602.
Cooley, R., Mobasher, B., and Srivastava, J. (1997). Web
mining: information and pattern discovery on the
world wide web. In Tools with Artificial Intelligence,
1997. Proceedings., Ninth IEEE International Confer-
ence on, pages 558 –567.
Culverhouse, P., F., Williams, R., Reguera, B., Herry, V.,
and Gonzalez-Gil, S. (2003). Do experts make mis-
takes? a comparison of human and machine indenti-
AreweReadyforScience2.0?
305

fication of dinoflagellates. Marine Ecology Progress
Series, 247:17–25.
Dondrup, M. Albaum, S. P., Griebel, T., Henckel, K., Juen-
emann, S., Kahlke, T., Kleindt, C., Kuester, H., Linke,
B., mertens, D., Miiard-Runte, V., Neuweger, H.,
Runte, K., Tauch, A., Tille, F., Puehler, A., and Goes-
mann, A. (2009). Emma 2 - a MAGE-compliant sys-
tem for the collaborative analysis and integration of
microarray data. BMC Bioinformatics, 10(50).
Fayyad, U., Piatetsky-Shapiro, G., and Smyth, P. (1996).
From data mining to knowledge discovery: An
overview. In Fayyad, U., Piatetsky-Shapiro, G.,
Smyth, P., and Uthurusamy, R., editors, Advances in
Knowledge Discovery and Data Mining, pages 495–
515. AAAI press/The MIT Press.
Gloor, P., Krauss, J., Nann, S., Fischbach, K., and Schoder,
D. (2009). Web science 2.0: Identifying trends
through semantic social network analysis. In Com-
putational Science and Engineering, 2009. CSE ’09.
International Conference on, volume 4, pages 215 –
222.
K
¨
olling, J., Langenkmper, D., Abouna, S., Khan, M., and
Nattkemper, T. W. (2012). Whide - a web tool for
visual data mining colocation patterns in multivariate
bioimages. Bioinformatics, 28(8):1143–1150.
Kvilekval, K., Fedorov, D., Obara, B., Singh, A., and Man-
junath, B. (2010). Bisque: a platform for bioimage
analysis and management. Bioinformatics, 26(4):544–
52.
Lebart, K. andSmith, C., Trucco, E., and Lane, D. (2003).
Automatic indexing of underwater survey video: al-
gorithm and benchmarking method. IEEE Journal of
Oceanic Engineering, 28(4):673– 86.
Leslie, M., Scott, N., Guillemot, E., and Auger, V. (2010).
Video acquisition, archiving, annotation and analysis:
Neptune canada’s real-time georeferenced library of
deep sea video. In OCEANS 2010, pages 1 –9.
Loyek, C., Rajpoot, N., Khan, M., and Nattkemper, T. W.
(2011). Bioimax: A web 2.0 approach for easy
exploratory and collaborative access to multivariate
bioimage data. BMC Bioinformatics, 12(1):297.
Munibalaji, T. and Balamurugan, C. (2012). Analysis of
link algorithms for web mining. International Journal
of Engineering and Innovative Technology (IJEIT),
1(2):83–86.
Nasraoui, O., Soliman, M., Saka, E., Badia, A., and Ger-
main, R. (2008). A web usage mining framework for
mining evolving user profiles in dynamic web sites.
Knowledge and Data Engineering, IEEE Transactions
on, 20(2):202 –215.
Neuweger, H., Bonte, A., Stutz, L., Niehaus, K., Stoye, J.,
and Goesmann, A. (2010). Meltdb 2.0 - advances of
the metabolomics software system. Bioinformatics,
24(23):2726–32.
Ontrup, J., Ehnert, N., Bergmann, M., and T.W., N. (2009).
Biigle - web 2.0 enabled labelling and exploring of
images from the arctic deep-sea observatory haus-
garten. In Proc. of OCEANS’09 IEEE, Bremen, Ger-
many.
Pennisi, E. (2011). Will computers crash genomics? Sci-
ence, 331(6018):666–668.
Pirenne, B. and Guillemot, E. (2009). The data manage-
ment system for the venus and neptune cabled obser-
vatories. In OCEANS 2009 - EUROPE, pages 1 –4.
Pizarro, O., Williams, S., and Colquhoun, J. (2009).
Topic-based habitat classification using visual data.
In Proc. of IEEE OCEANS’09, Bremen (Germany),
pages 1–8.
Shneiderman, B. (2008). Science 2.0. Science, 319:1349.
Waldrop, M. M. (2008). Science 2.0: Great new tool, or
great risk? Scientific American.
Wuchty, S., Jones, B. F., and Uzzi, B. (2007). The increas-
ing dominance of teams in production of knowledge.
Science, 316:1036–1039.
KMIS2012-InternationalConferenceonKnowledgeManagementandInformationSharing
306
