
Complexification of Gene Networks by Co-evolution of Genomes
and Genomic Parasites
David M. Holloway
1
, Alexander B. Kazansky
2
and Alexander V. Spirov
2,3
1
Mathematics Department, British Columbia Institute of Technology, Burnaby, B.C., Canada
2
The Sechenov Institute of Evolutionary Physiology & Biochemistry, St.-Petersburg, Russia
3
Computer Science and CEWIT, SUNY Stony Brook, Stony Brook, New York, U.S.A.
Keywords: Evolution in Silico, Evolutionary Design, Genomes, Genomic Parasites, Artificial Transposons, Co-
evolution, Gene Networks, Gene Co-option, Complexification, Genetic Algorithms.
Abstract: The co-evolution of species with their genomic parasites (transposons) is thought to be one of the primary
ways of rewiring gene regulatory networks (GRNs). In this communication, we computationally explore
some of the essential co-evolution aspects of hosts (GRNs) with their transposons. We implemented an
evolutionary search of an appropriate GRN model design on the example of the Drosophila gap-gene
network. Simple artificial transposons capable of spreading and transposition were implemented. With the
model, we explored the hypothesis that targeting destruction of some of the regulatory connections in the
GRN via the action of transposons can produce negative selection pressure. Functionally external genes can
be recruited (co-opted) into the GRN under this selection pressure following transposon rewiring of the
GRN. Over evolutionary time, transposition events are able to disrupt these new regulatory connections,
leading to repeated cycles of recruitment, rewiring and optimization. This process can produce increasingly
large GRNs with the same basic functions.
1 INTRODUCTION
The extensive area of modern evolutionary
computation (EC) was inspired by ideas from
biological evolution. Contemporary biological
evolution theories inspire computer science fields to
work out and implement novel evolutionary
algorithms. In turn, biology, especially in the area of
systems biology, has been and is currently
influenced by contemporary EC ideas and
approaches. One product from the cross-
dissemination of ideas between systems biology and
EC (in particular, genetic algorithms, GA) is a set of
modern techniques to design real genetic network
models, termed the evolution in silico approach.
The evolutionary design of GRNs in nature
involves the establishment of gene-gene connectivity
(wiring) and tuning of the connection strengths,
followed by multiple rounds of rewiring and
retuning to optimize the GRN for a particular
function. These wiring and rewiring events involve
specific molecular mechanisms. One such
mechanism is the co-evolution of gene networks and
their parasites, termed transposons. Co-evolution is
proposed to be one of the key mechanisms of gene
network evolution. The co-evolutionary
relationships of the hosts (gene networks) and
parasites (transposons) can be roughly subdivided as
competitive or mutualistic. The ‘arms race’ nature of
competitive relationships can lead to high levels of
complexity, a manifestation of which is gene
network outgrowth.
Gene Network outgrowth by Recruitment of
Novel Members: In early metazoan evolution, gene
networks specifying developmental events in
embryos may have consisted of no more than two or
three interacting genes. Over time, new genes were
incorporated into the primitive networks (Wilkins,
2002). While an initial hypothesis might be that new
functions require novel genes, whole genome
sequencing has shown that the apparent increases in
developmental complexity do not correlate with
increasing total numbers of genes. Therefore, the
evolution of developmental pathways may most
commonly proceed by recruiting pre-existing
external genes into pre-existing networks to create
novel functions (True and Carroll, 2002).
Developmental evolution may act primarily at the
238
M. Holloway D., B. Kazansky A. and V. Spirov A..
Complexification of Gene Networks by Co-evolution of Genomes and Genomic Parasites .
DOI: 10.5220/0004170802380244
In Proceedings of the 4th International Joint Conference on Computational Intelligence (ECTA-2012), pages 238-244
ISBN: 978-989-8565-33-4
Copyright
c
2012 SCITEPRESS (Science and Technology Publications, Lda.)

level of genetic regulation (Carroll et al., 2001).
The invertebrate segmentation network is among
the best studied gene ensembles, with a wealth of
diverse experimental data providing a unique
opportunity for investigating known and
hypothetical evolutionary scenarios in detail. In
particular, the level of understanding of the
segmentation gene network for the fruit fly
(Drosophila melanogaster) has made it, for many
years, extremely popular for functional and
evolutionary computer simulations (Reinitz and
Sharp, 1995; Jaeger et al., 2004; Sánchez and
Thieffry, 2001; Manu et al., 2009ab). Modelling this
gene ensemble has become a benchmark test in
modern systems biology (e.g. Azevedo et al., 2006;
Umulis et al., 2008; Bieler et al., 2011; Gursky et al.,
2011). This network has also been used in the
development of evolution in silico approaches
(François et al., 2007; Spirov and Holloway, 2009;
2010; 2012).
Comparisons of segmentation networks between
primitive and higher insects indicate that evolution
proceeds in the direction of network
complexification (Patel, 1994; Sommer and Tautz,
1993). The transition from grasshoppers to flies,
with an (at least) doubling of the number of genes in
the network, appears to have been solved by
evolution over a short geological time span. Increase
in the segmentation network size often involved
recruitment of genes from other networks.
Transposons, Genomic Parasites: A universal
property of life is that all successful systems attract
parasites. Parasites are so common that hosts
eventually co-evolve immunity. The parasites then
co-evolve strategies to circumvent the new
immunity. And the hosts respond by co-evolving
defences to repel the parasites again.
Transposons are a unique type of parasite
residing in the host genome. Co-evolution of
transposons and host genomes are thought to
produce arms races within the DNA of organisms.
Transposons jump between different parts of a
genome to propagate themselves, and these events
are usually to the detriment of the host (Makalowski,
1995). Many transposons have a unique DNA
sequence that acts as a forwarding address and
directs the transposon to a complementary DNA
sequence
in the host genome (Makalowski, 1995).
Transposons are a major source of genetic
change (Lozovskaya et al., 1995; King, 1992). It has
been estimated that 80% of spontaneous mutations
are caused by transposons (Makalowski, 1995).
Transposons have co-evolved with their hosts
through selection. The activities of transposons are
likely to participate in the rewiring of pre-
established regulatory networks (for example,
Wallace et al., 1991; Girard and Freeling, 1999).
While the problem of growth and
complexification of GRNs has received much
attention in recent years, the mechanism remains
unknown. How does recruitment happen? What
exactly forces the GRNs to co-opt genes? Some
studies assume that recruitment occurs by chance (at
a very low level) and is then subject to evolution.
Other researchers believe that there are special
evolutionary mechanisms to perform this task. These
could involve complicated systems to re-arrange the
genetic material. Transposons might participate in
evolutionary events at this level. Even assuming that
transposons can drive complexification of GRNs, it
is unknown exactly how this could occur. An initial
hypothesis might be that transposons force GRNs
towards more complexity by forced evolution
(negative selection). In this communication, we
computationally explore some of the essential co-
evolutionary aspects of hosts (GRNs) and
transposons in regard to the problem of GRN
evolutionary growth. We show that particular
transposon-GRN interactions are capable of
producing GRN enlargement.
2 METHODS AND APPROACHES
The idea of implementing artificial transposons to
facilitate the evolutionary search in EC has been of
great interest since the mid-1990s (Spirov, 1996;
Spirov and Samsonova, 1997; Spirov and Kadyrov,
1998; Spirov and Kazansky, 2002ab; Spirov et al.,
2009). This approach has been developed by several
teams (Nawaz Ripon et al., 2007; Tang et al., 2008;
Chan et al., 2008; Simões and Costa, 1999ab; 2000;
2001; Liu et al., 2009). Our main interest in this area
is to use artificial transposons to facilitate gene
network model design.
2.1 Modelling the Segmentation
Network
We use an in silico approach to simulate evolution
of the gap gene network which is central to fly
segmentation. Our model for the gap gene network
(adapted from Reinitz and Sharp, 1995; Manu et al.,
2009a) is a system of differential equations
describing the regulatory interactions of 4 gap genes
(giant, gt; hunchback, hb; Krüppel, Kr; knirps, kni)
under the control of a maternal Bicoid (Bcd) protein
gradient. Real spatial patterns of gene expression
ComplexificationofGeneNetworksbyCo-evolutionofGenomesandGenomicParasites
239

were used to fit the model (see Spirov and
Holloway, 2009, Fig. 1A-C). The model parameters
for the gene interaction strengths are varied, and the
solutions are selected by GA (details below) based
on how well they fit the gap gene data. This
selection produces networks that describe the
particular interactions (and quantitative strengths)
between the component genes (e.g., Spirov and
Holloway, 2009, Fig. 1D). In this way, we can use a
model of our current understanding of fly
segmentation to study the evolutionary dynamics of
how the segmentation network may have arisen and
how this might reflect on its current characteristics.
Gene-gene regulatory matrix W: The gap gene
proteins (Kr, Gt, Kni and Hb) are variables in the
model, with the rates of their concentration changes
dt
dv
a
i
(for each gene product
a
in each nucleus i),
defining a system of number of proteins times
number of nuclei ODEs given by
(1)
where
a
R
represents protein synthesis,
a
D
represents diffusion, and
a
represents decay.
a
gu
is a sigmoid regulation-expression function.
Figure 1: The gene-gene interaction matrix, a core element
of modelling GRNs. Each gene (horizontal arrow) is
regulated by the products of other genes via upstream
enhancer elements (boxes). The strength and direction of
regulation (depicted as differently coloured saturation
levels) are a function of both the regulatory element and
the abundance of its corresponding gene product. The left-
most column W
a0
corresponds to the regulatory elements
for the action of the spatially-graded morphogen, M =
Bicoid (external factor for the GRN). The genotype is
represented as the matrix, W, of the regulatory
interactions, and the phenotype is the vector, Ŝ, of the
gene product levels at equilibrium. Modified from Siegal
and Bergman (2002).
a
u
is given by
b
aBcd
i
ab
i
aba
hvWvWu
0
.
Parameters
ab
W
constitute a gene interconnectivity
matrix,
Bcd
i
v
represents the concentration of Bcd in
nucleus i, which is constant in time.
0a
W
describes
the regulatory input of Bcd to each gene. Bcd is a
general activator for all four considered gap genes.
a
h represents the regulatory input from ubiquitous
factors.
The gene interconnectivity matrix,
ab
W
, is
the key component for describing the GRN. Fig. 1
depicts this matrix in detail. The elements
represent the activation of gene
a
by the product of
gene
b
(with concentration
b
i
v
) if positive,
repression if negative, and no interaction if close to
zero.
2.2 Evolution in Silico to Design the
Gene Network Model
We simulate population dynamics by repeated
cycles of mutation, selection and reproduction (the
general GA approach). The program generates a
population of double string chromosomes (described
in more detail in 2.3). The genome of each host
consists of N chromosomes represented in the W
ab
matrix (Fig. 1). The main chromosome string
consists of N+1 floating-point values (Fig. 1).
The initial floating-point strings of the
chromosomes are generated at random. All of the
chromosome sets are consecutively evaluated
(according to their fit to the data, see eqn. 2), an
average score is calculated and the winners’
offspring substitutes for the losers in the process of
reproduction. Next, a predetermined proportion of
the chromosome population undergoes mutation
(small changes are made to selected chromosomes’
coefficients). The cycle is then repeated for each
generation.
The set of ODEs (1) was solved numerically by
Euler’s method (Press et al., 1988). We minimized
the cost function, E, by adjusting parameters
ab
W
in equation (1):
(2)
The remaining parameters were found in preliminary
runs and then used as fixed parameters.
We extended this standard scheme with our own
procedures to simulate the interaction between hosts
()
a
a
aa
i
aaiai
dv
Rgu D
dt
ab
W
2
mod
)(
b
data
a
i
el
a
i
vvE
IJCCI2012-InternationalJointConferenceonComputationalIntelligence
240
and transposons.
2.2.1 Introduction and Withdrawal of New
Genes
We used a Gene Introduction operator to add a new
gene to the network (at a rate of 5 – 10% per
generation, depending on the computation).
Specifically, this added a new row and column to the
ab
W
matrix, which could be then be operated on by
mutation and crossover (discussed below). For
simplicity, new rows are always added above
existing rows (cf. Fig. 1). To evaluate the
importance of this one-way process in forcing
networks to recruit new genes, we also introduced a
Gene Withdrawal operator which removes a row and
column from the
ab
W matrix (at a rate of 2 - 10%
per generation, depending on computation). Gene
Withdrawal does not operate if the network is
minimal (N = 4 genes).
2.3 Artificial Transposons for
GA
We define an artificial transposon as a marked block
of the host’s code. This mark is transmissible from
host to host. We use double-string chromosomes: the
main string (floating-point) is used for the host code
and a second string (binary) is used for the
transposon marks. Secondary string values are 1 for
a mark and 0 otherwise. Chromosomes are therefore
in the following format:
the mark string: 1
0
0
… 0
the main string: α
1
α
2
α
3
… α
n
where the α
k
are floating-point values (only the α
1
element is transposon-marked in this example).
(Each element α
k
is the value of W
ab
, Fig. 1.)
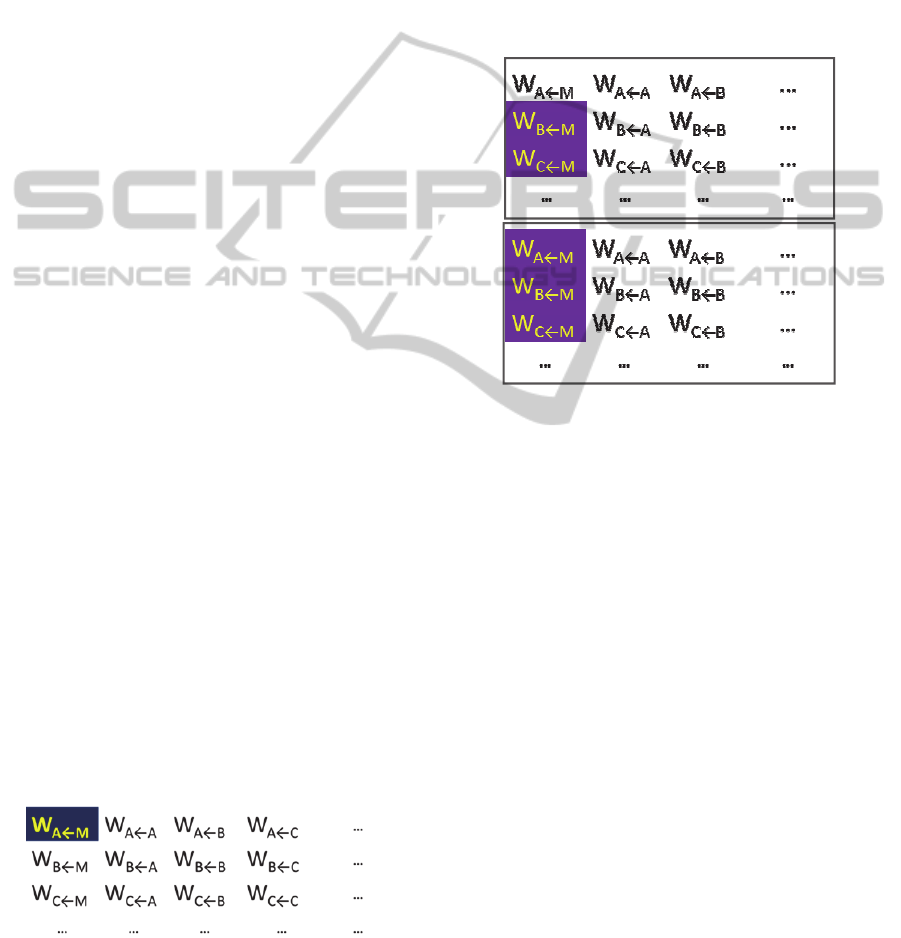
Artificial Transposons as Mutators: As with
biological transposition, action of an artificial
transposon is deleterious to the host in our model.
For an example of how this is implemented within
the W
b←a
gene interaction matrix, consider a
transposon infection in the upper left element,
W
A←M
(highlighted):
The transposon’s deleterious action is then
implemented by decreasing the value of the infected
host element W
b←a
. Specifically, we halve the W
b←a
value in each generation. This quickly drops the
element value to near zero. In this manner, the
transposon effectively cuts the b←a regulatory
connection.
Spread of Artificial Transposons: Transposons
tend to form clusters in host chromosomes. We
simulated this feature by spreading transposon
infection by at most one element per generation. In
this operation a transposon can mark the W
b←a
element above it as a new transposon. The following
represents transposon infection spreading from the
2
nd
row (1
st
column) to the 1
st
row:
Transmission of Transposons: We used fixed
transposon coordinates to transmit transposons from
host to host. (Whole transposons were never moved
along the chromosomes.) The two-place
transmission operator was implemented as follows:
First, a pair of hosts was chosen at random; then a
chromosome from either host was scanned for
transposon marks. If a transposon was found, it was
replicated in the partner chromosome, regardless of
the original string character in the target
chromosome. Copying only occurred if the
secondary strings had transposon marks.
3 RESULTS AND DISCUSSION
In all of the computational experiments described,
we begin from a four-gene ensemble of obligate
gene founders (the initial network). We fit this 4-
gene ensemble to experimental data for expression
of four Drosophila gap genes (section 2.1; for
further details see Spirov and Holloway, 2009). The
spatial patterns of these four genes are the only
selection criteria in the evolutionary computations;
they are a stabilizing selection. Starting from the
initial 4-member GRN (GRN
ini
= GRN
4
), up to 3
extra genes can be recruited to the network.
ComplexificationofGeneNetworksbyCo-evolutionofGenomesandGenomicParasites
241
Transposons invade all hosts of the initial
population. Transposon length can vary from 1 to 4
elements (TE
ini
= TE
1-4
).
For typical runs, the size of the host (and
transposon) population is 4000 chromosomes; the
mutation rate is 15% per generation; the 15% of
individuals with the highest scores are marked for
reproduction (truncation strategy); the rate of
transposon horizontal transmission is 25% per
generation; the rate of new gene recruitment is 25%
per generation; the transposon action occurs to 25%
of the infected elements per generation; and the rate
of transposon spread is 25% per generation.
We also ran computations for evolutionary
growth of the host’s GRN with lower transposition
pressure: with a mutation rate of 1.5% per
generation; 1.5% of the highest scoring individuals
marked for reproduction; a rate of transposon
horizontal transmission of 5.0% per generation; rate
of new gene recruitment 5.0% per generation; rate of
transposon action 5.0% per generation; and rate of
transposon spread 5.0% per generation.
3.1 GRN Outgrowth
Our computational experiments demonstrate that
artificial transposons, as defined above, are able to
force their host’s evolution towards greater GRN
complexity. This complexification is due to
recruitment of novel genes into the GRN to escape
the selection pressure of the transposons. Analysis of
the computational solutions shows that a substantial
proportion of the recruited genes participate
significantly in a network’s activity.
Our simulations show that this effect of
transposons on gene recruitment is robust over a
wide range of parameter values (at least a ten-fold
variation). It is a sustainable and robust
characteristic of the host-transposon system.
In earlier experiments, we observed gene
recruitment and GRN outgrowth in the absence of
transposon operators (Spirov and Holloway, 2009).
Genes can become co-opted simply by chance; the
co-option of genes into existing GRNs is a very
general feature of the evolution of regulatory
networks. However, GRN outgrowth by random
recruitment can be very slow. With transposon
operators, selective pressure is greatly increased,
speeding up recruitment and GRN outgrowth. In
addition, as implemented here, the transposon
pressure results in very specific GRN architectures.
3.2 Co-evolution of GRNs and
Transposons
The GRNs in this study rely on a spatial gradient of
a morphogen, M (external to GRN feedback), to
establish appropriate spatial expression patterns. In
Drosophila segmentation, M corresponds to the
maternally supplied Bcd protein gradient. In our
simulations, we have focused on transposon
infections in the 1
st
column of the W matrix,
representing the effects of M on the network genes.
Infections in this column isolate the GRN from its
external input (M is the only activator of the network
genes; see Fig. 1).
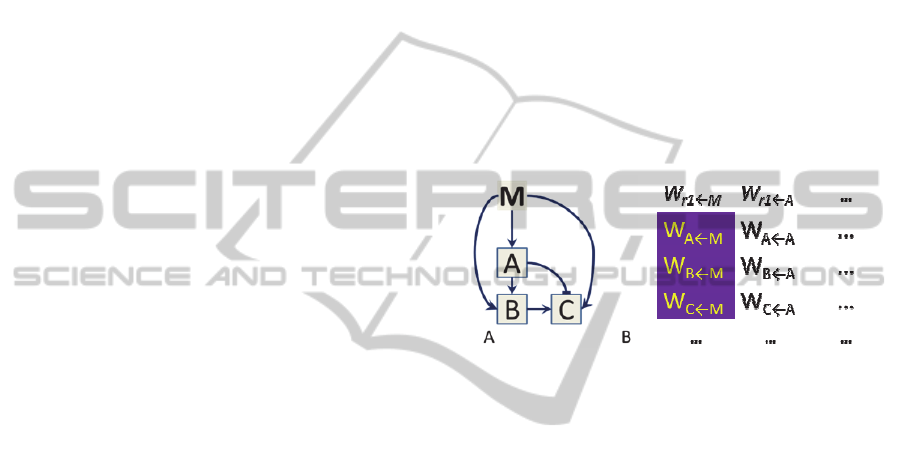
Consider a transposon infection on the initial
GRN (of length, say, TE
4
) at the element of the first
gene (A) representing activation by M (Fig. 2). Once
Figure 2: Transposon infection affecting M activation of
the GRN. A) Representation of the gene interactions in the
network. B) Infection in the W column representing M
activation.
placed, the transposon systematically reduces the
strength of the element. In this way, the transposon
interferes with the reading of the M gradient by the
GRN. Because reading the spatial gradient is critical
to the function of the GRN, the transposon
drastically reduces the fitness score of the “infected”
GRN.
As evolutionary time continues, a novel gene,
e.g. R1, can be recruited to the GRN. If R1 becomes
activated by M, and gene A acquires the ability to be
activated by R1, the newly expanded GRN (R1-
GRN) can again appropriately form spatial pattern.
R1-GRN requires both a rewiring of connections and
retuning of parameter values from GRN
ini
. R1-GRN
can achieve a good score and is insensitive to the
initial length TE
4
. R1-GRN quickly becomes
abundant (even dominant) in the population.
However, as time proceeds, the transposon will
spread upwards in the matrix: the original TE
4
will
become TE
5
and infect the M element of R1 (Fig. 3).
With additional evolutionary time, this process
can reoccur with recruitment of a new gene, R2. I.e.,
R2 can become a target of the M gradient and be
recruited as an activator for A, R1 or other genes.
IJCCI2012-InternationalJointConferenceonComputationalIntelligence
242
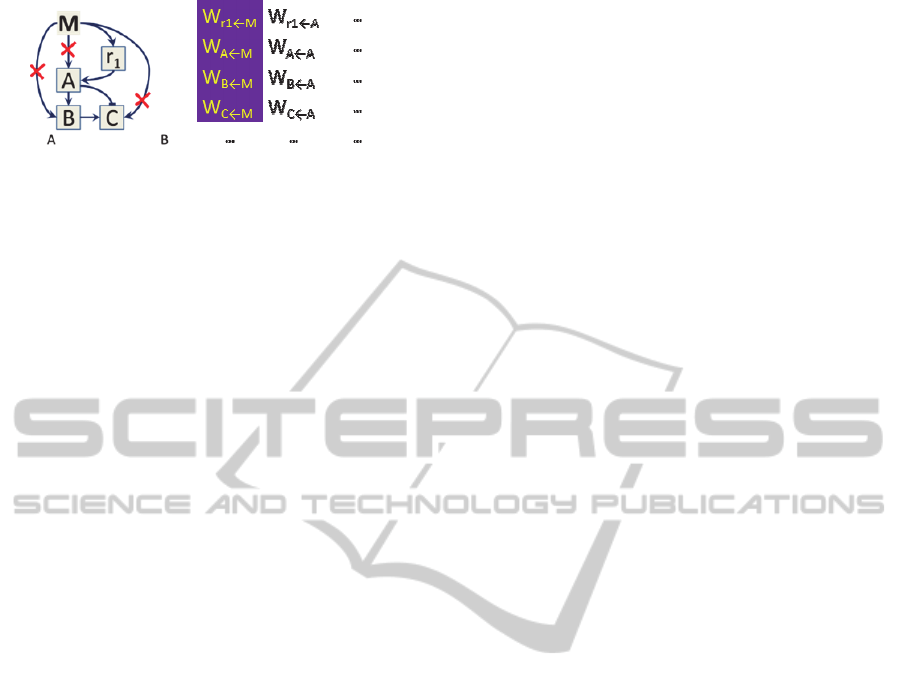
Figure 3: Infection of a recruited gene, R1. A)
Representation of the network; B) matrix representation.
The new R2-GRN then escapes the transposon
pressure and becomes abundant in the population.
These co-evolutionary cycles can occur repeatedly,
in the process forming increasingly large GRNs, but
all with the same basic function of creating the
appropriate spatial gene expression patterns.
4 CONCLUSIONS
1) Targeted destruction of key regulatory
connections in a GRN by transposons can produce
negative selection pressure on the GRN.
2) Initially non-functional genes can be co-opted
into the GRN to respond to this selective pressure.
Co-opted genes substitute the regulatory connections
under transposon attack (i.e., they rewire the GRN).
3) We have focused on the co-option of genes to
restore disrupted connections to external morphogen
signalling. This is relevant to the maintenance of
gradient-reading GRNs (critical in biological
development) despite transposon attacks.
4) For gradient-reading GRNs, we have observed
outgrowth and complexification of the networks
under the selection pressure of targeted transposon
activity.
5) The co-option of novel genes by gradient-reading
GRNs to overcome transposon effects can repeat
over many cycles of co-evolution between the GRN
and the transposon. The increasingly large GRNs
solve the same basic function of gradient reading.
ACKNOWLEDGEMENTS
This work was supported by Joint NSF/NIGMS
BioMath Program, 1-R01-GM072022 and the
National Institutes of Health, 2R56GM072022-06,
2-R01-GM072022.
REFERENCES
Wilkins, A. S., 2002. The Evolution of Developmental
Pathways, Sinauer Associates, Sunderland, MA.
True, J. R., Carroll, S. B., 2002. Gene co-option in
physiological and morphological evolution. Annu.
Rev. Cell Dev. Biol., 18:53–80.
Carroll, S. B., Grenier, J. K., Weatherbee, S. D., 2001.
From DNA to Diversity: Molecular Genetics and the
Evolution of Animal Design, Malden, MA: Blackwell
Science.
Reinitz, J., Sharp, D. H., 1995. Mechanism of formation of
eve stripes. Mechanisms of Development, 49:133-158.
Jaeger, J., Surkova, S., Blagov, M. et al., 2004. Dynamic
control of positional information in the early
Drosophila blastoderm. Nature, 430:368-371.
Sánchez, L., Thieffry, D., 2001. A logical analysis of the
Drosophila gapgene system. J. Theor. Biol., 211:115-
141.
Manu, Surkova, S., Spirov, A. V. et al., 2009a.
Canalization of Gene Expression in the Drosophila
Blastoderm by Gap Gene Cross Regulation. PLoS
Biol., 73: e1000049.
Manu, Surkova, S., Spirov, A. V. et al., 2009b.
Canalization of Gene Expressionand Domain Shifts in
the Drosophila Blastoderm by Dynamical Attractors.
PLoS Computational Biology, 53.e1000303
Azevedo, R. B. R., Lohaus, R., Srinivasan, S., Dang, K.
K., Burch, C. L. 2006. Sexual reproduction selects for
robustness and negative epistasis in artificial gene
networks. Nature, 440:87-90.
Umulis, D. M., O'Connor, M. B., Othmer, H. G., 2008.
Robustness of embryonic spatial patterning in
Drosophila melanogaster. Current Topics in
Developmental Biology, 81:65-111.
Bieler, J., Pozzorini, C., Naef, F., 2011. Whole-embryo
modeling of early segmentation in Drosophila
identifies robust and fragile expression domains.
Biophysical J., 101:287-296.
Gursky, V. V., Panok, L., Myasnikova, E. M. et al., 2011.
Mechanisms of gap gene expression canalization in
the Drosophila blastoderm. BMC Syst. Biol., 5:118.
Spirov, A., Holloway, D., 2012. Evolution in silico of
genes with multiple regulatory modules on the
example of the Drosophila segmentation gene
hunchback. In 2012 IEEE Symposium on
Computational Intelligence in Bioinformatics and
Computational Biology, CIBCB 2012, San Diego, pp
244-251.
Spirov, A. V., Holloway, D. M., 2009. The Effects of
Gene Recruitment on the Evolvability and Robustness
of Pattern-Forming Gene Networks. In Advances in
Computational Algorithms and Data Analysis, Lecture
Notes in Electrical Engineering, Springer, pp. 29-49.
Spirov, A. V., Holloway, D. M., 2010. Design of a
dynamic model of genes with multiple autonomous
regulatory modules by evolutionary computations.
Procedia Computer Science, 1:1005-1014
François, P., Hakim, V., Siggia, E. D., 2007. Deriving
structure from evolution: metazoan segmentation. Mol.
Syst. Biol., 3:12.
Patel, N. H., 1994. Developmental evolution: insights
from studies of insect segmentation. Science, 266:581-
ComplexificationofGeneNetworksbyCo-evolutionofGenomesandGenomicParasites
243

590
Sommer, R. J., Tautz, D., 1993. Involvement of an
orthologue of the Drosophila pair-rule gene hairy in
segment formation of the short germ-band embryo of
Tribolium Coleoptera. Nature, 361:448-450.
Makalowski, W., 1995. SINEs as a Genomic Scrap Yard.
Chap. 5, In The Impact of Short Interspersed Elements
SINEs on the Host Genome, Austin: R.G. Landes
Company, pp. 81-104.
Lozovskaya, E. R., Hartl, D. L., Petrov, D. A., 1995.
Genomic regulation of transposable elements in
Drosophila. Curr. Opin. Genet. Dev., 5:768-73.
King, C. C., 1992. Modular Transposition and the
Dynamical Structure of Eukaryote Regulatory
Evolution. Genetica, 86:127-142.
Wallace, M. R., Anderson, L. B., Saulino, A. M. et al.,
1991. A de novo Alu insertion results in
neurofibromatosis type 1. Nature, 353:864–866.
Girard, L., Freeling, M., 1999. Regulatory changes as a
consequence of transposon insertion. Dev. Genet.,
25:291–296.
Spirov, A. V., 1996. Self-assemblage of gene networks in
evolution via recruiting of new netters. In PPSN 1996,
Lecture Notes in Computer Science, 1141, pp 91-100.
Spirov, A. V., Samsonova, M. G., 1997. Strategy of Co-
evolution of Transposons and Host Genome:
Application to Evolutionary Computations. In Proc. of
the Third Nordic Workshop on Genetic Algorithms
and their Applications, Helsinki University, pp 71-82.
Spirov, A. V., Kadyrov, A. S., 1998. Transposon element
technique applied to GA-based John Muir’s trail test.
In High-Performance Computing and Networking, pp
925-928.
Spirov, A. V., Kazansky, A. B., 2002a. Jumping genes-
mutators can raise efficacy of evolutionary search. In
Proc. Genetic and Evolutionary Computation
Conference, GECCO2002, Morgan Kaufmann
Publishers, San Francisco, pp 561-568.
Spirov, A. V., Kazansky, A. B., 2002b. The usage of
artificial transposons for the protection of already
found building blocks: the tests with royal road
functions. In Proc. The 6th World Multiconference on
Systemics, Cybernetics and Informatics, SCI2002,
Orlando, Florida, Int. Inst. Informatics and Systemics,
pp 75-80.
Spirov, A. V., Kazansky, A. B., Zamdborg, L., et al.,
2009. Forced Evolution in Silico by Artificial
Transposons and their Genetic Operators: The John
Muir Ant Problem. arXiv:0910.5542v1.
Nawaz Ripon, K. S., Kwong, S., Man, K. F., 2007. A real-
coding jumping gene genetic algorithm RJGGA for
multiobjective optimization. Information Sciences,
177:632–654.
Tang, W. K. S., Kwong, S. T. W., Man, K. F., 2008. A
Jumping Genes Paradigm: Theory, Verification and
Applications. IEEE Circuits and Systems Magazine,
8:18-36.
Chan, T. M., Man, K. F., Kwong, S., Tang, K. S., 2008. A
Jumping Gene paradigm for Evolutionary
Multiobjective Optimization. IEEE Tran. On
Evolutionary Computation, 12:143-159.
Simões, A., Costa, E., 1999a. Transposition: A
Biologically Inspired Mechanism to Use with Genetic
Algorithms. In the Proceedings of the Fourth
International Conference on Neural Networks and
Genetic Algorithms ICANNGA'99, Springer-Verlag, pp
612-619.
Simões, A., Costa, E., 1999b. Transposition versus
Crossover: An Empirical Study. In Proceedings of the
Genetic and Evolutionary Computation Conference
GECCO'99, Orlando, Florida USA, CA: Morgan
Kaufmann, pp 612-619.
Simões, A., Costa, E., 2000. Using Genetic Algorithms
with Asexual Transposition. In Proc. of the Genetic
and Evolutionary Computation Conference
GECCO'00, Las Vegas, USA, CA: Morgan
Kaufmann, pp. 323-330.
Simões, A., Costa, E., 2001. An Evolutionary Approach to
the Zero/One Knapsack Problem: Testing Ideas from
Biology. In International Conference on Neural
Networks and Genetic Algorithms ICANNGA'01,
Prague, Czech Republic, Springer, pp. 236-239.
Liu, R., Sheng, Z., Jiao, L., 2009. Gene transposon based
clonal selection algorithm for clustering. In Proc.
Genetic and Evolutionary Computation Conference,
GECCO 2009, pp 1251-1258
Siegal, M. L., Bergman, A., 2002. Waddington's
canalization revisited: developmental stability and
evolution. Proc Natl Acad Sci USA, 99:10528-10532
Press, W. H., Flannery, B. P., Teukolsky, S. A., Vetterling,
W. T., 1988. Numerical Recipes, Cambridge
University Press, Cambridge.
IJCCI2012-InternationalJointConferenceonComputationalIntelligence
244
