
Facing the Challenge of Estimating Human Brain
White Matter Pathways
Adelino R. Ferreira da Silva
Dep.
o
de Eng.
a
Electrot´ecnica, Faculdade de Ciˆencias e Tecnologia, FCT, Universidade Nova de Lisboa,
2829-516 Caparica, Portugal
Keywords:
High Angular Resolution Diffusion Imaging (HARDI), Fiber Tractography.
Abstract:
Diffusion anisotropy has been used to characterize white matter neuronal pathways in the human brain, and
infer global connectivity in the central nervous system. However, mapping complex fiber configurations in
vivo remains a challenging task. We present a new methodology to reduce uncertainty in estimating the
orientation of neuronal pathways in high angular resolution diffusion imaging (HARDI) reconstructions. The
methodology relies on three main features. First, an optimized HARDI reconstruction technique based on
the generalized q-sampling imaging approach is adopted. Second, directional statistics are used to estimate
orientation distribution function (ODF) profile directions from data distributed on the unit sphere. Third, a
modified streamline algorithm able to accommodate multiple fiber tracts and multiple orientations per voxel is
used, to exploit the directional information gathered from estimated ODF profiles. The methodology has been
tested on synthetic data simulations of crossing fibers and on a real data set.
1 INTRODUCTION
Diffusion tensor imaging (DTI) is a widely used
method in clinical research that models the average
diffusion properties of water molecules inside a voxel
based on a Gaussian diffusion assumption. Diffusion
anisotropy, derived by DTI, has been used to char-
acterize white matter neuronal pathways in the hu-
man brain, and infer global connectivity in the cen-
tral nervous system (Basser et al., 2000). White mat-
ter fiber tractography is commonly implemented us-
ing the principal diffusion direction of the DTI model
(Mori and van Zijl, 2002). Popular fiber tracking ap-
proaches, such as the streamline tracking algorithm,
uses the DTI model to extract the orientation depen-
dence of the diffusion probability density function of
water molecules, and reconstruct the orientation dis-
tribution function (ODF) of anisotropic tissues. How-
ever, the standard single-tensor DTI model is based
on a Gaussian diffusion assumption, thus unable to
resolve crossing and splitting of fiber bundles.
High angular resolution diffusion imaging
(HARDI) techniques have been proposed in the liter-
ature to overcome the limitations of the DTI method,
and enable detection of multiple ODF maxima per
voxel (see (Lenglet et al., 2009) for a review). Several
studies have shown that fiber tracking based on HAR-
DI-based techniques is improved and less sensitive to
noise errors compared to tensor based tracking (De-
scoteaux et al., 2009), (Polzehl and Tabelow, 2011).
The application of these methods is based on the as-
sumption that the principal directions extracted from
the ODF can be interpreted as principal directions
of the underlying fiber architecture. Typically, local
maxima of the reconstructed ODF are located sim-
ply by selecting a large number of randomly sampled
points on the sphere and searching within a fixed ra-
dius neighborhood (Descoteaux et al., 2009). Some
more sophisticated heuristics built on this basic ap-
proach have been proposed. For instance, in (Jian
et al., 2007), a Quasi-Newton method is used to re-
fine the position of each local maximum. However,
as shown in (
¨
Ozarslan et al., 2006) and (Lenglet
et al., 2009), the peaks of the ODF profiles identi-
fied by these methods do not necessarily match the
orientations of the distinct fiber populations. Since
uncertainty in tractography arises from uncertainty
in estimating the directions of propagation, HARDI
reconstructions can still be ambiguous and difficult
to interpret in the presence of complex fiber tract
configurations. To reduce uncertainty and increase
robustness in HARDI reconstructions, one may in-
crease the number of sampling directions, and use
higher strengths of diffusion-sensitive gradients (b-
709
R. Ferreira da Silva A..
Facing the Challenge of Estimating Human Brain White Matter Pathways.
DOI: 10.5220/0004177207090714
In Proceedings of the 4th International Joint Conference on Computational Intelligence (SSCN-2012), pages 709-714
ISBN: 978-989-8565-33-4
Copyright
c
2012 SCITEPRESS (Science and Technology Publications, Lda.)

values) to attain satisfactory angular resolution (Cho
et al., 2008). Unfortunately, this solution is imprac-
tical in clinical applications. Increasing the number
of sampling directions prolongs the scan time, mak-
ing HARDI reconstructions susceptible to motion-
induced errors (Jiang et al., 2002). Using high b-
values in clinical scanners results in low signal-to-
noise ratio (SNR) and substantial diffusion-induced
signal decay (Kuo et al., 2008). Poor SNR affects the
accuracy of ODF reconstruction, and increases fiber
orientation uncertainty.
In this paper, we present a new methodology to
reduce uncertainty in estimating the orientation of
neuronal pathways in HARDI reconstructions. The
methodology may be summarized in the following
three aspects. First, an optimized HARDI reconstruc-
tion technique based on the generalized q-sampling
imaging (GQI) approach (Yeh et al., 2010) is adopted.
Second, directional statistics are used to estimate
ODF profile directions from data distributed on the
unit sphere. The method focus on clustering data on
the unit sphere, where complexity arises from repre-
senting ODF profiles as directional data. Sampling
densities on the hemisphere are used in ODF profile
mapping. Third, a modified streamline algorithm able
to accommodate multiple fiber tracts and multiple ori-
entations per voxel is used to exploit the directional
information gathered from estimated ODF profiles.
By combining HARDI reconstruction and directional
statistics in an integrated framework, the methodol-
ogy is expected to support more accurate fiber ODF
estimation for white matter fiber tractography than
other more traditional approaches. The methodology
has been tested on synthetic data simulations of cross-
ing fibers and on a real data set. The implementation
is integrated in a coherent framework based on the R
language (R Development Core Team, 2010) with 3D
OpenGL visualization capabilities.
2 HARDI RECONSTRUCTIONS
The generalized q-sampling imaging method pro-
posed in (Yeh et al., 2010) is a HARDI approach to
estimate the ODF directly from diffusion MR signals.
The relation between the acquired diffusion weighted
images W(r,q) and the measured ODF ψ
m
(r,
ˆ
u) is
given by
ψ
m
(r,
ˆ
u) = A
q
L
∆
∑
q
W(r,q)sinc(2πL
∆
q·
ˆ
u), (1)
where r is the voxel coordinate,
ˆ
u represents a ra-
dial spherical unit direction, q is the wave vector in
q-space, L
∆
is the diffusion sampling length, and A
q
is a constant area term. The wave vector is given by
q = γδG/2π, where γ is the nuclear gyromagnetic ra-
tio, and G and δ are the strength and duration of the
diffusion-encoding gradient, respectively.
Equation (1) is simple to interpret. The estimated
ODF is synthesized from a series of sinc basis func-
tions, weighted by W(r,q). The shape of the basis
functions is determined by the value of |q|L
∆
. A
higher value of |q|L
∆
represents a sharper contour,
and vice versa. Moreover, (1) specifies an operational
sampling scheme in q-space from which the ODF can
be estimated. In particular, the number of basis func-
tions used in (1) is not restricted by the shell (or grid)
resolution used for MRI signal acquisition. The num-
ber of radial sampling directions can be adapted for
the purposes of ODF estimation. Typically, sampling
densities of N = 81 and N = 321 on the hemisphere
are used in ODF profile mapping, corresponding to
a third and seventh-order tessellation of the icosahe-
dron, respectively. However, this specification is not
imposed a priori by the acquisition resolution on the
GQI reconstruction process.
The second main feature of the proposed method-
ology is concerned with multiple directional mapping.
Starting with the raw HARDI signal acquired on a
grid of q-space, the ODF profile is estimated at each
voxel, considering a sampling density of unit vectors
on a unit S2 grid. When a threshold is applied to
the estimated ODF at each voxel, the non-thresholded
unit vectors provide directional statistics information
about the estimated ODF profile. The main ODF ori-
entations at each voxel relevant for fiber tracking may
be estimated by clustering the non-thresholded unit
vectors. This directional clustering procedurehas sev-
eral advantages compared to traditional approaches
for orientation mapping. In fact, current best practices
perform multiple maxima extraction based on proce-
dures which are very sensitive to the local modes that
appear in the reconstructed ODFs. Signal noise and
low sampling resolution yield deformed ODF recon-
struction profiles, thus affecting accuracyof the multi-
ple orientation determination. In contrast, estimating
orientations from clustered directional data is much
less sensitive to local modes in the reconstructed ODF
profile. Moreover, the procedure is more robust to
noise since it estimates orientations statistically from
sampled data.
For directional clustering estimation, we consider
a mixture of k von Mises-Fisher (vMF) distributions
(Banerjee et al., 2005) that serves as a model for di-
rectional ODF profile data, corresponding to multiple
fiber orientations. A mixture of k vMF distributions
has a density given by
IJCCI2012-InternationalJointConferenceonComputationalIntelligence
710
(a)
(b)
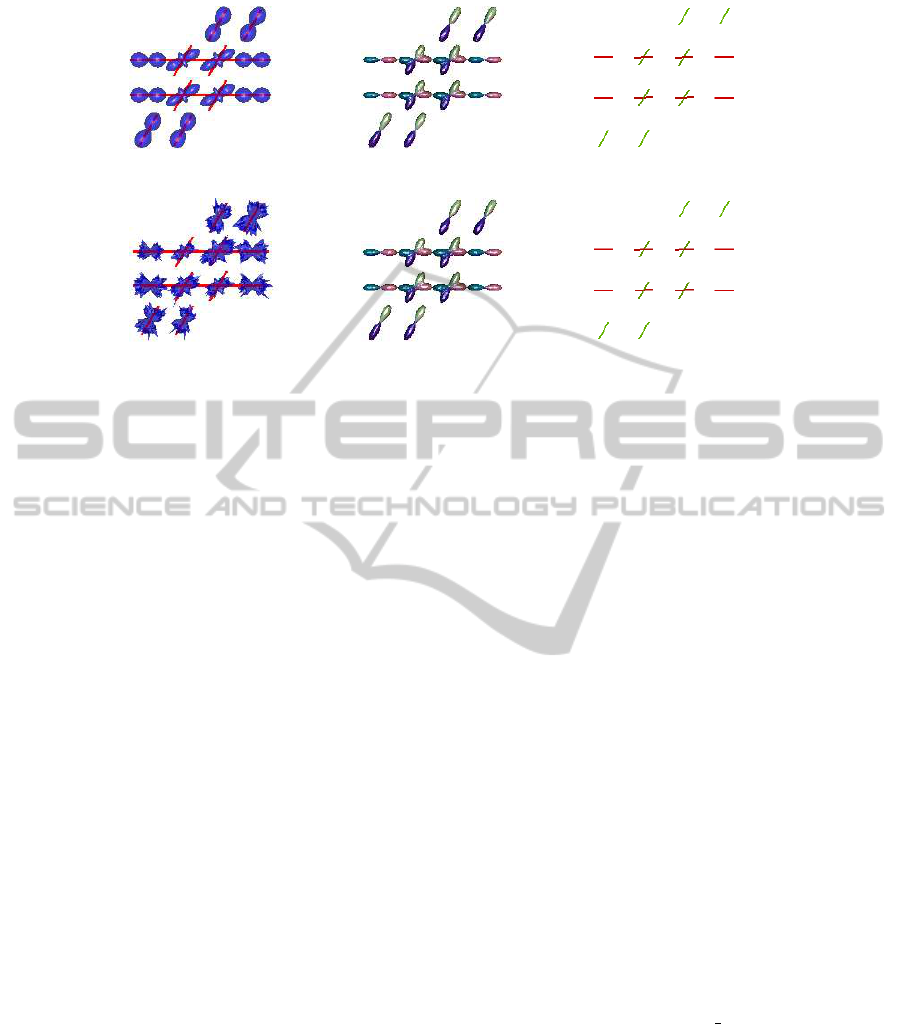
Figure 1: (a) Simulated noise free field of diffusion profiles, reconstructed field of ODF glyphs, and estimated ODF directions,
from left-to-right respectively. (b) Simulation as in (a) with Rician noise level SNR=30.
f(x|Θ) =
k
∑
h=1
α
h
f
h
(x|θ
h
), (2)
where f
h
(x|θ
h
) denotes a vMF distribution with
parameter θ
h
= (µ
h
,κ
h
) for 1 ≤ h ≤ k, Θ =
{α
1
,.. ., α
k
,θ
1
,.. ., θ
k
}, and the α
h
are non-negative
and sum to 1. A d-dimensional unit random vector
x ∈ S
d−1
is said to have d-variate vMF distribution if
its probability density function is given by
f
h
(x|µ,κ) = c
d
(κ)e
κµ
T
x
, (3)
where kµk = 1, κ ≥ 0, d ≥ 2, and c
d
(κ) is a normal-
izing constant (Mardia and Jupp, 2000). The density
f
h
(x|µ,κ) is parameterized by the mean direction µ,
and the concentration parameter κ. The κ parameter
characterizes how strongly the unit vectors drawn ac-
cording to f
h
(x|µ,κ) are concentrated about the mean
direction µ. In this work, we used the procedure for
clustering directional data outlined in (Banerjee et al.,
2005), and implemented in (Hornik and Gr¨un, 2011).
3 EXPERIMENTS
3.1 Simulated Field of Diffusion Profiles
To illustrate the methodology described in Section 2,
we generated a field of simulated diffusion profiles
as depicted in Figure 1. The field simulates crossing
fibers with an angle of 60
◦
, and b=4500. Figure 1(a)
illustrates the simulated noise free field, the recon-
structed field of ODF glyphs using the GQI method,
and the estimated ODF directions based on the vMF
mixture approach. A similar profile simulation with
added Rician noise, and a signal-to-noise (SNR) value
of 30 is shown in Figure 1(b). As illustrated, the vMF
approach correctly identifies the underlying fiber ori-
entations in both cases.
3.2 Real Data Experiment
We report on experiments using a DICOM data
set provided by the “Advanced Biomedical MRI
Lab, National Taiwan University Hospital”. Specif-
ically, we have used the data set “DSI 203-point
3mm” which is included in the “DSI Studio” pack-
age, publicly available from the NITRC repository
(http://www.nitrc.org). This data set is from a nor-
mal 24-year-old male volunteer, and has been pro-
vided as a demonstration data set in connection with
the “DSI Studio” software for diffusion MR images
analysis (Yeh et al., 2010). The data set was obtained
with an echo planar imaging diffusion sequence with
twice-refocused echo, dimension 64 × 64 × 40, and
slice thickness 2.9 mm. Further details on the data
set specification are available from the NITRC repos-
itory. We have tested our model with the two b-tables
that accompanies the data set. One is a b-table for a
S2-like grid denoted by “dsi203 bmax4000.txt”. The
other is the b-table for the 3D-DSI sampling scheme
used in the DICOM data acquisition. This b-table has
203 points uniformly distributed on a 3D grid limited
to the volume of the unit sphere. In both tables, the
b-values range from 0 to 4000.
Figure 2 shows the views sagittal, coronal and ax-
ial for slices [X,Y,Z] = [22,29,24] of a region of inter-
est (ROI) overlayed on the original data set with non-
brain tissue removed. The ROI image depicts brain
regions where anatomic white matter fiber crossings
FacingtheChallengeofEstimatingHumanBrainWhiteMatterPathways
711
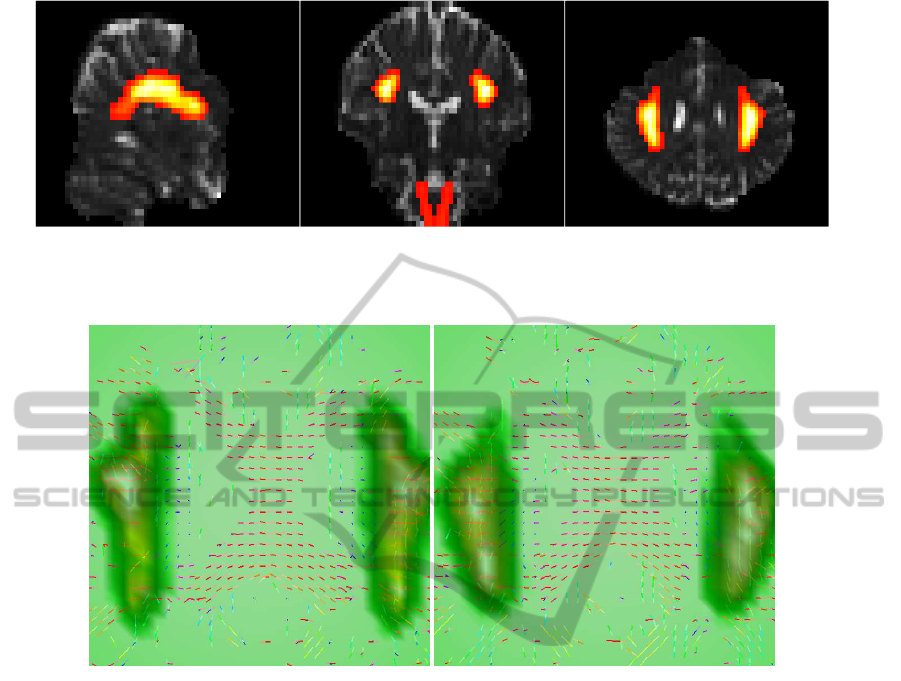
Figure 2: Sagittal, coronal and axial views (from left-to-right) for slices [X,Y,Z] = [22,29,24] of the selected ROI volume
overlayed on the original data set with non-brain tissue removed. The sagittal view has the front brain facing right; coronal
and axial views have the right hemisphere on the left of the image (radiological convention).
Figure 3: Linemaps for the field of profiles estimated from the ODFs, for voxels in axial slices 23 (left), and 24 (right). The
panels also depict the ROI (SLF and CT regions as dark hues) overlayed on the central regions of slices 23 and 24.
are known to exist, forming multiple pathway bun-
dles connected to the cerebral cortex. The ROI was
formed by extracting the superior longitudinal fas-
ciculus (SLF) and corticospinal tract (CT) regions
based on the “ICBM-DTI-81 White-Matter” atlas in-
cluded in the FSL toolbox (Smith et al., 2004). The
extracted regions were registered to the DSI data set
using the FSL/FLIRT tool. Using the procedure out-
lined in Section 2, we estimated for each voxel of the
DSI data set the main ODF directions. This infor-
mation enables us to draw linemaps showing the es-
timated orientations, and number of fibers for each
voxel.
We show in Figure 3 linemaps for the field of pro-
files estimated from the ODFs, for voxels in axial
slices 23 (left), and 24 (right). The selected ROI im-
age is overlayed on Figure 3, in order to pinpoint the
location of the SLF and CT regions on the linemaps.
Figure 3 depicts central regions of slices 23 and 24,
where a large number of voxels with crossing fibers is
clearly visible (see right SLF for slice 23, and left SLF
for slice 24). The central area in Figure 3 is typical of
horizontal fibers associated with the corpus callosum.
Using the estimated voxel directional information,
we implemented a streamline tractographic algorithm
to represent and visualize the fiber tracts. The algo-
rithm is a modified version of the fiber tracking al-
gorithm described in (Mori and van Zijl, 2002). The
modifications were implemented in order to deal with
multiple directional orientations and multiple fiber
tracts per voxel. Fiber tracts are initiated in every
voxel within a specified user defined ROI using one
of the estimated main voxel ODF directions, and are
extended bi-directionally in steps less than half of the
voxel dimension. The tracts are then propagated a
step parallel to the selected direction. For each new
voxel in the path front, one specific direction among
the estimated voxel ODF directions is selected. The
voxel ODF direction that produces least curvature
with the incoming path is selected for propagation.
Multiple tracts per voxel are accommodated by ini-
tializing the tracts with random real values within the
seed voxel. The number of initializing tracts may be
specified by the user, enabling him to strike a bal-
IJCCI2012-InternationalJointConferenceonComputationalIntelligence
712
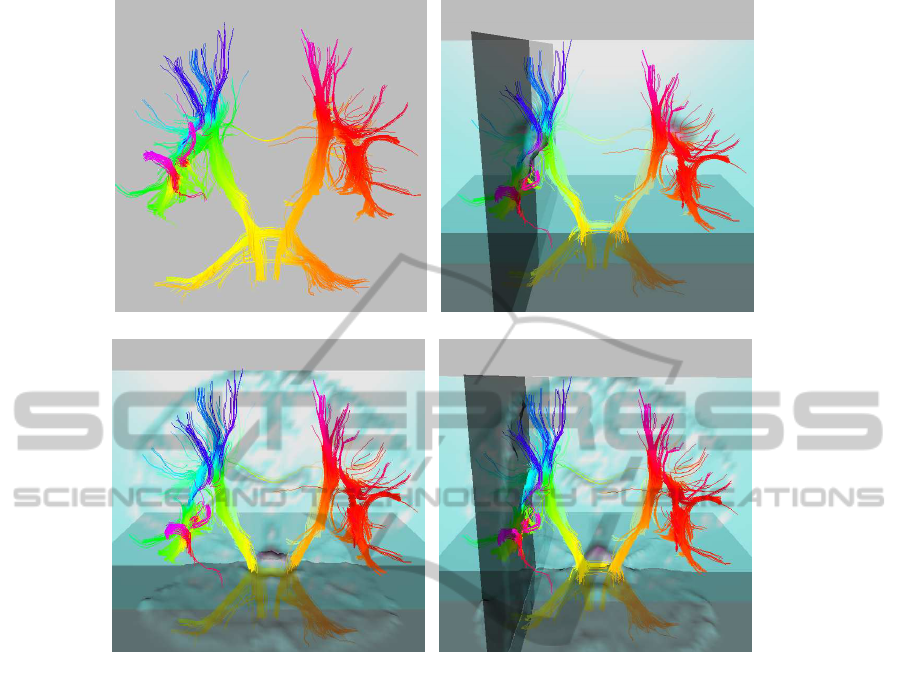
(a) (b)
(c) (d)
Figure 4: Panels representing the 3D OpenGL interface used to visualize the estimated fiber pattern in the context of the brain
anatomy: (a) Estimated fiber pattern using multiple directional orientation and multiple fiber tracts per voxel; In (b) fiber
tracts are overlayed on image slices of the selected ROI region; In (c) and (d) fiber tracts are overlayed on image slices of the
brain.
ance between fiber bundle density and running time.
The usual criteria for line keeping and line termina-
tion have been adopted. In particular, the following
criteria have been specified: minimum fiber length
(50 mm), maximum fiber length (600 mm), maximum
admissible fiber deviation angle(60
o
), and general-
ized fractional anisotropy threshold (0.2). In Figure 4
we show several panels representing the 3D OpenGL
(Adler and Murdoch, 2010) interface used to visual-
ize the estimated fiber pattern in the context of the
brain anatomy. Figure 4(a) illustrates the pattern of
interconnections using the voxels in SLF and CT re-
gions as seeds, and bundles with 10 randomly initial-
ized tracts per voxel. Figure 4(b) maps the fiber tracts
overlayed on image slices of the selected ROI region.
Figure 4(c) and Figure 4(d) map the fiber tracts over-
layed on image slices of the brain.
4 CONCLUSIONS
We have presented a HARDI reconstruction approach
incorporating directional statistics informationto sup-
port in vivo fiber tractography. Based on experiments,
the proposed approach was found to be more accurate
in estimating local fiber orientations than traditional
deterministic techniques based on multiple maxima
extraction. Directional accuracy impacts strongly on
the quality of the reconstructed fiber maps, and sub-
sequent interpretation of fiber tract anatomy for use
in clinical imaging. An extended tractographic pro-
cedure able to accommodate multiple pathways and
bundled fibers was outlined to profit from the richer
directional information gathered at each voxel.
The proposed approach applies statistical infor-
mation criteria to decide on the number of compo-
nents (voxel fibers) to select. The BIC selection cri-
terion used for discriminating between single- and
FacingtheChallengeofEstimatingHumanBrainWhiteMatterPathways
713

crossing-fiber voxel configurations, as well as for es-
timating the number of fibers per voxel, was adequate.
Nevertheless, one drawback of the proposed method-
ology concerns the necessity of applying model se-
lection criteria to estimate the number of components
in the mixture. For multiple fiber profiles, the fit-
ting process has to be applied repeatedly to different
configurations before the best final decision is esti-
mated. This algorithmic process entails higher time-
complexities than deterministic ones.
We believe that the directional statistics technique
proposed in this work offers significant increases in
sensitivity for anatomical analysis over traditional ap-
proaches. We intend to build on the quantitative and
qualitative information provided by the proposed di-
rectional statistics approach to support the study of
fiber tract architecture in the brain. In particular, this
information may be explored to build robust prob-
abilistic tractographic algorithms for complex fiber
configurations.
REFERENCES
Adler, D. and Murdoch, D. (2010). rgl: 3D Visualiza-
tion Device System (OpenGL). R package version
0.92.879.
Banerjee, A., Dhillon, I. S., Ghosh, J., and Sra, S. (2005).
Clustering on the Unit Hypersphere using von Mises-
Fisher Distributions. Journal of Machine Learning
Research, 6:1345–1382.
Basser, P. J., Pajevic, S., Pierpaoli, C., Duda, J., and Al-
droubi, A. (2000). In Vivo Fiber Tractography Us-
ing DT-MRI Data. Magnetic Resonance in Medicine,
44:625–632.
Cho, K.-H., Yeh, C.-H., Tournier, J.-D., Chao, Y.-P., Chen,
J.-H., and Lin, C.-P. (2008). Evaluation of the accu-
racy and angular resolution of q-ball imaging. Neu-
roImage, 42:262–271.
Descoteaux, M., Deriche, R., Kn¨osch, T. R., and Anwan-
der, A. (2009). Deterministic and Probabilistic Trac-
tography Based on Complex Fibre Orientation Dis-
tributions. IEEE Transactions on Medical Imaging,
28(2):269–286.
Hornik, K. and Gr¨un, B. (2011). Mixtures of von Mises
Fisher Distributions. R package version 0.0-0.
Jian, B., Vemuri, B. C.,
¨
Ozarslan, E., Carney, P. R., and
Mareci, T. H. (2007). A novel tensor distribution
model for the diffusion-weighted MR signal. Neu-
roImage, 37:164–176.
Jiang, H., Golay, X., van Zijl, P. C., and Mori, S. (2002).
Origin and minimization of residual motion-related
artifacts in navigator-corrected segmented diffusion-
weighted EPI of the human brain. Magnetic Reso-
nance in Medicine, 47:818–822.
Kuo, L.-W., Chen, J.-H., Wedeen, V. J., and Tseng, W.-Y. I.
(2008). Optimization of diffusion spectrum imaging
and q-ball imaging on clinical MRI system. NeuroIm-
age, 41:7–18.
Lenglet, C., Campbell, J. S. W., Descoteaux, M., Haro, G.,
Savadjiev, P., Wassermann, D., Anwander, A., De-
riche, R., Pike, G. B., Sapiro, G., Siddiqi, K., and
Thompson, P. M. (2009). Mathematical methods for
diffusion MRI processing. NeuroImage, 45(1, Supple-
ment 1):S111–S122.
Mardia, K. V. and Jupp, P. (2000). Directional Statistics.
John Wiley and Sons Ltd., 2nd edition.
Mori, S. and van Zijl, P. C. M. (2002). Fiber tracking:
principles and strategies - a technical review. NMR
in Biomedicine, 15:468–480.
¨
Ozarslan, E., Shepherd, T. M., Vemuri, B. C., Blackband,
S. J., and Mareci, T. H. (2006). Resolution of complex
tissue microarchitecture using the diffusion orienta-
tion transform (DOT). NeuroImage, 31:1086–1103.
Polzehl, J. and Tabelow, K. (2011). dti: Beyond the Gaus-
sian Model in Diffusion-Weighted Imaging. Journal
of Statistical Software, 44(12).
R Development Core Team (2010). R: A Language and
Environment for Statistical Computing. R Foundation
for Statistical Computing, Vienna, Austria.
Smith, S. M., Jenkinson, M., Woolrich, M. W., Beckmann,
C. F., Behrens, T. E. J., Johansen-Berg, H., Bannis-
ter, P. R., Luca, M. D., Drobnjak, I., Flitney, D. E.,
Niazy, R. K., Saunders, J., Vickers, J., Zhang, Y., Ste-
fano, N. D., Brad, J. M., and Matthews, P. M. (2004).
Advances in Functional and Structural MR Image
Analysis and Implementation as FSL. Technical Re-
port TR04SS2, FMRIB (Oxford Centre for Functional
Magnetic Resonance Imaging of the Brain).
Yeh, F.-C., Wedeen, V. J., and Tseng, W.-Y. I. (2010). Gen-
eralized q-Sampling Imaging. IEEE Transactions on
Medical Imaging, 29(9):1626–1635.
IJCCI2012-InternationalJointConferenceonComputationalIntelligence
714
