
Closed-looping a P300 BCI using the ErrP
Rousseau Sandra, Jutten Christian and Congedo Marco
Gipsa-lab-DIS, 11 Rue des math
´
ematiques Domaine Universitaire, 38400 Saint-Martin d’H
´
eres, France
Keywords:
BCI, Error-related Potential, Closed-loop.
Abstract:
The error-related potential is an event-related potential that gives information on the quality (error or correct)
of what a subject observes. In this paper we try to integrate it in a P300 BCI system in order to introduce
a closed-loop in this system and thus to improve its accuracy. We propose and compare different strategies
of integration and discuss on their possible improvements depending on our system characteristics. We get a
mean improvement of 10% of our system when using the error-related potential to correct errors.
1 INTRODUCTION
BCI are systems that aim at decoding brain signals
and convert them into orders for driving an external
device. One very well known BCI is the P300 speller
which allows a subject to spell words using a virtual
keyboard. Actual BCIs performances need to be im-
proved in order for them to be more easily usable.
One way of improving this accuracy is to include
a control loop based on error detection which can
be performed with the error-related potential. Error-
related potentials (ErrP) are evoked potentials which
are generated when a subject makes or observes an
error (Falkenstein et al., 1991),(Gehring et al., 1993).
It is time-locked to the observation of the error and
is mostly characterized by a negative deflection (Ne)
(Gentsch et al., 2009), followed by a large positivity
(Pe) (Steinhauser and Kiesel, 2011). Single-trial de-
tection of this potential is now the subject of many
studies. As any ERP, the signal to noise ratio of the
ErrP is very low and it is hard to see it on a single
trial basis. However most studies reached in average
a rate of 70% of good detection for error trials and a
rate of 80% of good detection for correct trials (Ferrez
and Mill
´
an, 2005),(Chavarriaga et al., 2007),(Bollon,
J. and Chavarriaga, R. and Mill
´
an, J. and Bessiere, P.,
2009). In this paper we study the possible integration
of the ErrP in a P300 BCI as an error correction sys-
tem. Indeed, when the BCI makes an error, an ErrP
appears in the subject’s EEG. If one can detect this
ErrP then it could be used as a control loop to cor-
rect errors made from the BCI. Some authors already
studied thie issue in two to four clas BCIs (Ferrez and
Mill
´
an, 2007), (Ferrez and Mill
´
an, 2008) or in multi-
class BCIs (Dal Seno et al., 2010). Here we present
different kind of strategies that can be used to cor-
rect BCI errors in a P300 speller and what kind of im-
provement can be achieved. First we study the charac-
teristics of different P300 datasets in order to see the
repartition of errors and corrects probabilities. Then,
using these observations, we propose different strage-
gies for ErrP integration and test them on our datasets
according to different performances of our system.
Finally we discuss on their different advantages and
disadvantages.
2 STUDYING A P300 SPELLER
In order to determine what kind of strategy could be
used to integrate ErrPs in a P300 speller we study the
characteristics of a P300 system.
2.1 Datasets
For this study we used two datasets available on-
line from BCI competitions (Blankertz et al., 2004)
(http://www.bbci.de). The two data sets come from
the same paradigm (Farwell and Donchin, 1988). The
user was presented with a 6 by 6 matrix of characters.
The user’s task was to focus attention on characters
that were prescribed by the investigator (one character
at a time). For each character, all rows and columns of
this matrix were successively and randomly intensi-
fied (leading to 12 intensifications). This was repeated
15 times (leading to 15×12 = 180 intensifications for
each character). For each character, user display was
as follows: the matrix was blank for 2.5 s. Then each
732
Sandra R., Christian J. and Marco C..
Closed-looping a P300 BCI using the ErrP.
DOI: 10.5220/0004183707320737
In Proceedings of the 4th International Joint Conference on Computational Intelligence (SSCN-2012), pages 732-737
ISBN: 978-989-8565-33-4
Copyright
c
2012 SCITEPRESS (Science and Technology Publications, Lda.)

row and column was randomly intensified for 100 ms.
After intensification of a row/column, the matrix was
blank for 75 ms. Then a 2.5 s period of rest was al-
lowed during which the matrix was blank. Subjects
were asked to spell predefined words separated into
different sessions. For the first dataset, signals were
collected from two subjects in five sessions each.For
the second dataset signals were collected from one
subject in three sessions. All data were digitized at
240Hz.
2.2 Preprocessing and Classification
The same method was used for every subject. Data
were bandpass filtered between 0.2-20Hz and spa-
tially filtered using xDAWN algorithm (Rivet et al.,
2009). For each character and repetition the corre-
sponding signal was defined as the sum of the one
second EEG signal following its corresponding row
intensification and the one following its correspond-
ing column intensification. Trials were then classi-
fied using a Bayesian LDA classifier (MacKay, 1992).
This type of classifier returns for each letter a proba-
bility that it belongs to the target class. Classifica-
tion is calculated for each repetition, the final score
for each character is computed as the sum of its prob-
abilities for each repetition:
s(l) =
n
∑
i=1
p(l, i) (1)
where s(l) is the score of the letter l and p(l, i) is the
probability given to the letter l by the LDA classifier
at repetition i. The character to be spelled is chosen as
the one having the highest final score. We will define
this highest score s
1
, the second highest score will be
refered to as s
2
and so on. A ten-fold cross validation
method was used.
2.3 Results
2.3.1 Classification Results
In Figure 1 we plot the classification results for each
subject versus the number of repetitions used. With-
out surprise the classification rate improves with the
growing number of repetitions.
It is clear that one way of improving a P300 speller
is simply to increase the number of repetitions, how-
ever this also increases the time spent to spell a letter
and thus slows down the system.
2.3.2 Second Best Score
In a second time we got interested in the conditions
of failure of our classifier. Thus we studied what hap-
(a) Subject 1 (dataset 1).
Figure 1: Classification results for different subjects in
function of the number of repetitions. Each line corresponds
to a subject.
pened when the highest score (s
1
) did not correspond
to the target character. Especially we looked at the
probability that the second highest score (s
2
) corre-
sponds to the target letter (when s
1
does not). In fig-
ure 2 we plot this probability for different subjects.
We can see that this probability can be very low and
very different from one subject to another and that no
clear dependency on the number of repetitions can be
deduced.
(a) Subject 1 (dataset 2).
Figure 2: Classification results using second highest score
(when highest score is not the target) for different subjects.
Each line corresponds to a subject.
2.3.3 Highest Score Repartition
Finally we studied the repartition of the highest score
(s
1
) and the second highest score (s
2
). We separated
our data into three classes:
• s
1
corresponds to the target letter.
• s
1
does not correspond to the target letter, s
2
does.
• neither s
1
nor s
2
correspond to the target letter.
Then we looked at the evolution of our scores s
1
and
s
2
and of their difference (s
1
− s
2
) in these different
classes. In figure 3 we plot this repartition for the
different subjects. In this figure we can see that for
Closed-loopingaP300BCIusingtheErrP
733
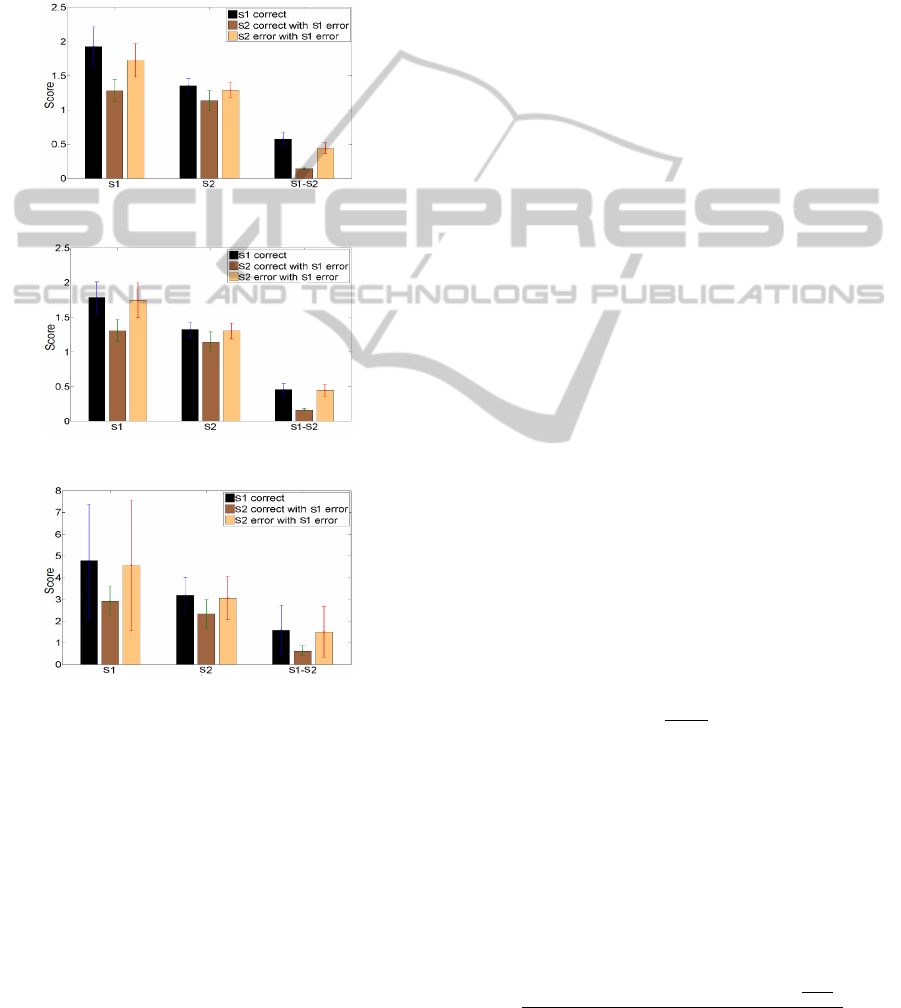
the three subjects s
1
is much lower when the target
character corresponds to the second highest score (s
2
).
The same observation can be made for their difference
(s
1
−s
2
) for which the effect is even stronger. This ob-
servation suggests that when s
1
−s
2
is low the second
highest score would correspond to the target character
and inversely when s
1
− s
2
is high the second highest
score would not correspond to the target character.
(a) Subject 1 (dataset 1).
(b) Subject 2 (dataset 1).
(c) Subject 1 (dataset 2).
Figure 3: Highest final scores after 10 repetitions. We
plot the mean value (standard error) fors
1
, s
2
and their dif-
ference (s
1
− s
2
) in three different conditions: 1)s
1
corre-
sponds to the target letter, 2)s
2
corresponds to the target let-
ter c)Neither s
1
nor s
2
correspond to the target letter.
3 PROPOSITIONS OF
INTEGRATION
Now that we have observed the performance of our
P300 system and its characteristics we propose to
simulate the integration of the ErrP in this system as
an error correction system. As we have said before
ErrP detection is not perfect and is subject to errors.
Thus we will study the impact of our error-detection
(ED) performances on our results.
3.1 Integration
ErrP can be integrated in different ways in BCI sys-
tems in order to correct errors. Using the previously
presented observations we have selected four differ-
ent strategies of integration:
• C: Canceling the command (i.e. erasing the
letter). This method is the one that has been
mostly used in previous studies on ErrP integra-
tion (Dal Seno et al., 2010).
• CI: Canceling the command and starting a new
shorter session. The scores resulting from this
new session will then be added to our original
scores and a new decision will be made from our
BCI system.
• R: Replacing the command by the one corre-
sponding to the second highest score.
• RC: Replacing the command by the one corre-
sponding to the second highest score only if the
difference s
1
− s
2
is lower than a predetermined
threshold. If it is higher nothing is done.
3.2 Performance Measurement
The performance of a BCI can be assessed in different
ways depending on what we want to optimize. Here
we used three different performance measures which
evaluate different qualities of our system:
• Classification Rate (T
f
): this is the classification
accuracy of our system for one trial. This is of
great use if one desires a BCI that is very precise.
The main disadvantage of this measure is that it
does not take time into account. It is defined as:
T
f
=
NbC
NTot
(2)
with NbC being the number of trials correctly
classified and NTot the total number of trials.
• Information Transfer Rate (ITR): this measure is a
more complex one which takes into account both
the classification accuracy, the time spent for a
trial and the information it contains. With a clas-
sification accuracy of T
f
, a trial duration of c and
N possible outcomes, the ITR is defined as:
B =
log
2
(N) + T
f
log
2
(T
f
) + (1 − T
f
)log
2
(
1−T
f
N−1
)
c
(3)
IJCCI2012-InternationalJointConferenceonComputationalIntelligence
734

• Utility Metric (U): it was proposed by (Dal Seno
et al., 2010). The main difference with the ITR is
that here we consider the special case where the
subject has to perform perfectly his task. Thus,
when an error occurs the subject has to cancel the
order and restart the trial. Let us define TL the
time to perform correctly a task:
T L = T
f
c + (1 − T
f
)(c +T B + T L) =
c
2T
f
− 1
where TB is the time spent to cancel the com-
mand, here we assume it is equivalent to any other
command with T B = T L. The utility measure is
then defined as:
U =
bL
T L
(4)
where bL is the benefit of a letter, if each letter is
equiprobable then bL = log
2
(N − 1) bits.
3.3 Threshold
To determine the threshold for the RC strategy data
were classified using the trained classifier, for each
trial i we have D(i) = s
1
(i) − s
2
(i). D values are then
divided into two groups: Group 1 contains trials for
which s
1
corresponds to the target letter and Group
2 contains trials for which s
2
corresponds to the tar-
get letter. The threshold T is defined as the frontier
between these two groups using LDA.
3.4 Derivation of the Performance
Measures
Here we will present the different performance mea-
sures of the closed-loop system according to the cho-
sen strategy.
3.4.1 Local Variables
Let us first define several variables:
• T
f
(n): P300 classification rate with n repetitions.
• T
c
: ErrP classification rate for correct trials.
• T
e
: ErrP classification rate for error trials.
• T
f 2
: P300 classification rate using s
2
when s
1
is
not correct.
• T
r1
: Probability that (s
1
− s
2
) < T when s
1
was
not correct (i.e. error will be corrected).
• T
r2
: Probability that (s
1
− s
2
) > T when s
1
was
correct (i.e. correct will not be modified).
• T
f c
: P300 classification rate with n+p repetitions
when T
f
(n) was correct.
• T
f e
: P300 classification rate with n+p repetitions
when T
f
(n) was not correct.
3.4.2 Canceling Strategy (C)
Classification accuracy and ITR are defined as (refer
to (Ferrez and Mill
´
an, 2005) for more details):
T
f b
=
T
f
T
c
T
f
T
c
+ (1 −T
e
)(1 − T
f
)
(5)
IT R
b
= s
t
log
2
(N) + T
f b
log
2
(T
f b
) + (1 − T
f b
)log
2
(
1−T
f b
N−1
)
c
(6)
with s
t
= (T
f
T
c
+ (1 − T
e
)(1 −T
f
)).
The time spent to correctly spell a letter is (re-
fer to (Dal Seno et al., 2010) for more details):
T L =
c
T
f
T
c
+ (1 −T
f
)T
e
+ T
f
− 1
(7)
3.4.3 Canceling and Iteration Strategy (CI)
Here trials detected as errors will be restarted and will
have a new probability of being corrects giving a clas-
sification accuracy of:
T
f b
= T
f
T
c
+ (1 −T
f
)T
e
T
f e
+ T
f
(1 − T
c
)T
f c
(8)
Thus TL will be defined as:
T L =
(1 + a(r
p
(1 − r
c
) + r
e
(1 − r
p
)))c
(1 − 2(r
p
(1 − r
c
)(1 − r
pn1
) + (1 − r
p
)(1 − r
e
r
pn2
))
(9)
Now we will only present T
f b
, ITR and U can be
derived by replacing T
f
by T
f b
in their definition.
3.4.4 Replacement Strategy (R)
Here trials detected as errors are replaced by another
letter thus we get for the classification accuracy:
T
f b
= T
f
T
c
+ (1 −T
f
)T
e
T
f 2
(10)
3.4.5 Replacement under Condition Strategy
(RC)
Here the difference with the previous method is that
only a fraction of erroneously detected correct trials
will be modified and only a proportion of correctly
detected error trials will be corrected:
T
f b
= T
f
T
c
+ T
f
(1 − T
c
)T
r2
+ (1 −T
f
)T
e
T
f 2
T
r1
(11)
Closed-loopingaP300BCIusingtheErrP
735
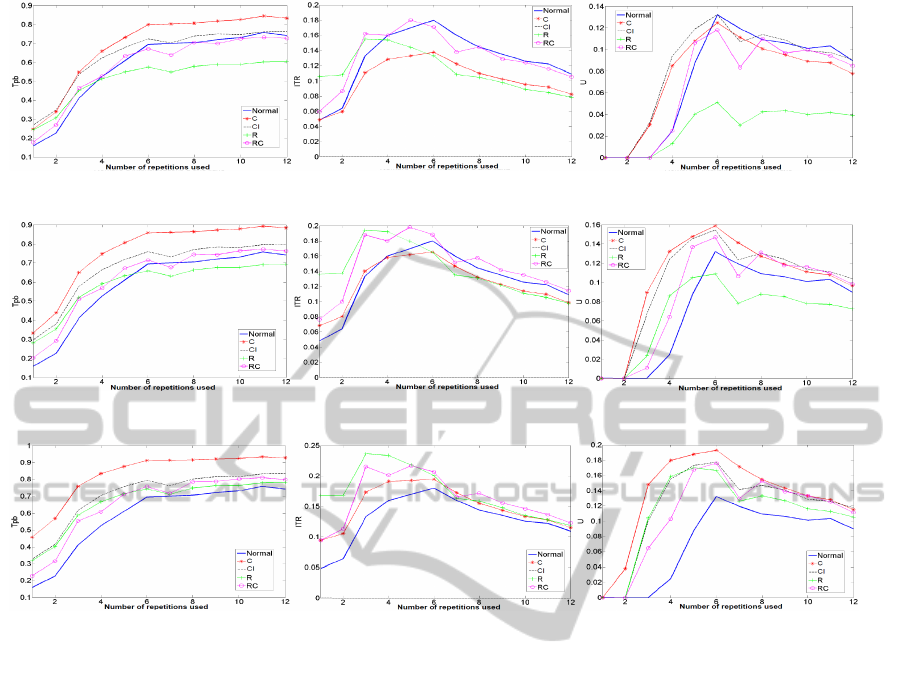
(a) Tf, Te=0.6, Tc=0.7. (b) ITR, Te=0.6, Tc=0.7. (c) U, Te=0.6, Tc=0.7.
(d) Tf, Te=0.7, Tc=0.8. (e) ITR, Te=0.7, Tc=0.8. (f) U, Te=0.7, Tc=0.8.
(g) Tf, Te=0.8, Tc=0.9. (h) ITR, Te=0.8, Tc=0.9. (i) U, Te=0.8, Tc=0.9.
Figure 4: Evolution of our different performance measures (Tf, ITR and U) with the number of repetitions used for different
performances of our ED.Each column of plots correspond to a different measure of performance. Each line of plots correspond
to a different performance of our ED. In each plot, each line corresponds to a different strategy of integration.
4 RESULTS
Integration was tested for n ∈ [1, 15] (n is the number
of repetitions). We used three new repetitions (a = 3)
for the iteration strategy (CI). Different performances
of our error-detection system (ED) were tested: T
e
∈
{60%, 70%, 80%} and T
c
∈ {70%, 80%, 90%}. In fig-
ure 4 we plot the results for one subject. First of all
one can see how much our performance measures are
different. Each strategy performs differently for each
performance measure. Here we present figures for
only one subject but the observations made also ap-
ply to the other subjects.
4.1 Classification Accuracy
Concerning the classification accuracy, one can see
that this measure improves with growing number of
repetitions for any type of integration strategy. More-
over, it seems that strategies C and CI allow improve-
ment of the BCI system even for low performances
of our ED (T
e
= 0.6 and T
c
= 0.7), with strategy C
being the most performant one. Strategies R and RC
allow improvement of the initial system only for high
performances of our ED (T
e
≥ 0.7 and T
c
≥ 0.8) and
never outperform strategy C. Thus it seems that if one
aims at simply improving the classification accuracy
of a system the best strategy of integration would be
C (ie, cancellation of a trial).
4.2 Information Transfer Rate
One can see that it does not increase with the growing
number of repetitions, because the duration of a trial
is taken into account. Integration results are very dif-
ferent from those obtained with T
f
. Here strategy C
allows improvement only for high performance of our
ED (T
e
≥ 0.8 and T
c
≥ 0.9). Strategies R and RC are
the best ones with strategy RC being more stable than
R (for low ED performances RC does not degrade our
IJCCI2012-InternationalJointConferenceonComputationalIntelligence
736

system while R does). Finally one can note that the
ITR follows the same evolution (for growing number
of repetitions) before and after integration of our er-
ror correction system. If one aims at improving the
ITR it seems that the best strategy would be RC (ie,
replacement under conditions).
4.3 Utility Metric
Once again, the utility metric (U) does not necessarily
increase with growing number of repetitions. For low
performances of our ED (T
e
= 0.6 and T
c
= 0.7) there
does not seem to be one particular strategy clearly
outperforming the others. However one can see that
strategy R gives very poor results. For higher perfor-
mances of our ED (T
e
≥ 0.8 and T
c
≥ 0.9) it seems that
strategy A is slightly better than the other but this is
not significant. However one can note that with these
performances each strategy brings high improvement.
4.4 Discussion
In this paper we have simulated the integration of the
ErrP as an error-correction system in a P300 speller
BCI . We have presented different strategies of inte-
gration and studied their impact on the BCI perfor-
mances. Using different types of performance mea-
sures we have seen that each strategy had some ad-
vantages and some disadvantages. The overall best
strategy seems to be the strategy of canceling the erro-
neous order when it is detected since it gives the best
results in terms of classification accuracy and of util-
ity measure. However the measure used in most stud-
ies to assess the performance of multiclass BCIs is the
ITR. For the ITR it seems that the best strategy is the
strategy of replacing the erroneous command by the
one obtaining the second best score under condition.
Thus, one can not state for a best strategy. However
what can be noted is that for high performances of
our error-detection system every strategy allows im-
provement of our system for any type of performance
measure. Moreover for T
e
= 0.8 and T
c
= 0.9 we get a
mean improvement (over subject) of 11% of the clas-
sification accuracy , of 9% of the ITR and of 10% of
the utility metric (each time for the best integration
strategy). Thus we have seen that the ErrP could be
used as an error-correction system in a multiclass BCI
and that, even if it did not bring results as performant
as for a two class BCI, one can get an improvement
of around 10% of our system which is very encourag-
ing. However we have also seen that the integration
strategy should be carefully chosen according to the
systems characteristics and to what one wants to im-
prove.
ACKNOWLEDGEMENTS
We are grateful to the project ANR OpenVibe.
REFERENCES
Blankertz, B., Muller, K., Curio, G., Vaughan, T., Schalk,
G., Wolpaw, J., Schlogl, A., Neuper, C., Pfurtscheller,
G., Hinterberger, T., and et al. (2004). The bci compe-
tition 2003: progress and perspectives in detection and
discrimination of eeg single trials. Biomedical Engi-
neering, IEEE Transactions on, 51(6):1044–1051.
Bollon, J. and Chavarriaga, R. and Mill
´
an, J. and Bessiere,
P. (2009). Eeg error-related potentials detection with
a bayesian filter.
Chavarriaga, R., Ferrez, P. W., and Mill
´
an, J. (2007). To err
is human: Learning from error potentials in braincom-
puter interfaces. Int Conf Cognitive Neurodynamics,
pages 777–782.
Dal Seno, B., Matteucci, M., and Mainardi, L. (2010).
The utility metric: a novel method to assess the over-
all performance of discrete brain computer interfaces.
Neural Systems and Rehabilitation Engineering, IEEE
Transactions on, 18(1):20–28.
Falkenstein, M., Hohnsbein, J., Hoormann, J., and Blanke,
L. (1991). Effects of crossmodal divided attention on
late erp components.ii. error processing in choice re-
action tasks. Electroencephalogr. Clin. Neurophysiol.,
78:447–455.
Farwell, L. A. and Donchin, E. (1988). Talking off the
top of your head: toward a mental prosthesis utiliz-
ing event-related brain potentials. Electroencephalogr.
Clin. Neurophysiol, 70(6):510–523.
Ferrez, P. and Mill
´
an, J. (2005). You are wrong! automatic
detection of interaction errors from brain waves. In
Proceedings of the 19th International Joint Confer-
ence on Artificial Intelligence.
Ferrez, P. and Mill
´
an, J. (2007). Eeg-based brain computer
interaction: Improved accuracy by automatic single-
trial error detection. In Proc. NIPS.
Ferrez, P. and Mill
´
an, J. (2008). Simultaneous real-time de-
tection of motor imagery and error-related potentials
for improved bci accuracy. In Proc 4th Intl. Brain
Computer Interface Workshop and Training Course.
Gehring, W., Goss, B., Coles, M., Meyer, D., and Donchin,
E. (1993). A neural system for error detection and
compensation. Psychol. Sci., 4:385–390.
Gentsch, A., Ullsperger, P., and Ullsperger, M. (2009). Dis-
sociable medial frontal negativities from a common
monitoring system for self-and externally caused fail-
ure of goal achievement. Neuroimage, 47(4):2023–
2030.
MacKay, D. (1992). Bayesian interpolation. Neural com-
putation, 4(3):415–447.
Rivet, B., Souloumiac, A., Attina, V., and Gibert, G. (2009).
xdawn algorithm to enhance evoked potentials: Appli-
cation to brain computer interface. Biomedical Engi-
neering, IEEE Transactions on, 56(8):2035–2043.
Steinhauser, M. and Kiesel, A. (2011). Performance moni-
toring and the causal attribution of errors. Cognitive,
Affective, & Behavioral Neuroscience.
Closed-loopingaP300BCIusingtheErrP
737
