
Analysis of Electroencephalogram and Pulse Waves during Music
Listening
Wenbiao Wang, Yuyu Hu, Mayumi Oyama-Higa, Takashi Suzuki
Department of Systems Innovation, Osaka University, Toyonaka, Osaka 560-8531, Japan
Tiejun Miao
CCI Corporation, Shinagawa-ku, Tokyo 141-0001, Japan
Chaos Technology Research Laboratory, Ōtsu, Shiga 520-2134, Japan
Junji Kojima
Rakuwakai Otowa Hospital, Yamashina-ku, Kyoto 607-8062, Japan
Keywords: Scalp Electroencephalogram, Finger Plethysmogram, Largest Lyapunov Exponent, Parasympathetic Nerve.
Abstract: A tentative study is performed on the psychological effects of music based on the analysis of physiological
indexes. We measured simultaneously the scalp electroencephalograms (EEG) and fingertip pulse waves for
six healthy subjects before, during and after listening to music. The values of their low frequency (LF) and
high frequency (HF) components of heart rate variability are obtained. By the method from chaos analysis,
we calculated the largest Lyapunov exponents (LLE) of both scalp EEG and finger plethysmogram.
Comparing the data of the resting condition and the music-listening condition, we observed significant
tendencies over all subjects. We found that both values of LF and HF decreased, and so did the mean value
taken over 14 EEG channels which were used for computation of LLE, whereas the distribution of the
values tends to become average. Furthermore, it is notable that this averaging degree of LLE of scalp EEG
generally accords with the decreasing rate of HF which reflects the activity of parasympathetic nerves.
1 INTRODUCTION
It is long believed that music has a certain impact on
human mental performance. In recent years
numerous studies have been carried out on exploring
its psychological effect and therapeutic applications
(Unkefer, 1990; McCraty et al., 1998; Schneck and
Berger, 2006). However, just as what Schneck and
Berger mentioned in their monograph, the existing
music literature offers a bewildering array of
unconnected ideas, thoughts, and theories.
Our attention is drawn to changes of certain
physiological indexes that are caused by the
behaviour of listening to music. A preceding work
(Miao et al., 2011) has found that music yields a
decrease in both the largest Lyapunov exponents
(LLE) obtained from finger plethysmograms and
those from the occipital and right cerebral areas of
scalp electroencephalograms (EEG), which gave
good agreement with the theoretical prediction
obtained by a mathematical model they proposed.
The choice of the index LLE is justified, since it
not only characterizes the exponential diverging rate
of trajectories in chaotic systems according to its
definition, but can serve as a significant indicator of
“mental immunity” as discovered by recent studies
(Imanishi and Oyama-Higa, 2006; Oyama-Higa and
Miao, 2006; Oyama-Higa, Miao and Mizuno-
Matsumoto, 2006; Hu et al, 2011). Specifically,
mental health can be kept only if LLE fluctuate
normally over time; continuously low or high values
indicate low adaptability to external environment or
excessive nervousness, respectively. This study still
made use of this index.
In addition, since spectral analysis on heart rate
variability is able to evaluate the activity of the
autonomic nervous system, we took into account the
high frequency (HF, 0.15-0.40 Hz) component,
31
Miao T., Oyama-Higa M., Kojima J., Suzuki T., Wang W. and Hu Y. (2012).
Analysis of Electroencephalogram and Pulse Waves during Music Listening.
In Proceedings of the Sixth International Symposium on e-Health Services and Technologies and the Third International Conference on Green IT
Solutions, pages 31-35
DOI: 10.5220/0004473700310035
Copyright
c
SciTePress
regarded as an index of parasympathetic nerve
activity, and the low frequency (LF, 0.04-0.15 Hz)
component, influenced by both sympathetic and
parasympathetic nerves. A properly defined ratio
“autonomic nerve balance (ANB)” was also
considered.
To sum up, this tentative study is aimed at
exhibiting and explaining the music effect in terms
of changes in LF, HF and LLE of both finger
plethysmogram and scalp EEG.
2 EXPERIMENT AND METHOD
2.1 Experiment Procedure
The subjects are healthy students from Osaka
University in Japan. They include 5 males and 1
female (labelled with alphabets A to F), whose
average age is 24.63 with a standard deviation of
2.45. Informed consent was obtained from all
subjects. The place of the experiment is an
examination room of Rakuwakai Otowa Hospital in
Kyoto, Japan. The measuring instruments are a
photoplethysmography sensor (Mini PGL, Model
MPULSE-01) and a multi-channel EEG recorder
(Neurofax EEG-1200, developed by Nihon Kohden
Corporation) with 14 active electrodes.
We chose two famous Japanese songs for the
subjects to listen to: Jidai (Time), a 1975 song by
Miyuki Nakajima, and Kawa no nagare no yō ni
(Like the Flow of the River), the last single recorded
by decreased prominent enka singer Hibari Misora.
Both are highly recognized songs, with well-crafted
poetic lyrics and melodic gentle music.
The subjects were asked to lie down on a bed
and keep their eyes closed during the whole process.
When the instruments were ready and the subjects
were relaxed, the first five-minute measurement
began. Then the music was played through their
headphones, while their pulse waves and EEG were
taken for another five minutes. After listening to
music, their resting condition was measured for the
last five minutes.
2.2 Analysis Method
The method for estimating LLE taken from the
subjects is the same with the recent work (Miao et
al., 2011). The improved Rosenstein algorithm (Liu
et al., 2005) was employed to reconstruct the phase
space. The false nearest neighbour method gave the
embedding dimensions d = 4 for time series of
finger plethysmograms and d = 8 for that of scalp
EEG. The first minimum of average mutual
information (Fraser and Swinney, 1986) was applied
to determine the time delay. We found the time
delay being 50ms for both plethysmogram and EEG
in the experiments.
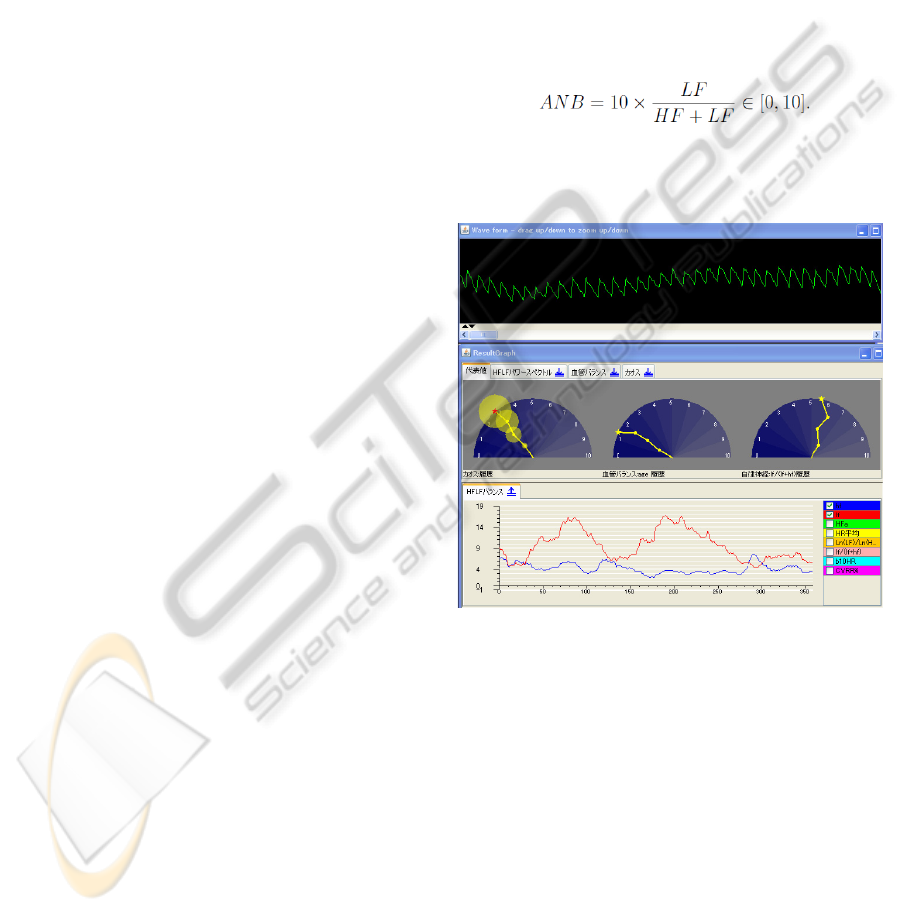
LF and HF were obtained by the analysis
software “Lyspect” (Oyama-Higa et al., 2012),
developed by Chaos Technology Research Lab. The
results are displayed in a panel (Figure 1), where the
line graph at the bottom shows changes of LF (in
red) and HF (in blue) over time. The autonomic
nerve balance (ANB), shown in the right-side
semicircular graph, is defined as a normalized value:
(1)
Thus, ANB < 5 indicates predominance of
parasympathetic nerve while ANB > 5 indicates
sympathetic predominance.
Figure 1: Lyspect analysis results.
3 ANALYSIS AND RESULT
3.1 LLE of Scalp EEG
Figure 2 shows the mean values of LLE over the 14
scalp EEG channels, obtained from the subjects
during the three five-minute conditions: before,
during and after listening to music.
The specific changes at each channel are
displayed by topographical two-dimensional maps
(Figure 3), in which deeply coloured area indicates a
high value and vice versa.
EHST/ICGREEN 2012
32
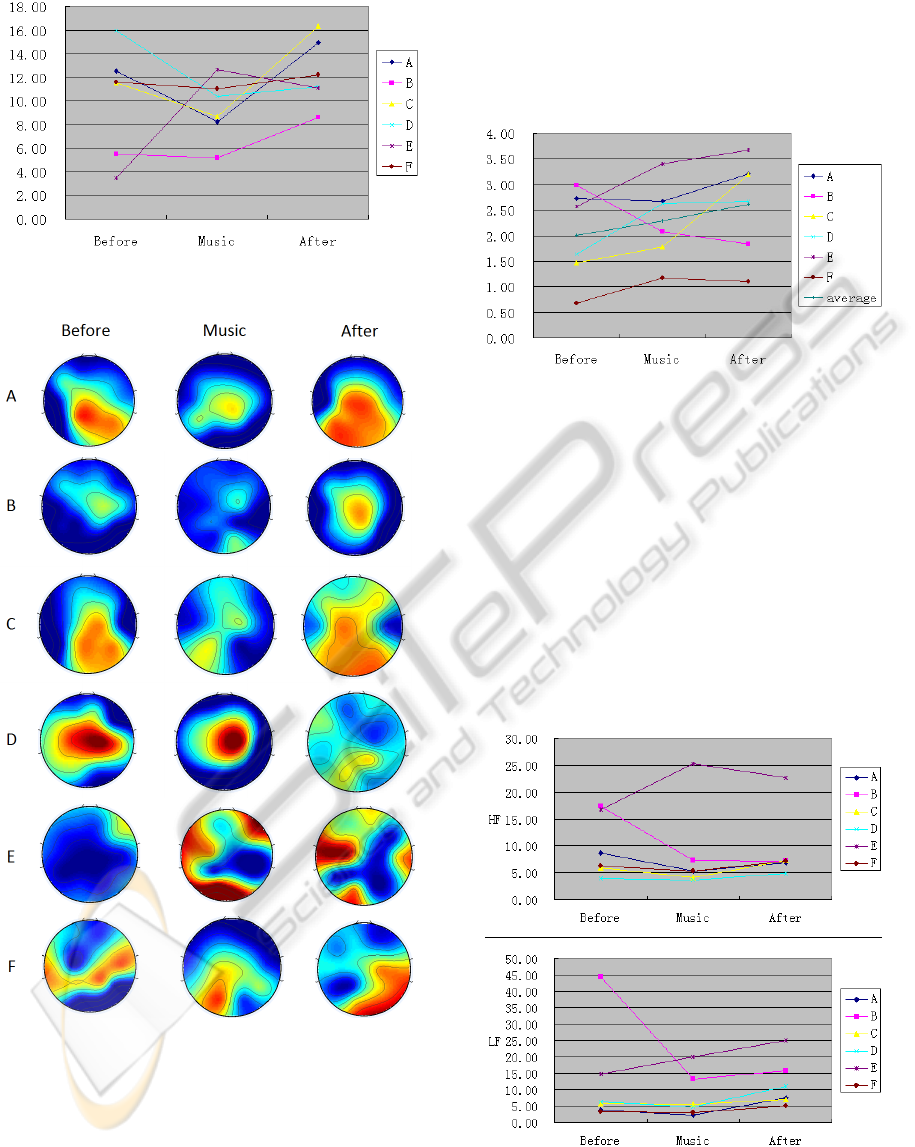
Figure 2: LLE of EEG: mean values taken over the 14
channels.
Figure 3: LLE of EEG: distribution at each of the 14
channels.
From Figure 2, we found in all subjects but
Subject E a “decreasing then increasing” tendency in
the mean of LLE taken over the EEG channels.
Besides, what deserve more attention are the maps
of Figure 3. We observed that, in all subject except
Subject E, the distribution of LLE at EEG channels
became average after they listened to music.
3.2 LLE of Finger Plethysmogram
Figure 4 exhibits LLE of finger plethysmogram, also
taken from the conditions prior to, during and
posterior to music listening, respectively.
Figure 4: LLE of plethysmogram.
There exist both increasing (Subjects C, D, E and
F) and decreasing (Subjects A and B) tendencies in
the subjects. Moreover, the average LLE of
plethysmogram over the 6 subjects increased after
exposure to music. Therefore, in terms of changes in
LLE of finger plethysmogram, this result does not
correspond with our preceding study (Miao et al.,
2011).
3.3 HF and LF
Changes in HF and LF throughout the three
conditions are illustrated by Figure 5.
Figure 5: HF and LF
With the exception of Subject E, the main
tendency is obvious: both values of their LF and HF
Analysis of Electroencephalogram and Pulse Waves during Music Listening
33
decreased under the influence of music.
Moreover, together with Figure 3, a notable
phenomenon is observed: the decreasing rate of HF
from “Before” condition to “Music” condition is
consistent, in general, with the degree of averaging
in LLE of EEG under “Music” condition. Since the
latter is represented by the standard deviation, a
comparison is given in the following tables.
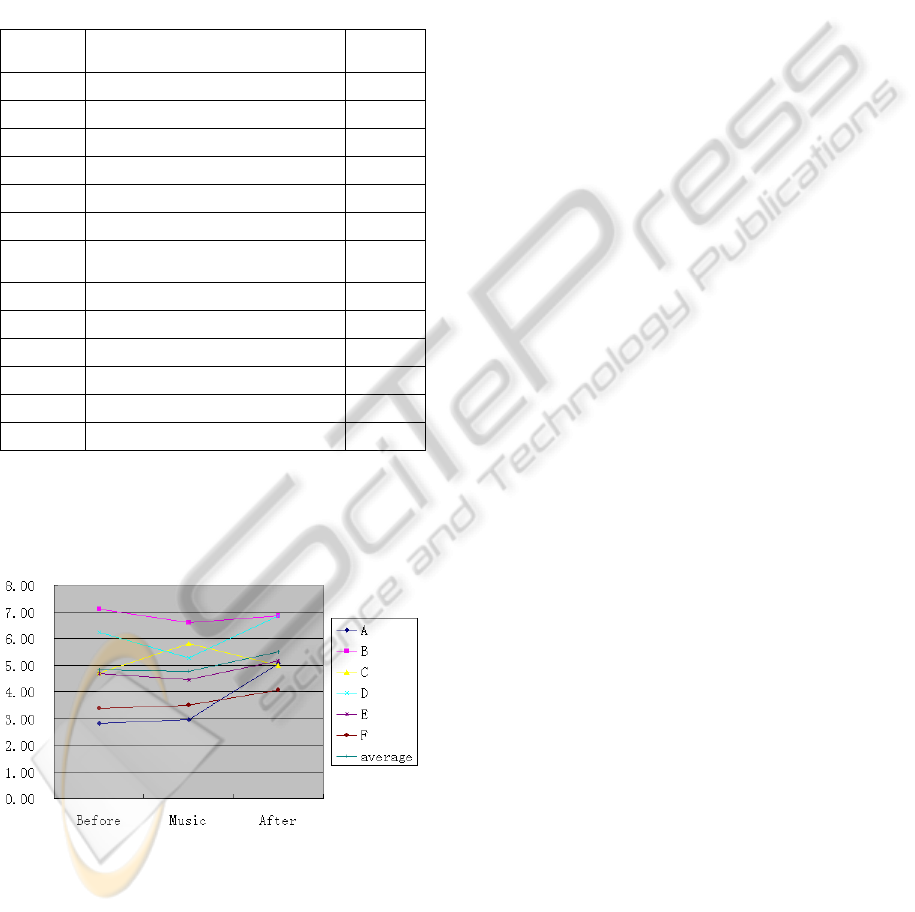
Table 1: Decreasing rate of HF and standard deviation of
LLE of 14 EEG channels under “Music” condition.
Subjects
Decreasing rate of HF from
"Before" to "Music"
Rank
A 39.77
2
B 58.25
1
C 31.72
3
D 7.31 5
E -50.38 6
F 13.46 4
Subjects
Standard deviation of LLE of 14
EEG channels during "Music"
Inverse
rank
A 27.31 2
B 17.22 1
C 28.62 3
D 34.55 4
E 42.17 6
F 36.39 5
3.4 ANB
Finally, we took into account changes of ANB, as
shown in Figure 6.
Figure 6: ANB
It can be observed that ANB of each subject was
maintained near the balance value 5 throughout the
three conditions, disregarding that for almost all of
them the LF and HF experienced a decrease and then
an increase.
4 CONCLUSIONS AND REMARK
This study observed changes in LLE of both scalp
EEG and finger plethysmogram, as well as LF and
HF components of heart rate variability. Several
significant tendencies were found out in all subjects
excluding one exception.
As a complement to our results, we discovered
later that the same tendencies can still be observed in
Subject E, who always served as an exception as
stated above, if he listened to his favourite songs. In
fact, according to an interview of the 6 subjects after
the experiment on their feelings towards the two
songs, Subject E harboured an antipathy, while the
rest 5 subjects felt indifferent to or showed some
appreciation for them.
We remark that not many studies in this field
exist so far evolving the joint analysis of LLE of
both EEG and plethysmogram. Furthermore, the
consideration of LF and HF is what distinguishes
this study from the previous work (Miao et al., 2011).
However, there still exist several limitations in
this study. The changes in LLE of plethysmogram
and ANB were not instrumental in the explanation,
and analysis was not performed in terms of the LLE
at each specific EEG channel. The underlying
relationship between the music effect and the
listener’s feeling towards the music is unclear. What
is more, to test with only 6 subjects hardly sufficed
to convince ourselves of the generality of the result.
To overcome these limitations is a subject for future
work.
ACKNOWLEDGEMENTS
The authors would like to express their sincere
appreciation to Nihon Kohden Corporation for
generously providing us with the measuring
instrument.
REFERENCES
Fraser, A.M. and Swinney, H.L. (1986). Independent
Coordinates for Strange Attractors from Mutual
Information. Phys Rev Lett., 33, 1134–1140.
Hu, Y., Wang, W., Suzuki, T. and Oyama-Higa, M. (2011).
Characteristic Extraction of Mental Disease Patients
by Nonlinear Analysis of Plethysmograms.
International Symposium on Computational Models
for Life Sciences, AIP Conference Proceedings 1371,
92-101.
EHST/ICGREEN 2012
34

Imanishi, A. and Oyama-Higa, M. (2006). The Relation
Between Observers’ Psychophysiological Conditions
and Human Errors During Monitoring Task. 2006
IEEE Conference on Systems, Man, and Cybernetics,
2035–2039.
Liu, H.F., Dai, Z.H., Li, W.F., Gong, X. and Yu, Z.H.
(2005). Noise Robust Estimates of the Largest
Lyapunov Exponent. Physics Letters A., 341, 119–127.
McCraty, R., Barrios-Choplin B., Atkinson M. and
Tomasino D. (1998). The Effects of Different Types of
Music on Mood, Tension, and Mental Clarity.
Alternative Therapies In Health And Medicine, 4(1),
75-84.
Miao, T., Oyama-Higa M., Sato S., Kojima J., Lin J. and
Sato, R. (2011). Plethysmogram and EEG: Effects of
Music and Voice Sound. International Symposium on
Computational Models for Life Sciences, AIP
Conference Proceedings 1371, 282-289.
Oyama-Higa, M. and Miao, T. (2006). Discovery and
Application of New Index for Cognitive Psychology.
2006 IEEE Conference on Systems, Man, and
Cybernetics, 2040–2044.
Oyama-Higa, M., Miao, T., Kaizu, S. and Kojima, J.
(2012). Mental Health Self-check System Using
"Lyspect". In preparation.
Oyama-Higa, M., Miao, T. and Mizuno-Matsumoto, Y.
(2006). Analysis of Dementia in Aged Subjects
Through Chaos Analysis of Fingertip Pulse Waves.
2006 IEEE Conference on Systems, Man, and
Cybernetics, 2863–2867.
Schneck, D.J. and Berger, D.S. (2006). The Music Effect:
Music Physiology and Clinical Applications (1st ed).
London: Jessica Kingsley Publishers.
Unkefer, R. F. (1990). Music Therapy in the Treatment of
Adults With Mental Disorders: Theoretical Bases and
Clinical Interventions. New York: Schirmer Books.
Analysis of Electroencephalogram and Pulse Waves during Music Listening
35
